Read the drawing commands and expand the complete standalone program.
Actual figure
Inspect native Asymptote output, with TeX labels and printable 3D projections.
One change
Compare a named baseline, edit the source and reuse SVG, vector PDF or PNG output.
Read from the beginning or jump to a stable example ID. Each example includes
its complete input and captured result. Copy link preserves the address of the
guide you are reading, including its current domain and path.
The sixteen compositions in the pinned ROOT Asymptote atlas supply the
starting ideas. This tour develops them into independent, explained programs
and adds data graphics, language features, native 3D surfaces and page composition.
Every program is complete. The concise view shows the drawing operations;
expand the standalone source to see its explicit imports, palette, TeX engine,
white canvas and export settings. All data are synthetic and inline.
Run a downloaded program with asy -noView -f pdf ASY-01-001.asy.
Trigonometric functions use radians. The dir constructor uses degrees.
Native 3D examples use settings.render=0 and fixed cameras for printable
vector projections. They have no interactive model embedded in the PDF.
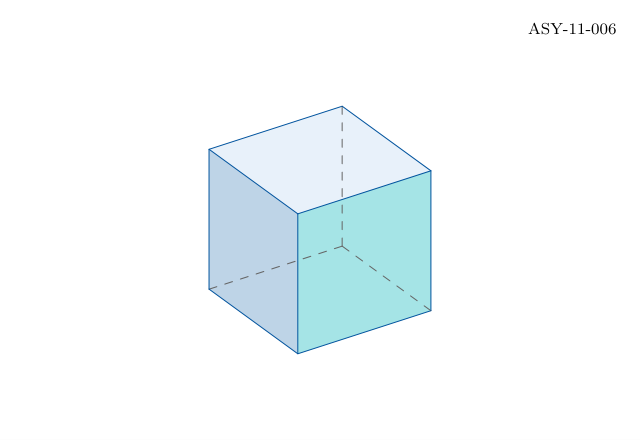
Explicitly projected wireframes retain all their lines; selected hidden cube
edges are styled manually. Sampling a curve, integrating an ODE, choosing a
projection and changing a pen are different operations.
Create your first plot
Asymptote has a command-line workflow, much like gnuplot: write a text file,
run the plotting program and open the output. Its source files use .asy.
You can use any text editor. The asy command compiles the drawing; a separate
viewer displays the result. The optional xasy graphical editor is explained
in CLI, interactive prompt and GUI.
1. Check the tools
Install Asymptote and a TeX distribution such as TeX Live or MacTeX, then check
that both commands are on your terminal's PATH:
asy --version
pdflatex --version
This first example uses pdfLaTeX to typeset the axis labels. The graph module
ships with Asymptote. See the official installation instructions
for your platform.
2. Save a complete program
Create a working directory, open a new text file and save the following as
first-plot.asy:
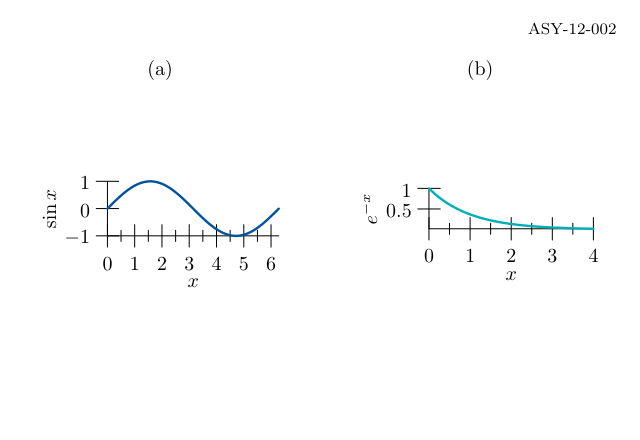
import graph loads plotting and axis helpers. f defines a real-valued
function; sin uses radians. graph samples that function from zero to
2*pi, and draw draws the sampled path with the chosen pen. The axis
commands add labels and ticks. size fits the figure into the requested
width and height in PostScript points; one point is 1/72 inch.
3. Compile from the terminal
Change to the directory containing first-plot.asy and run:
asy -noView -tex pdflatex -f pdf first-plot.asy
The result is first-plot.pdf in the same directory. -f pdf selects the
output format, -tex pdflatex selects the TeX engine, and -noView keeps the
command suitable for terminal jobs and automated builds. Asymptote writes
the picture at the end of this program; this minimal example needs no
explicit shipout command.
4. Preview, edit and rebuild
Open the PDF in your usual viewer. To ask Asymptote to launch its configured
viewer after compiling, use the capital -V option:
asy -V -tex pdflatex -f pdf first-plot.asy
Change sin(x) to cos(x), save the source and run the command again.
The PDF is regenerated from the edited program. A viewer window opened by
-V is a preview of the output; the drawing instructions remain in the
source file. See drawing in batch mode and the
graph module reference.
5. Reuse the figure
PDF is a vector output suitable for inclusion in a document. For SVG or a
PNG preview, these optional Poppler commands convert the verified PDF:
The second command creates first-plot.png at 150 dpi. These converters
require Poppler; they are separate from the asy compiler.
CLI, interactive prompt and GUI
Choose the interface that fits the task:
Interface
How to start
Typical use
Script / batch mode
asy -noView -f pdf file.asy
Rebuild figures from saved source; use shell scripts or Make.
Compile and preview
asy -V -f pdf file.asy
Recompile a saved program and open the result in a viewer.
Interactive prompt
asy
Try statements one at a time and build up a picture interactively.
Graphical editor
xasy, when installed
Move and edit graphical objects, then save Asymptote source.
For the minimal plot above, keep -tex pdflatex in the compilation command.
The downloaded tour programs already select their TeX engine in the source.
Try the interactive prompt
Start asy without a filename. Enter these lines one at a time at its prompt:
draw((0,0)--(100,100));
erase
quit
draw adds a line and updates the displayed picture. erase clears the
current picture; quit returns to the shell. These last two are special
interactive commands. The prompt supports command history and completion.
The interactive-mode manual describes further commands.
Use a GUI when useful
xasy is an optional graphical editor for Asymptote. It can move objects,
add drawing elements and save the result as Asymptote source. Availability
and dependencies depend on the installation; having asy on PATH does
not guarantee that xasy is installed. See the GUI overview
and GUI installation instructions. The script workflow above
works independently of this editor.
How this compares with gnuplot
Task
gnuplot
Asymptote
Saved source
Plotting commands, often in a .gp file
A typed graphics program in a .asy file
Run a file
gnuplot plot.gp
asy -noView -tex pdflatex -f pdf plot.asy
Draw a function
plot sin(x)
import graph; followed by draw(graph(sin, 0, 2*pi));
Choose output
Terminal and output settings in the script
-f pdf on the CLI or settings in the source
Explore interactively
Start gnuplot for its prompt
Start asy for its prompt; use -V to preview saved programs
When following a worked example in this tour, download its completeAsymptote source file. The concise drawing panel omits setup such as imports,
palette definitions, canvas sizing and output settings. For example:
asy -noView -f pdf ASY-01-001.asy
If asy or pdflatex is not found, check the installation and PATH.
If compilation succeeds but no window appears, open the generated PDF or
use -V. If a copied snippet reports undefined names, start with the
complete standalone source instead of the focused drawing panel.
The atlas supplies the initial composition ideas. These programs use independent
coordinates, fixtures and teaching explanations, and the plotting chapters add
new examples. No poster builder is required. ATLAS_PANEL properties and
sources/atlas-provenance.json retain the sixteen-panel mapping and pinned hash.
Asymptote, TeX, Poppler and their installed libraries remain external dependencies.
Compilation completed successfully. No compiler messages were emitted.
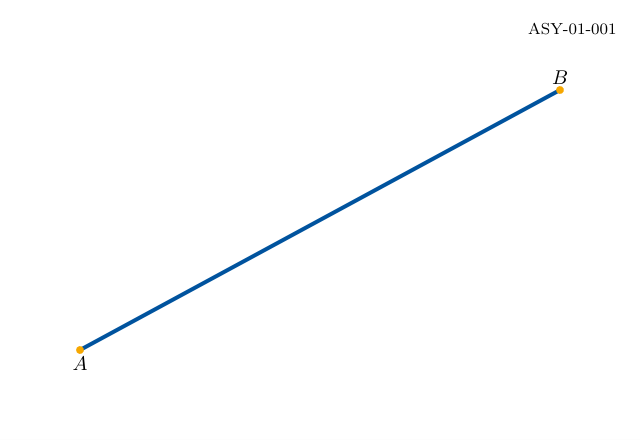
Command or parameter
Meaning
pair
A two-component coordinate value.
--
Connect positions with a straight segment.
linewidth(2)
Specify the stroke in PostScript points.
Complete standalone Asymptote program
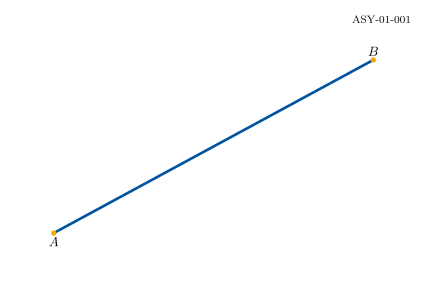
settings.tex="pdflatex";settings.outformat="pdf";settings.render=0;settings.prc=false;settings.v3d=false;defaultpen(fontsize(10pt));penBlue=rgb(0,84/255.0,159/255.0),Teal=rgb(0,177/255.0,183/255.0);penOrange=rgb(246/255.0,168/255.0,0),Green=rgb(87/255.0,171/255.0,39/255.0);penGrey=gray(.4),Light=gray(.92),Wash=rgb(232/255.0,241/255.0,250/255.0);stringfigureID="ASY-01-001";size(320,220,IgnoreAspect);fill(box((0,0),(320,220)),white);// BEGIN DRAWINGdraw((40,45)--(280,175),Blue+linewidth(2));dot((40,45),Orange+4);dot((280,175),Orange+4);label("$A$",(40,45),S);label("$B$",(280,175),N);// END DRAWINGlabel("ASY-01-001",(310,210),SW,fontsize(8pt));shipout(figureID);
Compilation completed successfully. No compiler messages were emitted.
Command or parameter
Meaning
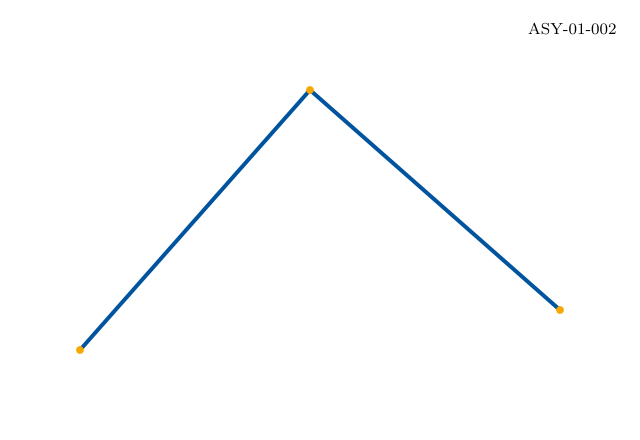
path
Store connected geometry as a value.
new pair[]
Create an array of points for a single dot call.
Complete standalone Asymptote program
settings.tex="pdflatex";settings.outformat="pdf";settings.render=0;settings.prc=false;settings.v3d=false;defaultpen(fontsize(10pt));penBlue=rgb(0,84/255.0,159/255.0),Teal=rgb(0,177/255.0,183/255.0);penOrange=rgb(246/255.0,168/255.0,0),Green=rgb(87/255.0,171/255.0,39/255.0);penGrey=gray(.4),Light=gray(.92),Wash=rgb(232/255.0,241/255.0,250/255.0);stringfigureID="ASY-01-002";size(320,220,IgnoreAspect);fill(box((0,0),(320,220)),white);// BEGIN DRAWINGpathroute=(40,45)--(155,175)--(280,65);draw(route,Blue+2);dot(newpair[]{(40,45),(155,175),(280,65)},Orange+4);// END DRAWINGlabel("ASY-01-002",(310,210),SW,fontsize(8pt));shipout(figureID);
Compilation completed successfully. No compiler messages were emitted.
Command or parameter
Meaning
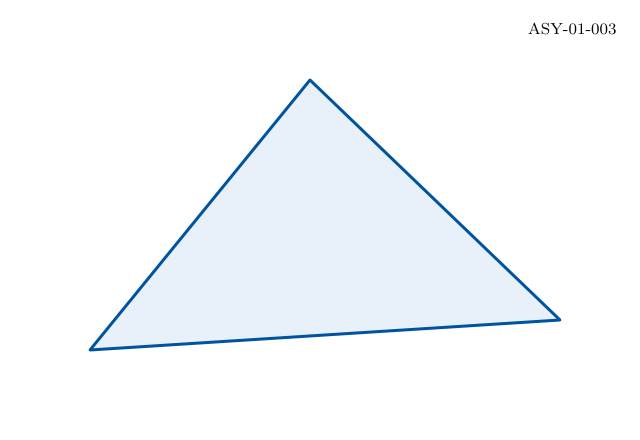
cycle
Connect the final point back to the first.
filldraw
Fill first, then draw the boundary.
Complete standalone Asymptote program
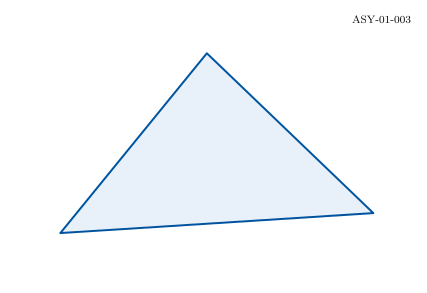
settings.tex="pdflatex";settings.outformat="pdf";settings.render=0;settings.prc=false;settings.v3d=false;defaultpen(fontsize(10pt));penBlue=rgb(0,84/255.0,159/255.0),Teal=rgb(0,177/255.0,183/255.0);penOrange=rgb(246/255.0,168/255.0,0),Green=rgb(87/255.0,171/255.0,39/255.0);penGrey=gray(.4),Light=gray(.92),Wash=rgb(232/255.0,241/255.0,250/255.0);stringfigureID="ASY-01-003";size(320,220,IgnoreAspect);fill(box((0,0),(320,220)),white);// BEGIN DRAWINGpathtriangle=(45,45)--(155,180)--(280,60)--cycle;filldraw(triangle,Wash,Blue+1.5);// END DRAWINGlabel("ASY-01-003",(310,210),SW,fontsize(8pt));shipout(figureID);
Compilation completed successfully. No compiler messages were emitted.
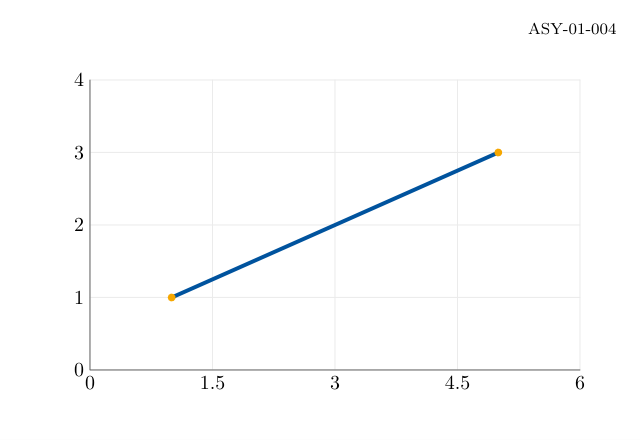
Command or parameter
Meaning
P(x,y)
Map data coordinates into the plotting rectangle.
for
Repeat drawing operations at computed positions.
format
Typeset compact numeric tick labels.
Complete standalone Asymptote program
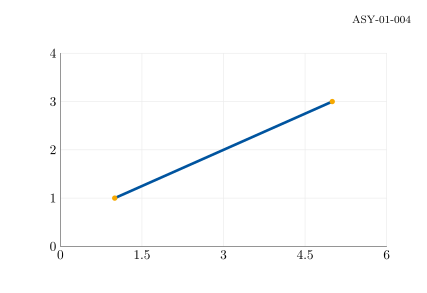
settings.tex="pdflatex";settings.outformat="pdf";settings.render=0;settings.prc=false;settings.v3d=false;defaultpen(fontsize(10pt));penBlue=rgb(0,84/255.0,159/255.0),Teal=rgb(0,177/255.0,183/255.0);penOrange=rgb(246/255.0,168/255.0,0),Green=rgb(87/255.0,171/255.0,39/255.0);penGrey=gray(.4),Light=gray(.92),Wash=rgb(232/255.0,241/255.0,250/255.0);stringfigureID="ASY-01-004";size(320,220,IgnoreAspect);fill(box((0,0),(320,220)),white);// BEGIN DRAWINGrealxmin=0,xmax=6,ymin=0,ymax=4;pairP(realx,realy){return(45+245*(x-xmin)/(xmax-xmin),35+145*(y-ymin)/(ymax-ymin));}for(inti=0;i<=4;++i){realx=xmin+i*(xmax-xmin)/4,y=ymin+i*(ymax-ymin)/4;draw(P(x,ymin)--P(x,ymax),Light);draw(P(xmin,y)--P(xmax,y),Light);label(format("$%.3g$",x),P(x,ymin),S);label(format("$%.3g$",y),P(xmin,y),W);}draw(P(xmin,ymax)--P(xmin,ymin)--P(xmax,ymin),Grey);draw(P(1,1)--P(5,3),Blue+2);dot(P(1,1),Orange+4);dot(P(5,3),Orange+4);// END DRAWINGlabel("ASY-01-004",(310,210),SW,fontsize(8pt));shipout(figureID);
Compilation completed successfully. No compiler messages were emitted.
Command or parameter
Meaning
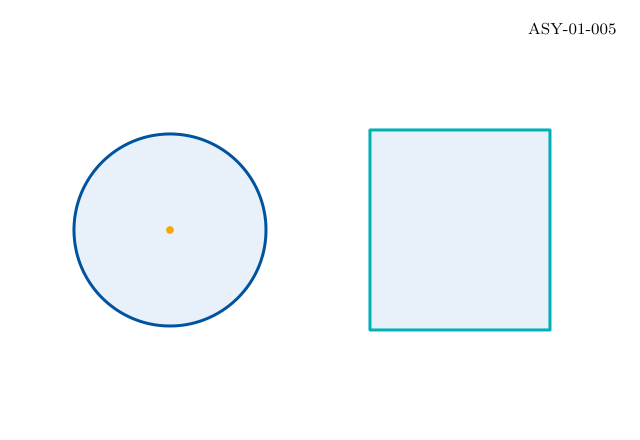
circle(centre,radius)
Construct a circle as a path.
box(lower,upper)
Construct a rectangular closed path.
Complete standalone Asymptote program
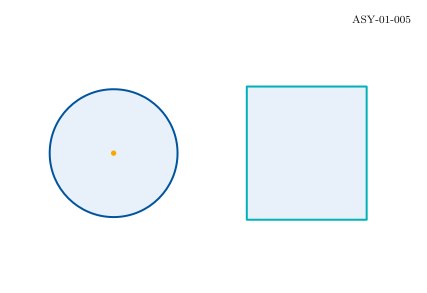
settings.tex="pdflatex";settings.outformat="pdf";settings.render=0;settings.prc=false;settings.v3d=false;defaultpen(fontsize(10pt));penBlue=rgb(0,84/255.0,159/255.0),Teal=rgb(0,177/255.0,183/255.0);penOrange=rgb(246/255.0,168/255.0,0),Green=rgb(87/255.0,171/255.0,39/255.0);penGrey=gray(.4),Light=gray(.92),Wash=rgb(232/255.0,241/255.0,250/255.0);stringfigureID="ASY-01-005";size(320,220,IgnoreAspect);fill(box((0,0),(320,220)),white);// BEGIN DRAWINGfilldraw(circle((85,105),48),Wash,Blue+1.5);filldraw(box((185,55),(275,155)),Wash,Teal+1.5);dot((85,105),Orange+4);// END DRAWINGlabel("ASY-01-005",(310,210),SW,fontsize(8pt));shipout(figureID);
Compilation completed successfully. No compiler messages were emitted.
Command or parameter
Meaning
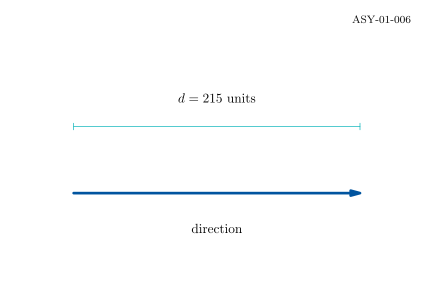
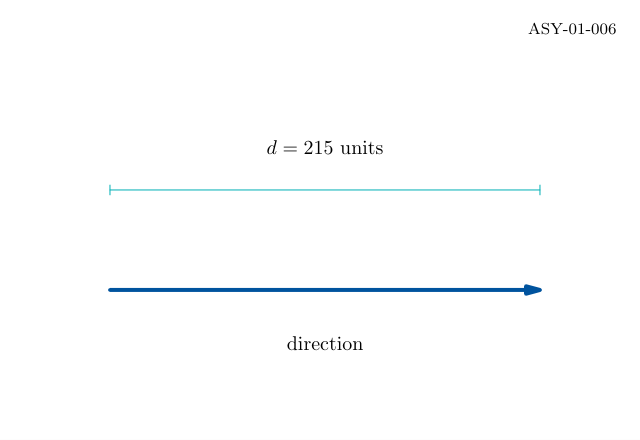
Arrow(7)
Attach an arrowhead seven points long.
Bars(5)
Attach short perpendicular bars to both ends.
label
Typeset text or mathematics at a chosen position.
Complete standalone Asymptote program
settings.tex="pdflatex";settings.outformat="pdf";settings.render=0;settings.prc=false;settings.v3d=false;defaultpen(fontsize(10pt));penBlue=rgb(0,84/255.0,159/255.0),Teal=rgb(0,177/255.0,183/255.0);penOrange=rgb(246/255.0,168/255.0,0),Green=rgb(87/255.0,171/255.0,39/255.0);penGrey=gray(.4),Light=gray(.92),Wash=rgb(232/255.0,241/255.0,250/255.0);stringfigureID="ASY-01-006";size(320,220,IgnoreAspect);fill(box((0,0),(320,220)),white);// BEGIN DRAWINGdraw((55,75)--(270,75),Blue+2,Arrow(7));draw((55,125)--(270,125),Teal,Bars(5));label("$d=215$ units",(162.5,140),N);label("direction",(162.5,55),S);// END DRAWINGlabel("ASY-01-006",(310,210),SW,fontsize(8pt));shipout(figureID);
Compilation completed successfully. No compiler messages were emitted.
Command or parameter
Meaning
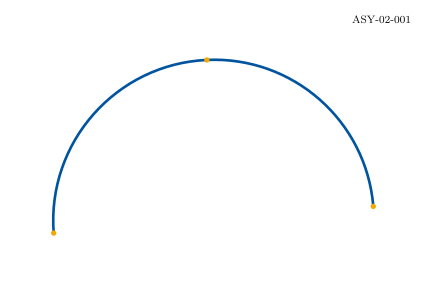
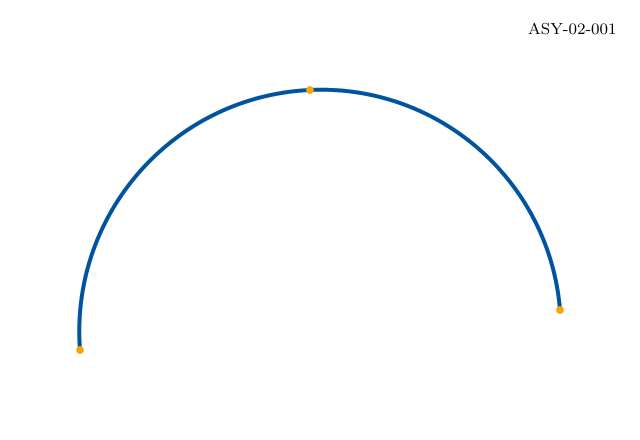
..
Ask the Hobby algorithm to choose cubic controls.
Knots
The path passes through the supplied points.
Complete standalone Asymptote program
settings.tex="pdflatex";settings.outformat="pdf";settings.render=0;settings.prc=false;settings.v3d=false;defaultpen(fontsize(10pt));penBlue=rgb(0,84/255.0,159/255.0),Teal=rgb(0,177/255.0,183/255.0);penOrange=rgb(246/255.0,168/255.0,0),Green=rgb(87/255.0,171/255.0,39/255.0);penGrey=gray(.4),Light=gray(.92),Wash=rgb(232/255.0,241/255.0,250/255.0);stringfigureID="ASY-02-001";size(320,220,IgnoreAspect);fill(box((0,0),(320,220)),white);// BEGIN DRAWINGpathp=(40,45)..(155,175)..(280,65);draw(p,Blue+2);dot(newpair[]{(40,45),(155,175),(280,65)},Orange+4);// END DRAWINGlabel("ASY-02-001",(310,210),SW,fontsize(8pt));shipout(figureID);
Compilation completed successfully. No compiler messages were emitted.
Command or parameter
Meaning
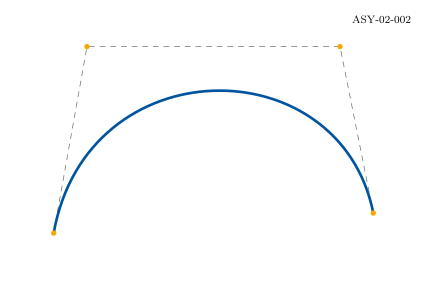
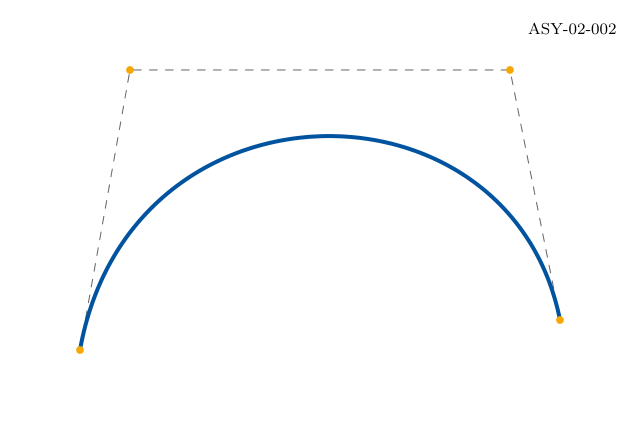
controls b and c
Set both handles of one cubic segment.
Dashed polygon
Show the relationship between handles and endpoints.
Complete standalone Asymptote program
settings.tex="pdflatex";settings.outformat="pdf";settings.render=0;settings.prc=false;settings.v3d=false;defaultpen(fontsize(10pt));penBlue=rgb(0,84/255.0,159/255.0),Teal=rgb(0,177/255.0,183/255.0);penOrange=rgb(246/255.0,168/255.0,0),Green=rgb(87/255.0,171/255.0,39/255.0);penGrey=gray(.4),Light=gray(.92),Wash=rgb(232/255.0,241/255.0,250/255.0);stringfigureID="ASY-02-002";size(320,220,IgnoreAspect);fill(box((0,0),(320,220)),white);// BEGIN DRAWINGpaira=(40,45),b=(65,185),c=(255,185),d=(280,60);draw(a--b--c--d,Grey+dashed);draw(a..controlsbandc..d,Blue+2);dot(newpair[]{a,b,c,d},Orange+4);// END DRAWINGlabel("ASY-02-002",(310,210),SW,fontsize(8pt));shipout(figureID);
Compilation completed successfully. No compiler messages were emitted.
Command or parameter
Meaning
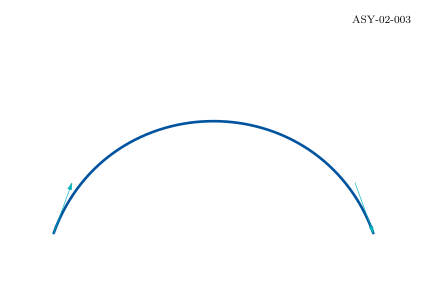
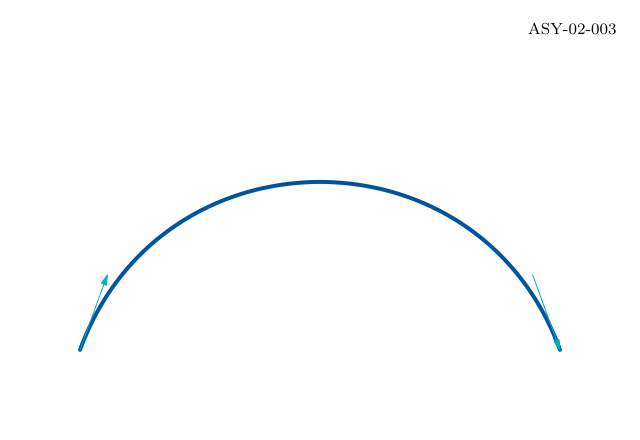
dir(angle)
Convert a direction in degrees into a unit pair.
{direction}
Constrain a path tangent at a knot.
Complete standalone Asymptote program
settings.tex="pdflatex";settings.outformat="pdf";settings.render=0;settings.prc=false;settings.v3d=false;defaultpen(fontsize(10pt));penBlue=rgb(0,84/255.0,159/255.0),Teal=rgb(0,177/255.0,183/255.0);penOrange=rgb(246/255.0,168/255.0,0),Green=rgb(87/255.0,171/255.0,39/255.0);penGrey=gray(.4),Light=gray(.92),Wash=rgb(232/255.0,241/255.0,250/255.0);stringfigureID="ASY-02-003";size(320,220,IgnoreAspect);fill(box((0,0),(320,220)),white);// BEGIN DRAWINGpathp=(40,45){dir(70)}..{dir(-70)}(280,45);draw(p,Blue+2);draw((40,45)--(40,45)+40*dir(70),Teal,Arrow(5));draw((280,45)-40*dir(-70)--(280,45),Teal,Arrow(5));// END DRAWINGlabel("ASY-02-003",(310,210),SW,fontsize(8pt));shipout(figureID);
Compilation completed successfully. No compiler messages were emitted.
Command or parameter
Meaning
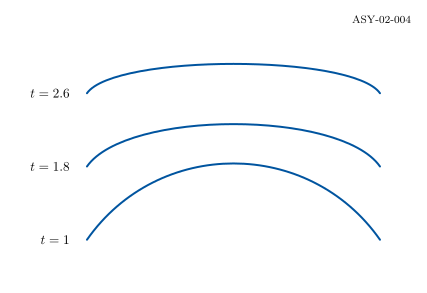
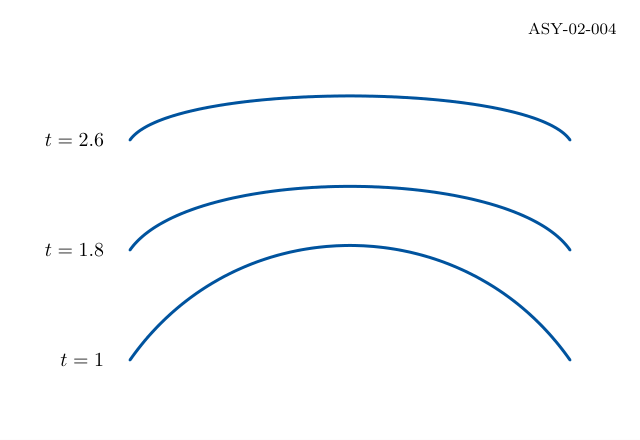
tension
Change the relation between handles and the chord.
Translated rows
Keep shape comparisons separate.
Complete standalone Asymptote program
settings.tex="pdflatex";settings.outformat="pdf";settings.render=0;settings.prc=false;settings.v3d=false;defaultpen(fontsize(10pt));penBlue=rgb(0,84/255.0,159/255.0),Teal=rgb(0,177/255.0,183/255.0);penOrange=rgb(246/255.0,168/255.0,0),Green=rgb(87/255.0,171/255.0,39/255.0);penGrey=gray(.4),Light=gray(.92),Wash=rgb(232/255.0,241/255.0,250/255.0);stringfigureID="ASY-02-004";size(320,220,IgnoreAspect);fill(box((0,0),(320,220)),white);// BEGIN DRAWINGfor(intk=0;k<3;++k){realt=1+.8*k;pathp=(65,40+55*k){dir(55)}..tensiont..{dir(-55)}(285,40+55*k);draw(p,Blue+1.5);label(format("$t=%.1f$",t),(55,40+55*k),W);}// END DRAWINGlabel("ASY-02-004",(310,210),SW,fontsize(8pt));shipout(figureID);
Compilation completed successfully. No compiler messages were emitted.
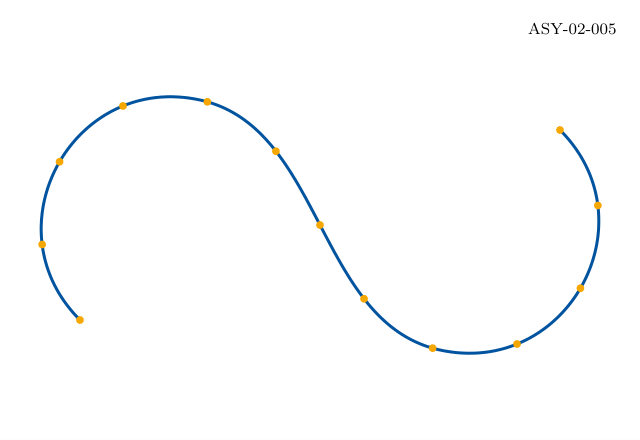
Command or parameter
Meaning
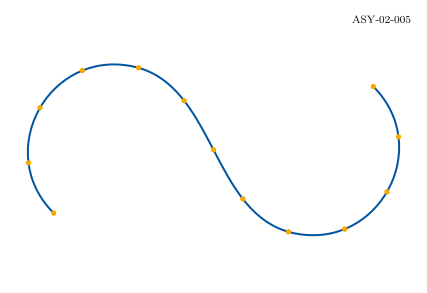
arclength(p)
Measure the entire path.
arctime(p,d)
Find path time at distance d.
point(p,t)
Evaluate a position at path time t.
Complete standalone Asymptote program
settings.tex="pdflatex";settings.outformat="pdf";settings.render=0;settings.prc=false;settings.v3d=false;defaultpen(fontsize(10pt));penBlue=rgb(0,84/255.0,159/255.0),Teal=rgb(0,177/255.0,183/255.0);penOrange=rgb(246/255.0,168/255.0,0),Green=rgb(87/255.0,171/255.0,39/255.0);penGrey=gray(.4),Light=gray(.92),Wash=rgb(232/255.0,241/255.0,250/255.0);stringfigureID="ASY-02-005";size(320,220,IgnoreAspect);fill(box((0,0),(320,220)),white);// BEGIN DRAWINGpathp=(40,60)..(100,170)..(220,45)..(280,155);draw(p,Blue+1.5);realL=arclength(p);for(inti=0;i<=12;++i)dot(point(p,arctime(p,i*L/12)),Orange+4);// END DRAWINGlabel("ASY-02-005",(310,210),SW,fontsize(8pt));shipout(figureID);
Compilation completed successfully. No compiler messages were emitted.
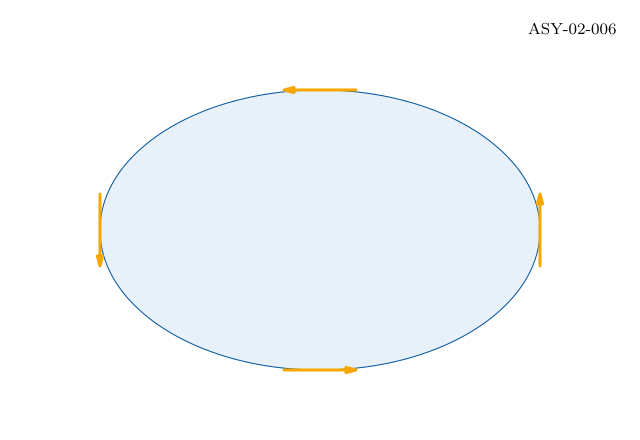
Command or parameter
Meaning
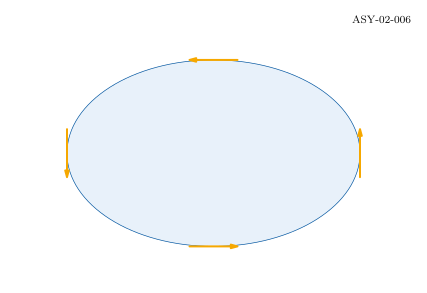
unitcircle
A reusable unit-radius circle.
dir(p,t)
Evaluate the path tangent.
unit(vector)
Normalize a nonzero pair.
Complete standalone Asymptote program
settings.tex="pdflatex";settings.outformat="pdf";settings.render=0;settings.prc=false;settings.v3d=false;defaultpen(fontsize(10pt));penBlue=rgb(0,84/255.0,159/255.0),Teal=rgb(0,177/255.0,183/255.0);penOrange=rgb(246/255.0,168/255.0,0),Green=rgb(87/255.0,171/255.0,39/255.0);penGrey=gray(.4),Light=gray(.92),Wash=rgb(232/255.0,241/255.0,250/255.0);stringfigureID="ASY-02-006";size(320,220,IgnoreAspect);fill(box((0,0),(320,220)),white);// BEGIN DRAWINGpathp=shift(160,105)*xscale(110)*yscale(70)*unitcircle;filldraw(p,Wash,Blue);for(inti=0;i<4;++i){realt=i*length(p)/4.0;pairq=point(p,t),v=unit(dir(p,t));draw(q-18*v--q+18*v,Orange+1.5,Arrow(5));}// END DRAWINGlabel("ASY-02-006",(310,210),SW,fontsize(8pt));shipout(figureID);
Compilation completed successfully. No compiler messages were emitted.
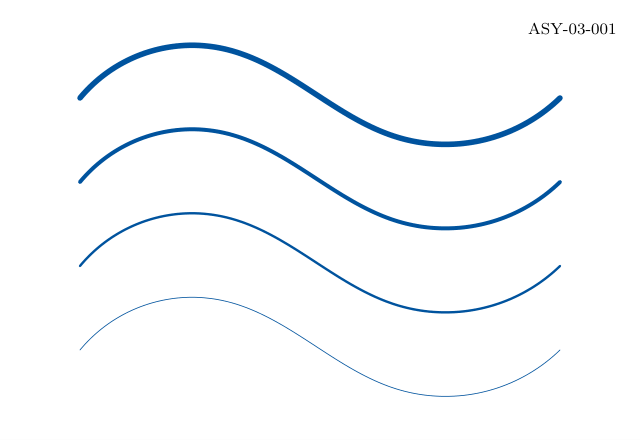
Command or parameter
Meaning
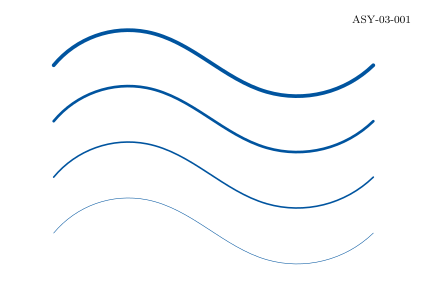
pen + pen
Combine colour, width and line-style attributes.
linewidth
Choose a width in physical points.
Complete standalone Asymptote program
settings.tex="pdflatex";settings.outformat="pdf";settings.render=0;settings.prc=false;settings.v3d=false;defaultpen(fontsize(10pt));penBlue=rgb(0,84/255.0,159/255.0),Teal=rgb(0,177/255.0,183/255.0);penOrange=rgb(246/255.0,168/255.0,0),Green=rgb(87/255.0,171/255.0,39/255.0);penGrey=gray(.4),Light=gray(.92),Wash=rgb(232/255.0,241/255.0,250/255.0);stringfigureID="ASY-03-001";size(320,220,IgnoreAspect);fill(box((0,0),(320,220)),white);// BEGIN DRAWINGpathwave=(40,0)..(110,25)..(200,-20)..(280,0);for(intk=0;k<4;++k)draw(shift(0,45+42*k)*wave,Blue+linewidth(.4+.8*k));// END DRAWINGlabel("ASY-03-001",(310,210),SW,fontsize(8pt));shipout(figureID);
Compilation completed successfully. No compiler messages were emitted.
Command or parameter
Meaning
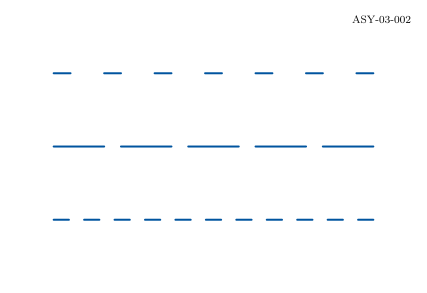
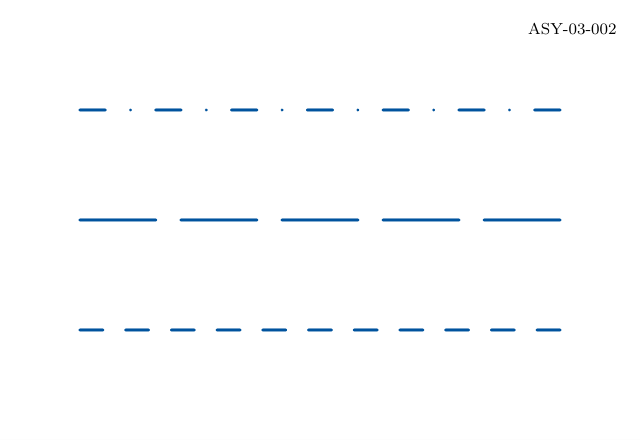
dashed
Use the standard short-dash pattern.
longdashed
Increase dash length.
dashdotted
Alternate dashes and dots.
Complete standalone Asymptote program
settings.tex="pdflatex";settings.outformat="pdf";settings.render=0;settings.prc=false;settings.v3d=false;defaultpen(fontsize(10pt));penBlue=rgb(0,84/255.0,159/255.0),Teal=rgb(0,177/255.0,183/255.0);penOrange=rgb(246/255.0,168/255.0,0),Green=rgb(87/255.0,171/255.0,39/255.0);penGrey=gray(.4),Light=gray(.92),Wash=rgb(232/255.0,241/255.0,250/255.0);stringfigureID="ASY-03-002";size(320,220,IgnoreAspect);fill(box((0,0),(320,220)),white);// BEGIN DRAWINGdraw((40,55)--(280,55),Blue+1.5+dashed);draw((40,110)--(280,110),Blue+1.5+longdashed);draw((40,165)--(280,165),Blue+1.5+dashdotted);// END DRAWINGlabel("ASY-03-002",(310,210),SW,fontsize(8pt));shipout(figureID);
Compilation completed successfully. No compiler messages were emitted.
Command or parameter
Meaning
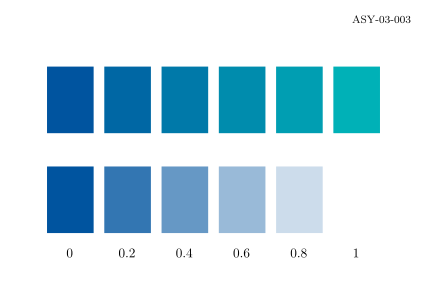
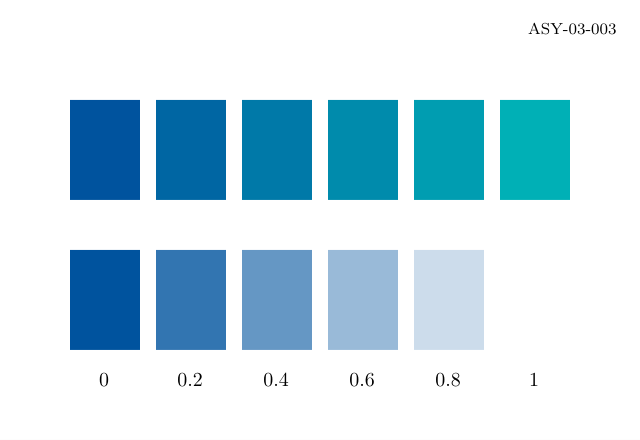
interp(a,b,t)
Blend between two colours.
opacity(alpha)
Use alpha between zero and one.
Complete standalone Asymptote program
settings.tex="pdflatex";settings.outformat="pdf";settings.render=0;settings.prc=false;settings.v3d=false;defaultpen(fontsize(10pt));penBlue=rgb(0,84/255.0,159/255.0),Teal=rgb(0,177/255.0,183/255.0);penOrange=rgb(246/255.0,168/255.0,0),Green=rgb(87/255.0,171/255.0,39/255.0);penGrey=gray(.4),Light=gray(.92),Wash=rgb(232/255.0,241/255.0,250/255.0);stringfigureID="ASY-03-003";size(320,220,IgnoreAspect);fill(box((0,0),(320,220)),white);// BEGIN DRAWINGfor(intk=0;k<6;++k){realt=k/5.0;fill(box((35+43*k,120),(70+43*k,170)),interp(Blue,Teal,t));fill(box((35+43*k,45),(70+43*k,95)),Blue+opacity(1-t));label(format("%.1f",t),(52+43*k,30));}// END DRAWINGlabel("ASY-03-003",(310,210),SW,fontsize(8pt));shipout(figureID);
Compilation completed successfully. No compiler messages were emitted.
Command or parameter
Meaning
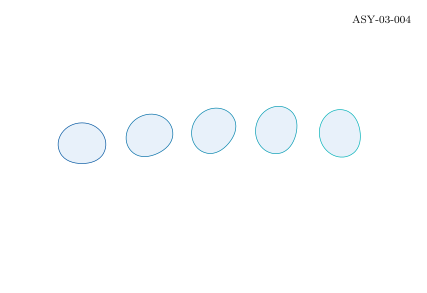
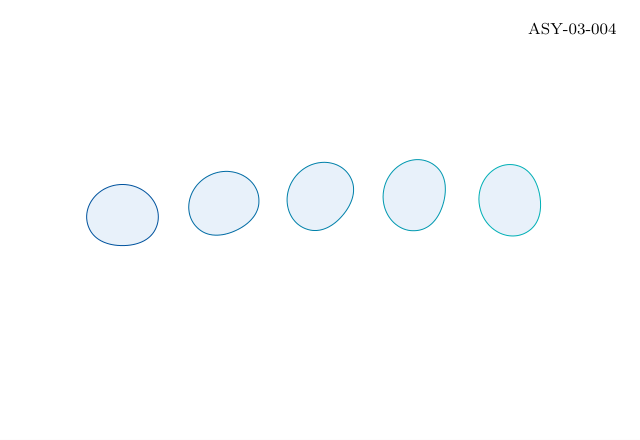
transform * path
Apply a transform to stored geometry.
Rightmost first
Scale, then rotate, then shift in this expression.
Complete standalone Asymptote program
settings.tex="pdflatex";settings.outformat="pdf";settings.render=0;settings.prc=false;settings.v3d=false;defaultpen(fontsize(10pt));penBlue=rgb(0,84/255.0,159/255.0),Teal=rgb(0,177/255.0,183/255.0);penOrange=rgb(246/255.0,168/255.0,0),Green=rgb(87/255.0,171/255.0,39/255.0);penGrey=gray(.4),Light=gray(.92),Wash=rgb(232/255.0,241/255.0,250/255.0);stringfigureID="ASY-03-004";size(320,220,IgnoreAspect);fill(box((0,0),(320,220)),white);// BEGIN DRAWINGpathpetal=(0,0)..(25,35)..(50,0)..(25,-12)..cycle;for(intk=0;k<5;++k)filldraw(shift(45+55*k,105)*rotate(25*k)*scale(.65)*petal,Wash,interp(Blue,Teal,k/4.0));// END DRAWINGlabel("ASY-03-004",(310,210),SW,fontsize(8pt));shipout(figureID);
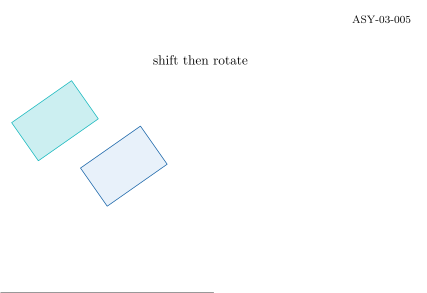
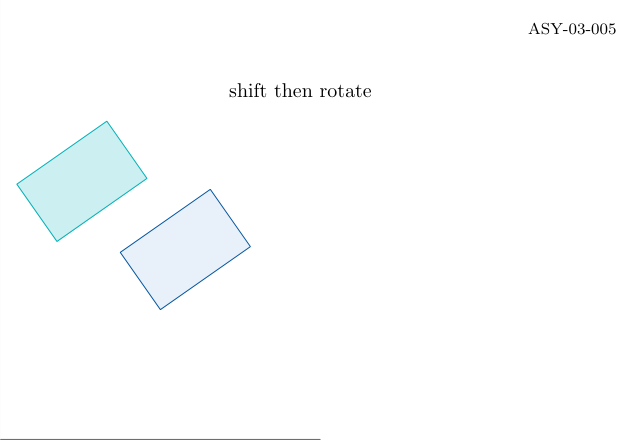
pathshape=box((0,0),(55,35));transforma=shift(80,65)*rotate(35);transformb=rotate(35)*shift(80,65);filldraw(a*shape,Wash,Blue);filldraw(b*shape,interp(white,Teal,.2),Teal);draw((0,0)--(160,0),Grey);label("shift then rotate",(150,175));
Actual output
ASY-03-005 · Rendered by Asymptote
Asymptote · exit 0
Native compiler log
Compilation completed successfully. No compiler messages were emitted.
Command or parameter
Meaning
a*b
Apply b before a.
Asymmetric shape
Make the effect of order visible.
Complete standalone Asymptote program
settings.tex="pdflatex";settings.outformat="pdf";settings.render=0;settings.prc=false;settings.v3d=false;defaultpen(fontsize(10pt));penBlue=rgb(0,84/255.0,159/255.0),Teal=rgb(0,177/255.0,183/255.0);penOrange=rgb(246/255.0,168/255.0,0),Green=rgb(87/255.0,171/255.0,39/255.0);penGrey=gray(.4),Light=gray(.92),Wash=rgb(232/255.0,241/255.0,250/255.0);stringfigureID="ASY-03-005";size(320,220,IgnoreAspect);fill(box((0,0),(320,220)),white);// BEGIN DRAWINGpathshape=box((0,0),(55,35));transforma=shift(80,65)*rotate(35);transformb=rotate(35)*shift(80,65);filldraw(a*shape,Wash,Blue);filldraw(b*shape,interp(white,Teal,.2),Teal);draw((0,0)--(160,0),Grey);label("shift then rotate",(150,175));// END DRAWINGlabel("ASY-03-005",(310,210),SW,fontsize(8pt));shipout(figureID);
Compilation completed successfully. No compiler messages were emitted.
Command or parameter
Meaning
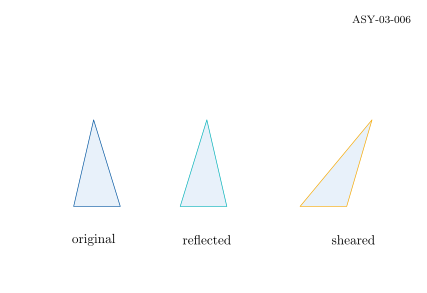
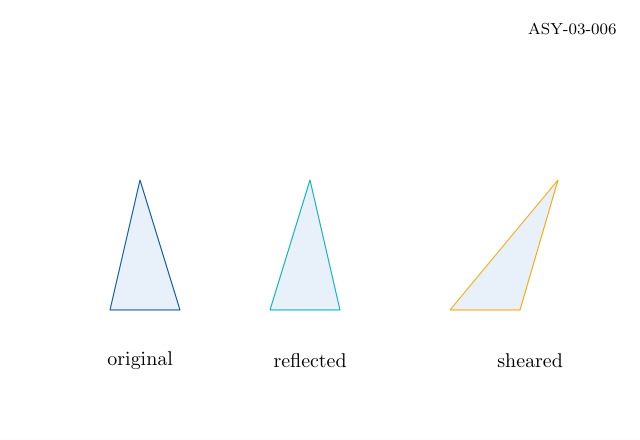
xscale(-1)
Reflect the horizontal coordinate.
slant(.6)
Apply x = x + 0.6*y.
Complete standalone Asymptote program
settings.tex="pdflatex";settings.outformat="pdf";settings.render=0;settings.prc=false;settings.v3d=false;defaultpen(fontsize(10pt));penBlue=rgb(0,84/255.0,159/255.0),Teal=rgb(0,177/255.0,183/255.0);penOrange=rgb(246/255.0,168/255.0,0),Green=rgb(87/255.0,171/255.0,39/255.0);penGrey=gray(.4),Light=gray(.92),Wash=rgb(232/255.0,241/255.0,250/255.0);stringfigureID="ASY-03-006";size(320,220,IgnoreAspect);fill(box((0,0),(320,220)),white);// BEGIN DRAWINGpathp=(0,0)--(35,0)--(15,65)--cycle;filldraw(shift(55,65)*p,Wash,Blue);filldraw(shift(170,65)*xscale(-1)*p,Wash,Teal);filldraw(shift(225,65)*slant(.6)*p,Wash,Orange);label("original",(70,40));label("reflected",(155,40));label("sheared",(265,40));// END DRAWINGlabel("ASY-03-006",(310,210),SW,fontsize(8pt));shipout(figureID);
Compilation completed successfully. No compiler messages were emitted.
Command or parameter
Meaning
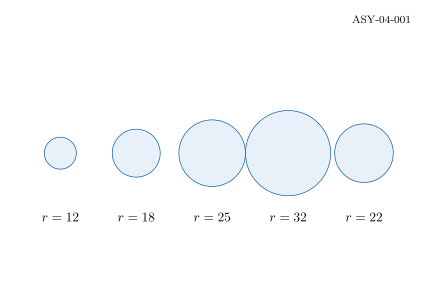
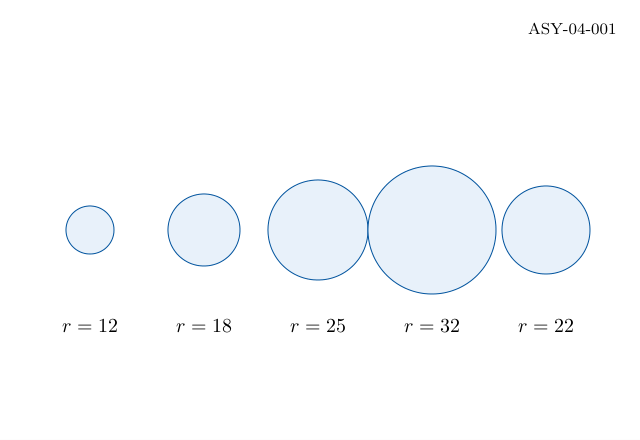
real[]
Store numeric data in a typed array.
.length
Read the number of entries.
Array indexing
Asymptote arrays start at zero.
Complete standalone Asymptote program
settings.tex="pdflatex";settings.outformat="pdf";settings.render=0;settings.prc=false;settings.v3d=false;defaultpen(fontsize(10pt));penBlue=rgb(0,84/255.0,159/255.0),Teal=rgb(0,177/255.0,183/255.0);penOrange=rgb(246/255.0,168/255.0,0),Green=rgb(87/255.0,171/255.0,39/255.0);penGrey=gray(.4),Light=gray(.92),Wash=rgb(232/255.0,241/255.0,250/255.0);stringfigureID="ASY-04-001";size(320,220,IgnoreAspect);fill(box((0,0),(320,220)),white);// BEGIN DRAWINGreal[]radius={12,18,25,32,22};for(inti=0;i<radius.length;++i){paircentre=(45+57*i,105);filldraw(circle(centre,radius[i]),Wash,Blue);label(format("$r=%.0f$",radius[i]),centre+(0,-48));}// END DRAWINGlabel("ASY-04-001",(310,210),SW,fontsize(8pt));shipout(figureID);
Compilation completed successfully. No compiler messages were emitted.
Command or parameter
Meaning
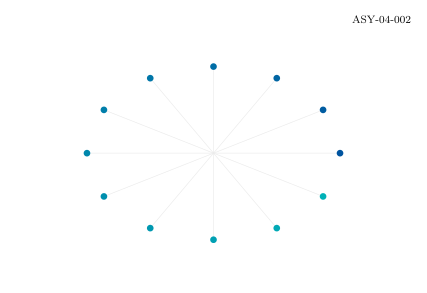
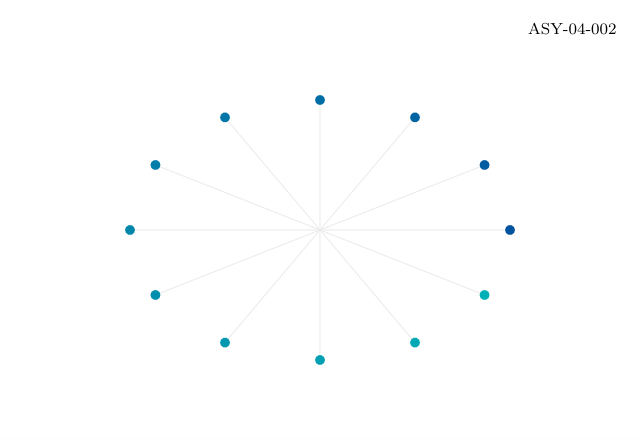
pair place(real t)
Return a coordinate from a real parameter.
sin / cos
Trigonometric function arguments are radians.
Complete standalone Asymptote program
settings.tex="pdflatex";settings.outformat="pdf";settings.render=0;settings.prc=false;settings.v3d=false;defaultpen(fontsize(10pt));penBlue=rgb(0,84/255.0,159/255.0),Teal=rgb(0,177/255.0,183/255.0);penOrange=rgb(246/255.0,168/255.0,0),Green=rgb(87/255.0,171/255.0,39/255.0);penGrey=gray(.4),Light=gray(.92),Wash=rgb(232/255.0,241/255.0,250/255.0);stringfigureID="ASY-04-002";size(320,220,IgnoreAspect);fill(box((0,0),(320,220)),white);// BEGIN DRAWINGpairplace(realt){return(160,105)+(95*cos(t),65*sin(t));}for(inti=0;i<12;++i){pairq=place(2*pi*i/12);draw((160,105)--q,Light);dot(q,interp(Blue,Teal,i/11.0)+5);}// END DRAWINGlabel("ASY-04-002",(310,210),SW,fontsize(8pt));shipout(figureID);
Compilation completed successfully. No compiler messages were emitted.
Command or parameter
Meaning
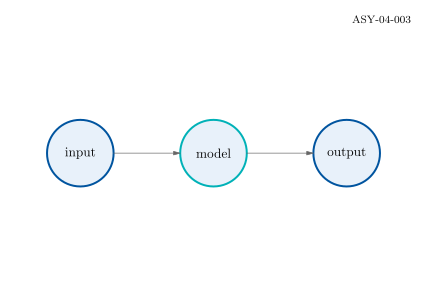
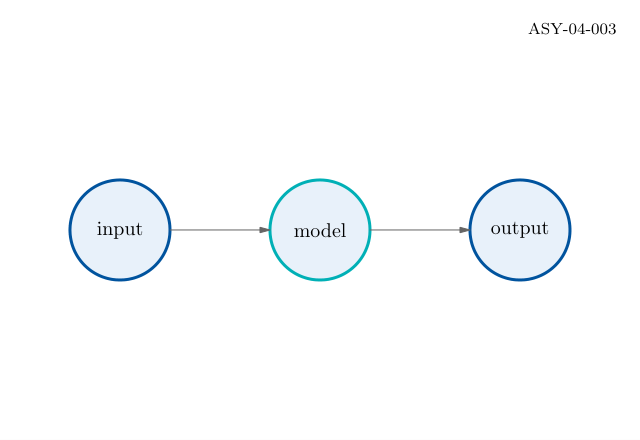
void function
Perform drawing operations without returning a value.
Typed parameters
Make text, position and colour explicit inputs.
Complete standalone Asymptote program
settings.tex="pdflatex";settings.outformat="pdf";settings.render=0;settings.prc=false;settings.v3d=false;defaultpen(fontsize(10pt));penBlue=rgb(0,84/255.0,159/255.0),Teal=rgb(0,177/255.0,183/255.0);penOrange=rgb(246/255.0,168/255.0,0),Green=rgb(87/255.0,171/255.0,39/255.0);penGrey=gray(.4),Light=gray(.92),Wash=rgb(232/255.0,241/255.0,250/255.0);stringfigureID="ASY-04-003";size(320,220,IgnoreAspect);fill(box((0,0),(320,220)),white);// BEGIN DRAWINGvoidnode(stringname,pairp,pencolour){filldraw(circle(p,25),Wash,colour+1.5);label(name,p);}node("input",(60,105),Blue);node("model",(160,105),Teal);node("output",(260,105),Blue);draw((85,105)--(135,105),Grey,Arrow(5));draw((185,105)--(235,105),Grey,Arrow(5));// END DRAWINGlabel("ASY-04-003",(310,210),SW,fontsize(8pt));shipout(figureID);
Compilation completed successfully. No compiler messages were emitted.
Command or parameter
Meaning
struct
Group related fields under one type.
new Observation
Allocate a value before assigning its fields.
Complete standalone Asymptote program
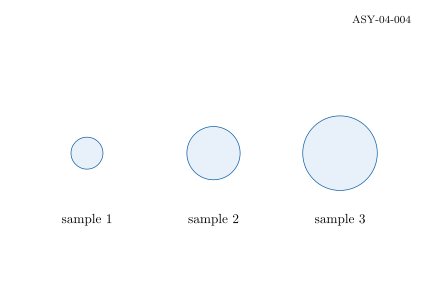
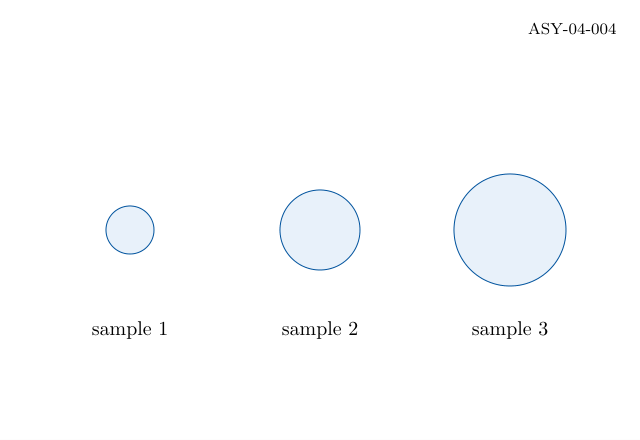
settings.tex="pdflatex";settings.outformat="pdf";settings.render=0;settings.prc=false;settings.v3d=false;defaultpen(fontsize(10pt));penBlue=rgb(0,84/255.0,159/255.0),Teal=rgb(0,177/255.0,183/255.0);penOrange=rgb(246/255.0,168/255.0,0),Green=rgb(87/255.0,171/255.0,39/255.0);penGrey=gray(.4),Light=gray(.92),Wash=rgb(232/255.0,241/255.0,250/255.0);stringfigureID="ASY-04-004";size(320,220,IgnoreAspect);fill(box((0,0),(320,220)),white);// BEGIN DRAWINGstructObservation{stringname;pairp;realvalue;}Observation[]samples=newObservation[3];for(inti=0;i<3;++i){samples[i]=newObservation;samples[i].name="sample "+(string)(i+1);samples[i].p=(65+95*i,105);samples[i].value=12+8*i;filldraw(circle(samples[i].p,samples[i].value),Wash,Blue);label(samples[i].name,samples[i].p+(0,-50));}// END DRAWINGlabel("ASY-04-004",(310,210),SW,fontsize(8pt));shipout(figureID);
Compilation completed successfully. No compiler messages were emitted.
Command or parameter
Meaning
condition ? a : b
Select one pen from a Boolean condition.
min / max
Order rectangle corners for either sign.
Complete standalone Asymptote program
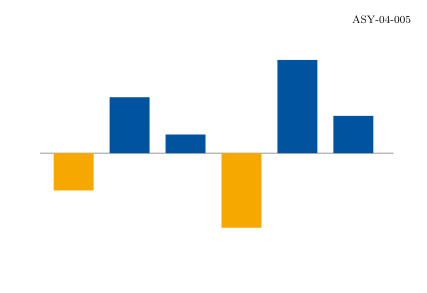
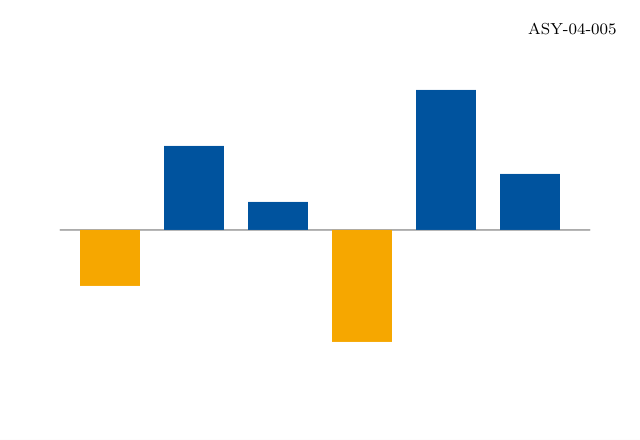
settings.tex="pdflatex";settings.outformat="pdf";settings.render=0;settings.prc=false;settings.v3d=false;defaultpen(fontsize(10pt));penBlue=rgb(0,84/255.0,159/255.0),Teal=rgb(0,177/255.0,183/255.0);penOrange=rgb(246/255.0,168/255.0,0),Green=rgb(87/255.0,171/255.0,39/255.0);penGrey=gray(.4),Light=gray(.92),Wash=rgb(232/255.0,241/255.0,250/255.0);stringfigureID="ASY-04-005";size(320,220,IgnoreAspect);fill(box((0,0),(320,220)),white);// BEGIN DRAWINGreal[]value={-2,3,1,-4,5,2};draw((30,105)--(295,105),Grey);for(inti=0;i<value.length;++i){paira=(40+42*i,105),b=a+(30,14*value[i]);fill(box((a.x,min(a.y,b.y)),(b.x,max(a.y,b.y))),value[i]>=0?Blue:Orange);}// END DRAWINGlabel("ASY-04-005",(310,210),SW,fontsize(8pt));shipout(figureID);
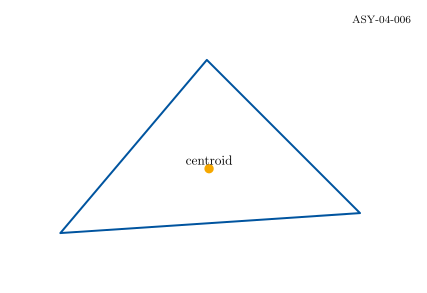
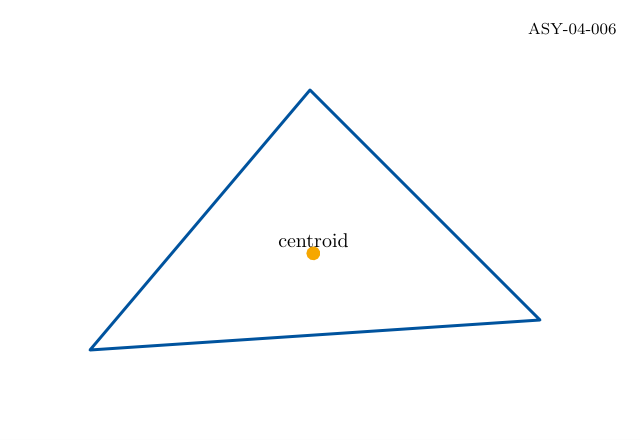
settings.tex="pdflatex";settings.outformat="pdf";settings.render=0;settings.prc=false;settings.v3d=false;defaultpen(fontsize(10pt));penBlue=rgb(0,84/255.0,159/255.0),Teal=rgb(0,177/255.0,183/255.0);penOrange=rgb(246/255.0,168/255.0,0),Green=rgb(87/255.0,171/255.0,39/255.0);penGrey=gray(.4),Light=gray(.92),Wash=rgb(232/255.0,241/255.0,250/255.0);stringfigureID="ASY-04-006";size(320,220,IgnoreAspect);fill(box((0,0),(320,220)),white);// BEGIN DRAWINGpair[]points={(45,45),(270,60),(155,175)};paircentre=(0,0);for(pairp:points)centre+=p/points.length;draw(points[0]--points[1]--points[2]--cycle,Blue+1.5);dot(centre,Orange+7);label("centroid",centre,N);write("check: centroid="+(string)centre);// END DRAWINGlabel("ASY-04-006",(310,210),SW,fontsize(8pt));shipout(figureID);
Compilation completed successfully. No compiler messages were emitted.
Command or parameter
Meaning
graph(f,a,b,n)
Sample n subdivisions over a real interval.
BottomTop / LeftRight
Draw both sides of the plotting frame.
Ticks
Use automatically chosen tick labels.
Complete standalone Asymptote program
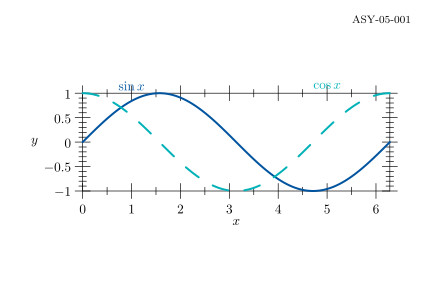
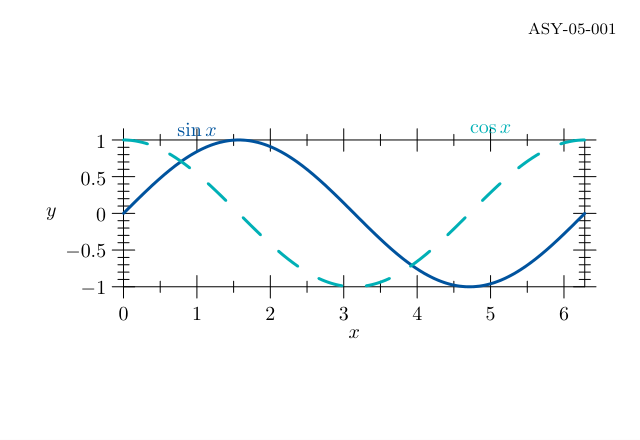
settings.tex="pdflatex";settings.outformat="pdf";settings.render=0;settings.prc=false;settings.v3d=false;defaultpen(fontsize(10pt));penBlue=rgb(0,84/255.0,159/255.0),Teal=rgb(0,177/255.0,183/255.0);penOrange=rgb(246/255.0,168/255.0,0),Green=rgb(87/255.0,171/255.0,39/255.0);penGrey=gray(.4),Light=gray(.92),Wash=rgb(232/255.0,241/255.0,250/255.0);stringfigureID="ASY-05-001";size(270,165);// BEGIN DRAWINGimportgraph;draw(graph(sin,0,2*pi,200),Blue+1.5);draw(graph(cos,0,2*pi,200),Teal+1.5+dashed);xaxis("$x$",BottomTop,Ticks);yaxis("$y$",LeftRight,Ticks);label("$\sin x$",(1,1.15),Blue);label("$\cos x$",(5,1.15),Teal);// END DRAWINGpicturedrawing=currentpicture;currentpicture=newpicture;size(320,220,IgnoreAspect);fill(box((0,0),(320,220)),white);add(drawing.fit(),(160,105),align=0);label("ASY-05-001",(310,210),SW,fontsize(8pt));shipout(figureID);
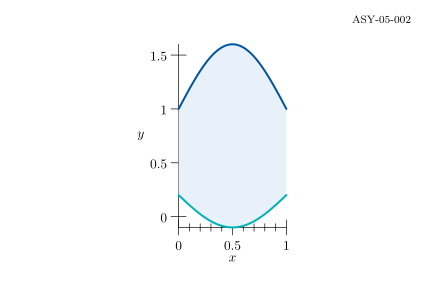
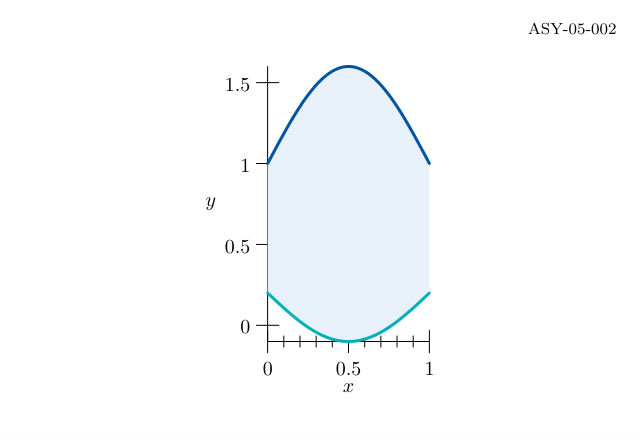
Compilation completed successfully. No compiler messages were emitted.
Command or parameter
Meaning
reverse(b)
Traverse the lower boundary in the opposite direction.
Closed region
Join both ends before filling.
Complete standalone Asymptote program
settings.tex="pdflatex";settings.outformat="pdf";settings.render=0;settings.prc=false;settings.v3d=false;defaultpen(fontsize(10pt));penBlue=rgb(0,84/255.0,159/255.0),Teal=rgb(0,177/255.0,183/255.0);penOrange=rgb(246/255.0,168/255.0,0),Green=rgb(87/255.0,171/255.0,39/255.0);penGrey=gray(.4),Light=gray(.92),Wash=rgb(232/255.0,241/255.0,250/255.0);stringfigureID="ASY-05-002";size(270,165);// BEGIN DRAWINGimportgraph;realf(realx){return1+.6*sin(pi*x);}realg(realx){return.2-.3*sin(pi*x);}patha=graph(f,0,1,100),b=graph(g,0,1,100);fill(a--reverse(b)--cycle,Wash);draw(a,Blue+1.5);draw(b,Teal+1.5);xaxis("$x$",Bottom,Ticks);yaxis("$y$",Left,Ticks);// END DRAWINGpicturedrawing=currentpicture;currentpicture=newpicture;size(320,220,IgnoreAspect);fill(box((0,0),(320,220)),white);add(drawing.fit(),(160,105),align=0);label("ASY-05-002",(310,210),SW,fontsize(8pt));shipout(figureID);
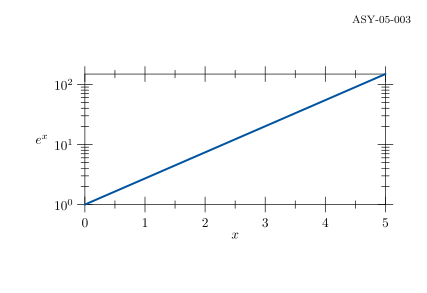
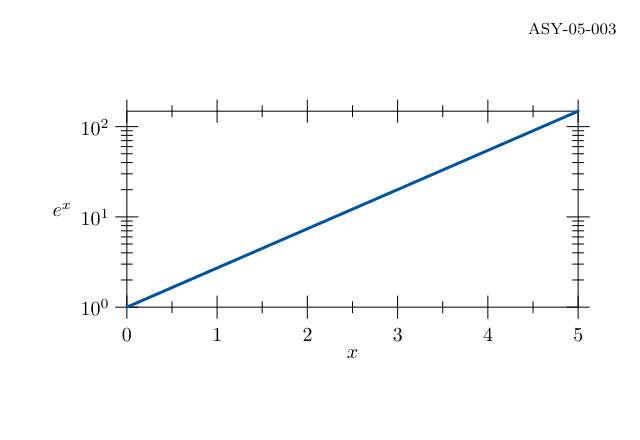
Compilation completed successfully. No compiler messages were emitted.
Command or parameter
Meaning
scale(Linear,Log)
Keep x linear and make y logarithmic.
Positive y
Logarithms require positive data.
Complete standalone Asymptote program
settings.tex="pdflatex";settings.outformat="pdf";settings.render=0;settings.prc=false;settings.v3d=false;defaultpen(fontsize(10pt));penBlue=rgb(0,84/255.0,159/255.0),Teal=rgb(0,177/255.0,183/255.0);penOrange=rgb(246/255.0,168/255.0,0),Green=rgb(87/255.0,171/255.0,39/255.0);penGrey=gray(.4),Light=gray(.92),Wash=rgb(232/255.0,241/255.0,250/255.0);stringfigureID="ASY-05-003";size(270,165);// BEGIN DRAWINGimportgraph;scale(Linear,Log);realf(realx){returnexp(x);}draw(graph(f,0,5,100),Blue+1.5);xaxis("$x$",BottomTop,Ticks);yaxis("$e^x$",LeftRight,Ticks);// END DRAWINGpicturedrawing=currentpicture;currentpicture=newpicture;size(320,220,IgnoreAspect);fill(box((0,0),(320,220)),white);add(drawing.fit(),(160,105),align=0);label("ASY-05-003",(310,210),SW,fontsize(8pt));shipout(figureID);
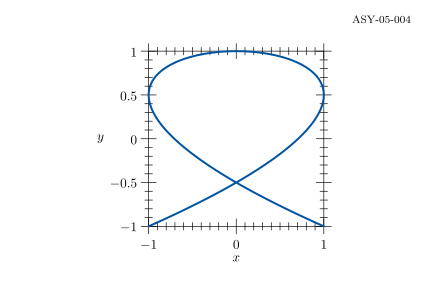
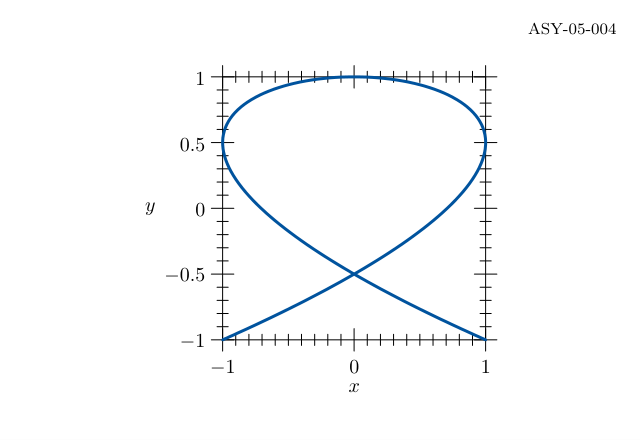
Compilation completed successfully. No compiler messages were emitted.
Command or parameter
Meaning
pair f(t)
Return both x and y coordinates.
0 to 2*pi
Trace a full period for these integer frequencies.
Complete standalone Asymptote program
settings.tex="pdflatex";settings.outformat="pdf";settings.render=0;settings.prc=false;settings.v3d=false;defaultpen(fontsize(10pt));penBlue=rgb(0,84/255.0,159/255.0),Teal=rgb(0,177/255.0,183/255.0);penOrange=rgb(246/255.0,168/255.0,0),Green=rgb(87/255.0,171/255.0,39/255.0);penGrey=gray(.4),Light=gray(.92),Wash=rgb(232/255.0,241/255.0,250/255.0);stringfigureID="ASY-05-004";size(270,165);// BEGIN DRAWINGimportgraph;pairf(realt){return(sin(3*t),cos(2*t));}draw(graph(f,0,2*pi,400),Blue+1.5);xaxis("$x$",BottomTop,Ticks);yaxis("$y$",LeftRight,Ticks);// END DRAWINGpicturedrawing=currentpicture;currentpicture=newpicture;size(320,220,IgnoreAspect);fill(box((0,0),(320,220)),white);add(drawing.fit(),(160,105),align=0);label("ASY-05-004",(310,210),SW,fontsize(8pt));shipout(figureID);
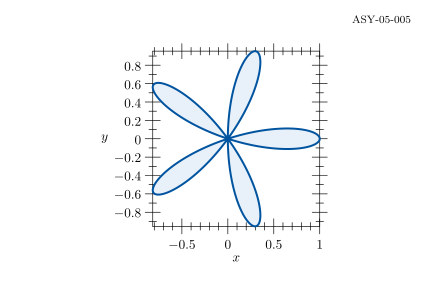
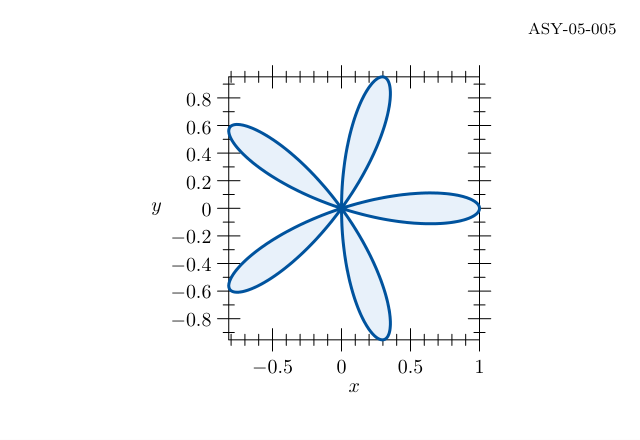
Compilation completed successfully. No compiler messages were emitted.
Command or parameter
Meaning
polargraph
Convert a radial function into a path.
Odd frequency
A pi-length interval traces the five petals once.
Complete standalone Asymptote program
settings.tex="pdflatex";settings.outformat="pdf";settings.render=0;settings.prc=false;settings.v3d=false;defaultpen(fontsize(10pt));penBlue=rgb(0,84/255.0,159/255.0),Teal=rgb(0,177/255.0,183/255.0);penOrange=rgb(246/255.0,168/255.0,0),Green=rgb(87/255.0,171/255.0,39/255.0);penGrey=gray(.4),Light=gray(.92),Wash=rgb(232/255.0,241/255.0,250/255.0);stringfigureID="ASY-05-005";size(270,165);// BEGIN DRAWINGimportgraph;realr(realt){returncos(5*t);}pathp=polargraph(r,0,pi,500);filldraw(p--cycle,Wash,Blue+1.5);xaxis("$x$",BottomTop,Ticks);yaxis("$y$",LeftRight,Ticks);// END DRAWINGpicturedrawing=currentpicture;currentpicture=newpicture;size(320,220,IgnoreAspect);fill(box((0,0),(320,220)),white);add(drawing.fit(),(160,105),align=0);label("ASY-05-005",(310,210),SW,fontsize(8pt));shipout(figureID);
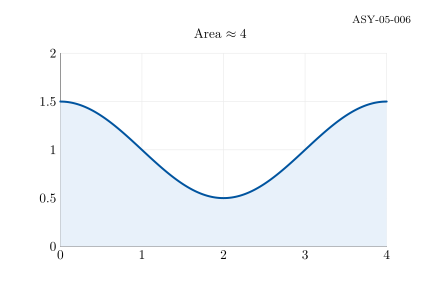
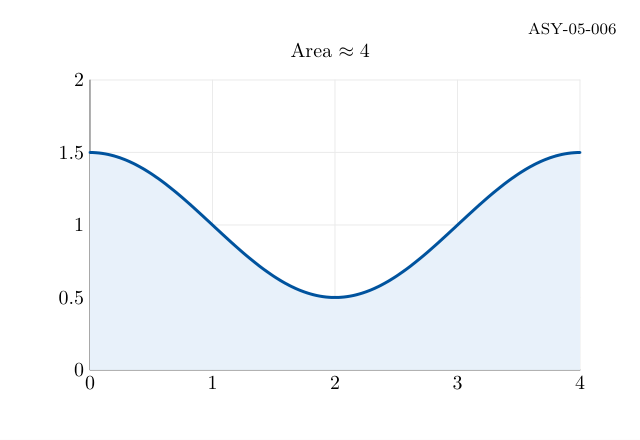
Average adjacent sample heights and multiply by step width.
n=200
Set the number of integration intervals.
Complete standalone Asymptote program
settings.tex="pdflatex";settings.outformat="pdf";settings.render=0;settings.prc=false;settings.v3d=false;defaultpen(fontsize(10pt));penBlue=rgb(0,84/255.0,159/255.0),Teal=rgb(0,177/255.0,183/255.0);penOrange=rgb(246/255.0,168/255.0,0),Green=rgb(87/255.0,171/255.0,39/255.0);penGrey=gray(.4),Light=gray(.92),Wash=rgb(232/255.0,241/255.0,250/255.0);stringfigureID="ASY-05-006";size(320,220,IgnoreAspect);fill(box((0,0),(320,220)),white);// BEGIN DRAWINGrealxmin=0,xmax=4,ymin=0,ymax=2;pairP(realx,realy){return(45+245*(x-xmin)/(xmax-xmin),35+145*(y-ymin)/(ymax-ymin));}for(inti=0;i<=4;++i){realx=xmin+i*(xmax-xmin)/4,y=ymin+i*(ymax-ymin)/4;draw(P(x,ymin)--P(x,ymax),Light);draw(P(xmin,y)--P(xmax,y),Light);label(format("$%.3g$",x),P(x,ymin),S);label(format("$%.3g$",y),P(xmin,y),W);}draw(P(xmin,ymax)--P(xmin,ymin)--P(xmax,ymin),Grey);importgraph;realf(realx){return1+.5*cos(pi*x/2);}pairq(realx){returnP(x,f(x));}pathp=graph(q,0,4,160);fill(p--P(4,0)--P(0,0)--cycle,Wash);draw(p,Blue+1.5);intn=200;realh=4.0/n,area=0;for(inti=0;i<n;++i)area+=h*(f(i*h)+f((i+1)*h))/2;label(format("Area $\approx %.3f$",area),(165,195));write("check: area="+(string)area);// END DRAWINGlabel("ASY-05-006",(310,210),SW,fontsize(8pt));shipout(figureID);
Compilation completed successfully. No compiler messages were emitted.
Command or parameter
Meaning
P(x,y)
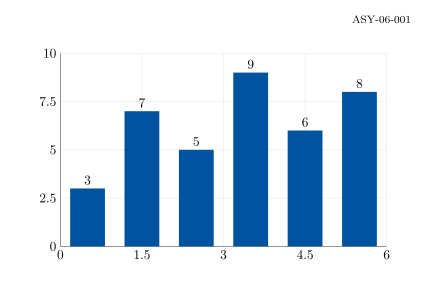
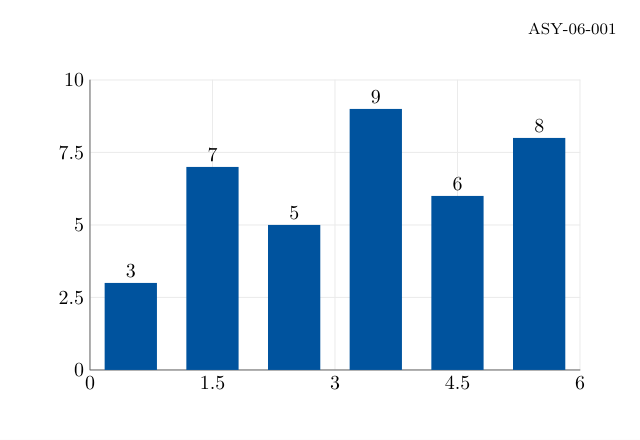
Use the same scale for bars and numeric grid.
Zero baseline
Let height encode the actual value.
Complete standalone Asymptote program
settings.tex="pdflatex";settings.outformat="pdf";settings.render=0;settings.prc=false;settings.v3d=false;defaultpen(fontsize(10pt));penBlue=rgb(0,84/255.0,159/255.0),Teal=rgb(0,177/255.0,183/255.0);penOrange=rgb(246/255.0,168/255.0,0),Green=rgb(87/255.0,171/255.0,39/255.0);penGrey=gray(.4),Light=gray(.92),Wash=rgb(232/255.0,241/255.0,250/255.0);stringfigureID="ASY-06-001";size(320,220,IgnoreAspect);fill(box((0,0),(320,220)),white);// BEGIN DRAWINGrealxmin=0,xmax=6,ymin=0,ymax=10;pairP(realx,realy){return(45+245*(x-xmin)/(xmax-xmin),35+145*(y-ymin)/(ymax-ymin));}for(inti=0;i<=4;++i){realx=xmin+i*(xmax-xmin)/4,y=ymin+i*(ymax-ymin)/4;draw(P(x,ymin)--P(x,ymax),Light);draw(P(xmin,y)--P(xmax,y),Light);label(format("$%.3g$",x),P(x,ymin),S);label(format("$%.3g$",y),P(xmin,y),W);}draw(P(xmin,ymax)--P(xmin,ymin)--P(xmax,ymin),Grey);real[]v={3,7,5,9,6,8};for(inti=0;i<v.length;++i){fill(box(P(i+.18,0),P(i+.82,v[i])),Blue);label((string)v[i],P(i+.5,v[i]),N);}// END DRAWINGlabel("ASY-06-001",(310,210),SW,fontsize(8pt));shipout(figureID);
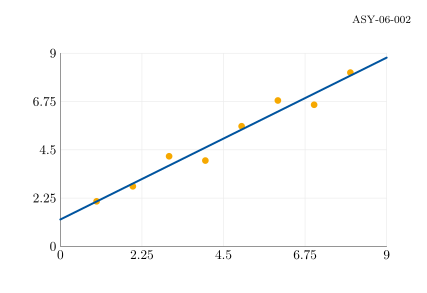
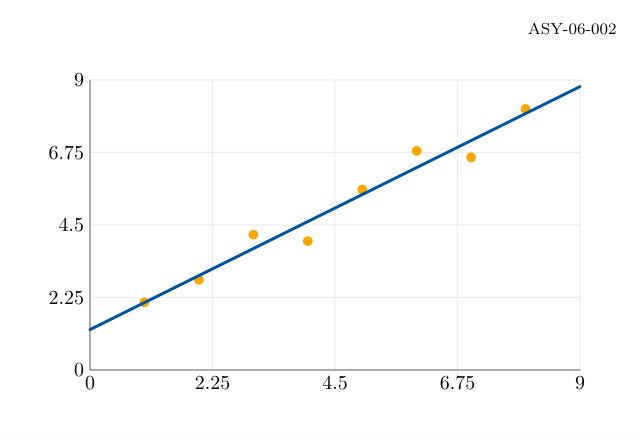
Calculate coefficients from sums over all observations.
Common axes
Use identical coordinates for sample points and fitted line.
Complete standalone Asymptote program
settings.tex="pdflatex";settings.outformat="pdf";settings.render=0;settings.prc=false;settings.v3d=false;defaultpen(fontsize(10pt));penBlue=rgb(0,84/255.0,159/255.0),Teal=rgb(0,177/255.0,183/255.0);penOrange=rgb(246/255.0,168/255.0,0),Green=rgb(87/255.0,171/255.0,39/255.0);penGrey=gray(.4),Light=gray(.92),Wash=rgb(232/255.0,241/255.0,250/255.0);stringfigureID="ASY-06-002";size(320,220,IgnoreAspect);fill(box((0,0),(320,220)),white);// BEGIN DRAWINGrealxmin=0,xmax=9,ymin=0,ymax=9;pairP(realx,realy){return(45+245*(x-xmin)/(xmax-xmin),35+145*(y-ymin)/(ymax-ymin));}for(inti=0;i<=4;++i){realx=xmin+i*(xmax-xmin)/4,y=ymin+i*(ymax-ymin)/4;draw(P(x,ymin)--P(x,ymax),Light);draw(P(xmin,y)--P(xmax,y),Light);label(format("$%.3g$",x),P(x,ymin),S);label(format("$%.3g$",y),P(xmin,y),W);}draw(P(xmin,ymax)--P(xmin,ymin)--P(xmax,ymin),Grey);real[]x={1,2,3,4,5,6,7,8};real[]y={2.1,2.8,4.2,4,5.6,6.8,6.6,8.1};realsx=0,sy=0,sxx=0,sxy=0;intn=x.length;for(inti=0;i<n;++i){sx+=x[i];sy+=y[i];sxx+=x[i]^2;sxy+=x[i]*y[i];dot(P(x[i],y[i]),Orange+5);}realslope=(n*sxy-sx*sy)/(n*sxx-sx^2);realintercept=(sy-slope*sx)/n;draw(P(0,intercept)--P(9,intercept+9*slope),Blue+1.5);write("check: slope="+(string)slope);// END DRAWINGlabel("ASY-06-002",(310,210),SW,fontsize(8pt));shipout(figureID);
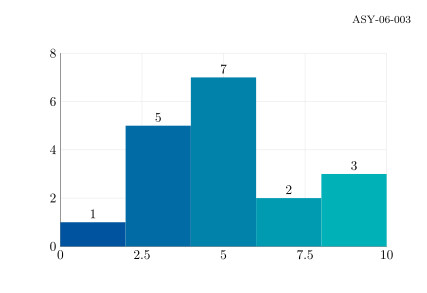
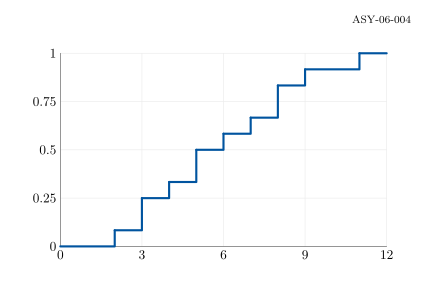
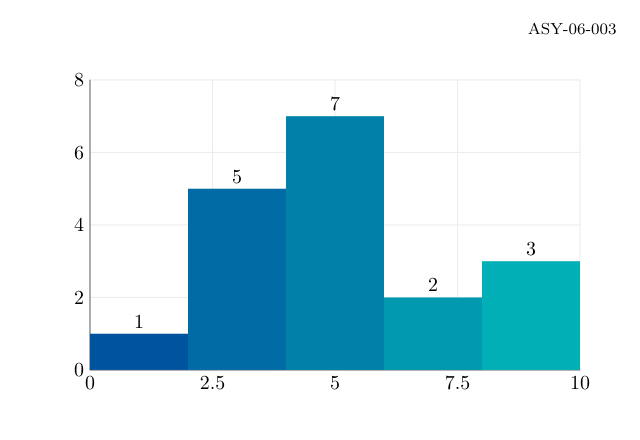
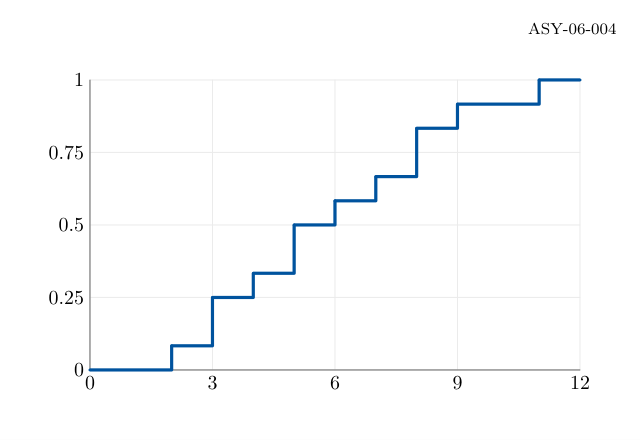
Counts are computed from the observations rather than supplied as bar heights. The bins are left-closed and right-open, with the final endpoint included.
Use bar height as count for these equal-width bins.
Complete standalone Asymptote program
settings.tex="pdflatex";settings.outformat="pdf";settings.render=0;settings.prc=false;settings.v3d=false;defaultpen(fontsize(10pt));penBlue=rgb(0,84/255.0,159/255.0),Teal=rgb(0,177/255.0,183/255.0);penOrange=rgb(246/255.0,168/255.0,0),Green=rgb(87/255.0,171/255.0,39/255.0);penGrey=gray(.4),Light=gray(.92),Wash=rgb(232/255.0,241/255.0,250/255.0);stringfigureID="ASY-06-003";size(320,220,IgnoreAspect);fill(box((0,0),(320,220)),white);// BEGIN DRAWINGrealxmin=0,xmax=10,ymin=0,ymax=8;pairP(realx,realy){return(45+245*(x-xmin)/(xmax-xmin),35+145*(y-ymin)/(ymax-ymin));}for(inti=0;i<=4;++i){realx=xmin+i*(xmax-xmin)/4,y=ymin+i*(ymax-ymin)/4;draw(P(x,ymin)--P(x,ymax),Light);draw(P(xmin,y)--P(xmax,y),Light);label(format("$%.3g$",x),P(x,ymin),S);label(format("$%.3g$",y),P(xmin,y),W);}draw(P(xmin,ymax)--P(xmin,ymin)--P(xmax,ymin),Grey);real[]v={.8,2.1,2.4,2.8,3.1,3.7,4.1,4.3,4.7,5,5.2,5.5,5.9,6.2,7.4,8.1,8.7,9.2};int[]count=newint[5];for(inti=0;i<5;++i)count[i]=0;for(realvalue:v)++count[min(4,(int)floor(value/2))];inttotal=0;for(inti=0;i<5;++i){total+=count[i];fill(box(P(2*i,0),P(2*i+2,count[i])),interp(Blue,Teal,i/4.0));label((string)count[i],P(2*i+1,count[i]),N);}write("check: histogram-total="+(string)total);// END DRAWINGlabel("ASY-06-003",(310,210),SW,fontsize(8pt));shipout(figureID);
The value at each observation includes that observation.
Complete standalone Asymptote program
settings.tex="pdflatex";settings.outformat="pdf";settings.render=0;settings.prc=false;settings.v3d=false;defaultpen(fontsize(10pt));penBlue=rgb(0,84/255.0,159/255.0),Teal=rgb(0,177/255.0,183/255.0);penOrange=rgb(246/255.0,168/255.0,0),Green=rgb(87/255.0,171/255.0,39/255.0);penGrey=gray(.4),Light=gray(.92),Wash=rgb(232/255.0,241/255.0,250/255.0);stringfigureID="ASY-06-004";size(320,220,IgnoreAspect);fill(box((0,0),(320,220)),white);// BEGIN DRAWINGrealxmin=0,xmax=12,ymin=0,ymax=1;pairP(realx,realy){return(45+245*(x-xmin)/(xmax-xmin),35+145*(y-ymin)/(ymax-ymin));}for(inti=0;i<=4;++i){realx=xmin+i*(xmax-xmin)/4,y=ymin+i*(ymax-ymin)/4;draw(P(x,ymin)--P(x,ymax),Light);draw(P(xmin,y)--P(xmax,y),Light);label(format("$%.3g$",x),P(x,ymin),S);label(format("$%.3g$",y),P(xmin,y),W);}draw(P(xmin,ymax)--P(xmin,ymin)--P(xmax,ymin),Grey);real[]v=sort(newreal[]{2,3,3,4,5,5,6,7,8,8,9,11});intn=v.length,i=0;pairlast=P(0,0);while(i<n){intj=i+1;while(j<n&&v[j]==v[i])++j;pairbefore=P(v[i],i/(real)n),after=P(v[i],j/(real)n);draw(last--before--after,Blue+1.6);last=after;i=j;}draw(last--P(12,1),Blue+1.6);write("check: ecdf-final="+(string)(i/(real)n));// END DRAWINGlabel("ASY-06-004",(310,210),SW,fontsize(8pt));shipout(figureID);
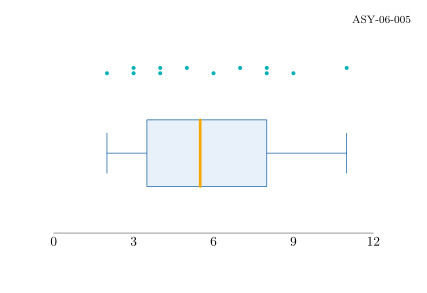
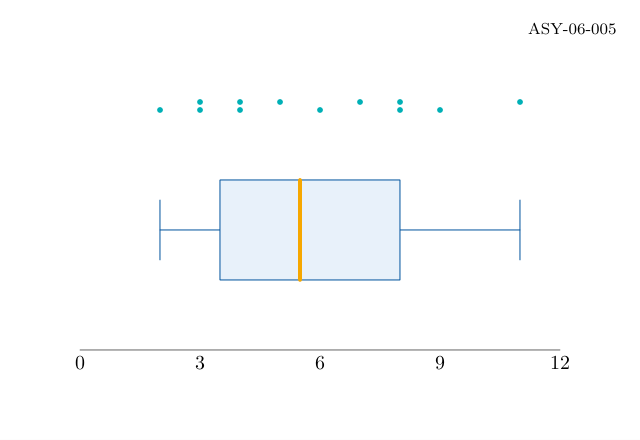
settings.tex="pdflatex";settings.outformat="pdf";settings.render=0;settings.prc=false;settings.v3d=false;defaultpen(fontsize(10pt));penBlue=rgb(0,84/255.0,159/255.0),Teal=rgb(0,177/255.0,183/255.0);penOrange=rgb(246/255.0,168/255.0,0),Green=rgb(87/255.0,171/255.0,39/255.0);penGrey=gray(.4),Light=gray(.92),Wash=rgb(232/255.0,241/255.0,250/255.0);stringfigureID="ASY-06-005";size(320,220,IgnoreAspect);fill(box((0,0),(320,220)),white);// BEGIN DRAWINGreal[]v=sort(newreal[]{2,3,3,4,4,5,6,7,8,8,9,11});realq1=(v[2]+v[3])/2,median=(v[5]+v[6])/2,q3=(v[8]+v[9])/2;realX(realx){return40+20*x;}draw((X(v[0]),105)--(X(v[11]),105),Blue);filldraw(box((X(q1),80),(X(q3),130)),Wash,Blue);draw((X(median),80)--(X(median),130),Orange+2);for(inti:newint[]{0,11})draw((X(v[i]),90)--(X(v[i]),120),Blue);for(inti=0;i<v.length;++i)dot((X(v[i]),165+4*(i%2)),Teal+3);draw((40,45)--(280,45),Grey);for(intx=0;x<=12;x+=3)label((string)x,(X(x),45),S);write("check: quartiles="+(string)q1+","+(string)median+","+(string)q3);// END DRAWINGlabel("ASY-06-005",(310,210),SW,fontsize(8pt));shipout(figureID);
Compilation completed successfully. No compiler messages were emitted.
Command or parameter
Meaning
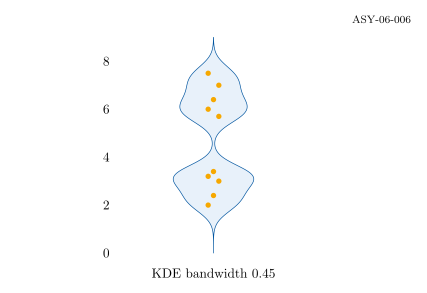
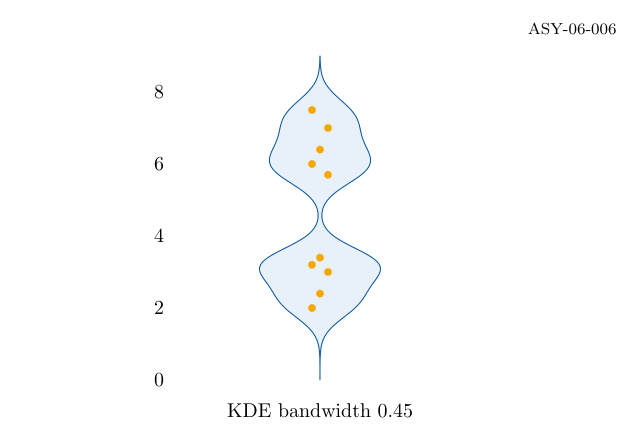
h=.45
Use one bandwidth in the data units.
Gaussian kernel
Sum normal-shaped contributions at observed values.
Mirrored density
Trace one side up and the other down.
Complete standalone Asymptote program
settings.tex="pdflatex";settings.outformat="pdf";settings.render=0;settings.prc=false;settings.v3d=false;defaultpen(fontsize(10pt));penBlue=rgb(0,84/255.0,159/255.0),Teal=rgb(0,177/255.0,183/255.0);penOrange=rgb(246/255.0,168/255.0,0),Green=rgb(87/255.0,171/255.0,39/255.0);penGrey=gray(.4),Light=gray(.92),Wash=rgb(232/255.0,241/255.0,250/255.0);stringfigureID="ASY-06-006";size(320,220,IgnoreAspect);fill(box((0,0),(320,220)),white);// BEGIN DRAWINGimportgraph;real[]v={2,2.4,3,3.2,3.4,5.7,6,6.4,7,7.5};realh=.45;realdensity(realy){reals=0;for(realvalue:v)s+=exp(-.5*((y-value)/h)^2);returns/(v.length*h*sqrt(2*pi));}pairleft(realy){return(160-110*density(y),30+18*y);}pairright(realy){return(160+110*density(y),30+18*y);}patha=graph(left,0,9,200),b=graph(right,0,9,200);filldraw(a--reverse(b)--cycle,Wash,Blue);for(inti=0;i<v.length;++i)dot((160+4*((i%3)-1),30+18*v[i]),Orange+4);for(inty=0;y<=8;y+=2)label((string)y,(85,30+18*y),W);label("KDE bandwidth 0.45",(160,15));// END DRAWINGlabel("ASY-06-006",(310,210),SW,fontsize(8pt));shipout(figureID);
Compilation completed successfully. No compiler messages were emitted.
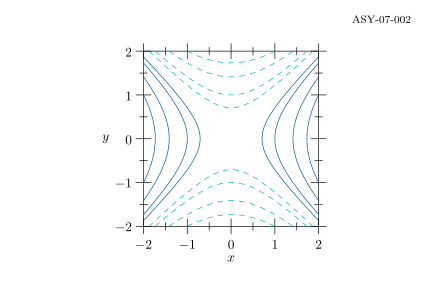
Command or parameter
Meaning
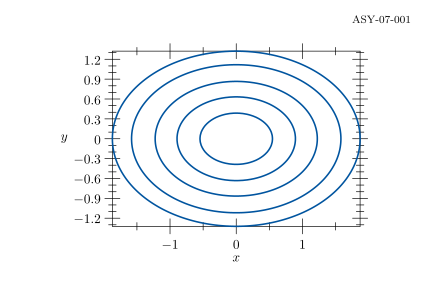
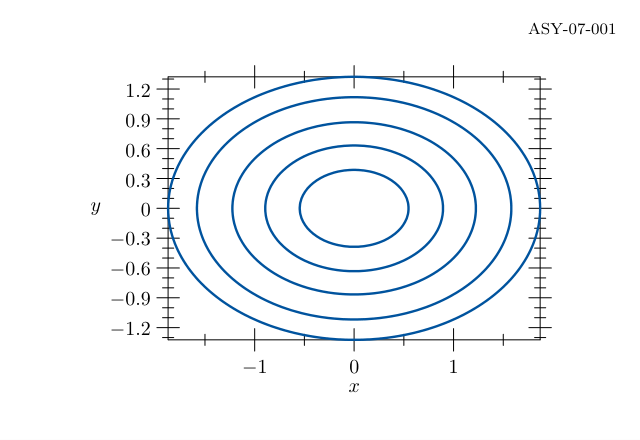
contour(f,a,b,levels,n)
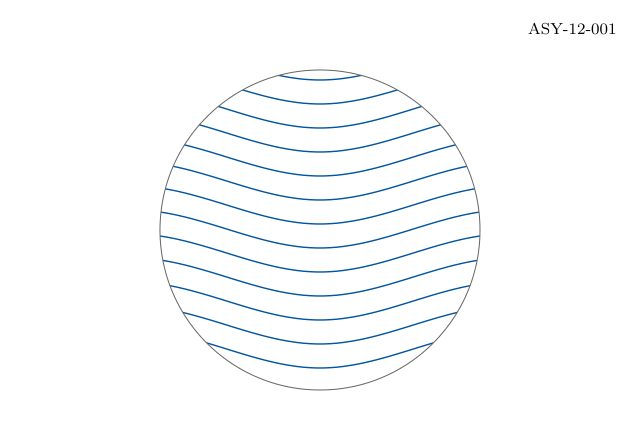
Compute level lines on a sampled rectangular domain.
Levels
Use explicit scalar values, not nested ellipse radii.
Complete standalone Asymptote program
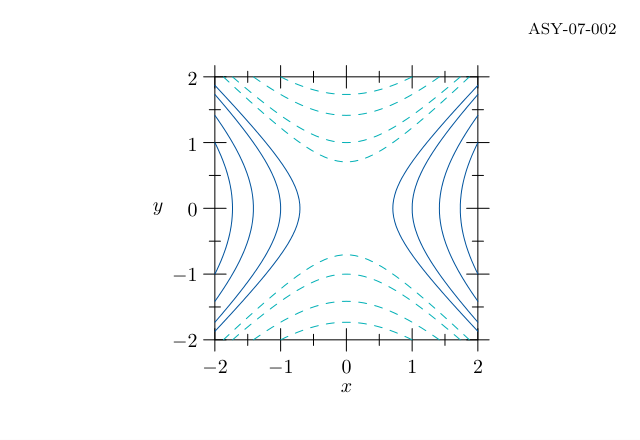
settings.tex="pdflatex";settings.outformat="pdf";settings.render=0;settings.prc=false;settings.v3d=false;defaultpen(fontsize(10pt));penBlue=rgb(0,84/255.0,159/255.0),Teal=rgb(0,177/255.0,183/255.0);penOrange=rgb(246/255.0,168/255.0,0),Green=rgb(87/255.0,171/255.0,39/255.0);penGrey=gray(.4),Light=gray(.92),Wash=rgb(232/255.0,241/255.0,250/255.0);stringfigureID="ASY-07-001";size(270,165);// BEGIN DRAWINGimportgraph;importcontour;realf(realx,realy){returnx*x+2*y*y;}draw(contour(f,(-2,-1.5),(2,1.5),newreal[]{.3,.8,1.5,2.5,3.5},60),Blue+1.2);xaxis("$x$",BottomTop,Ticks);yaxis("$y$",LeftRight,Ticks);// END DRAWINGpicturedrawing=currentpicture;currentpicture=newpicture;size(320,220,IgnoreAspect);fill(box((0,0),(320,220)),white);add(drawing.fit(),(160,105),align=0);label("ASY-07-001",(310,210),SW,fontsize(8pt));shipout(figureID);
Compilation completed successfully. No compiler messages were emitted.
Command or parameter
Meaning
Two level arrays
Group contours by sign.
dashed
Provide a second visual channel for negative values.
Complete standalone Asymptote program
settings.tex="pdflatex";settings.outformat="pdf";settings.render=0;settings.prc=false;settings.v3d=false;defaultpen(fontsize(10pt));penBlue=rgb(0,84/255.0,159/255.0),Teal=rgb(0,177/255.0,183/255.0);penOrange=rgb(246/255.0,168/255.0,0),Green=rgb(87/255.0,171/255.0,39/255.0);penGrey=gray(.4),Light=gray(.92),Wash=rgb(232/255.0,241/255.0,250/255.0);stringfigureID="ASY-07-002";size(270,165);// BEGIN DRAWINGimportgraph;importcontour;realf(realx,realy){returnx*x-y*y;}draw(contour(f,(-2,-2),(2,2),newreal[]{.5,1,2,3},60),Blue);draw(contour(f,(-2,-2),(2,2),newreal[]{-.5,-1,-2,-3},60),Teal+dashed);xaxis("$x$",BottomTop,Ticks);yaxis("$y$",LeftRight,Ticks);// END DRAWINGpicturedrawing=currentpicture;currentpicture=newpicture;size(320,220,IgnoreAspect);fill(box((0,0),(320,220)),white);add(drawing.fit(),(160,105),align=0);label("ASY-07-002",(310,210),SW,fontsize(8pt));shipout(figureID);
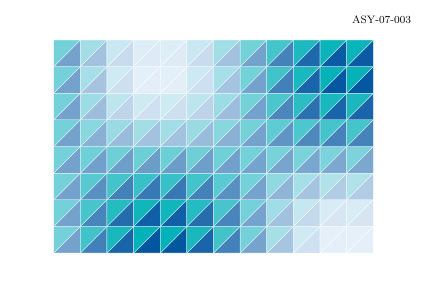
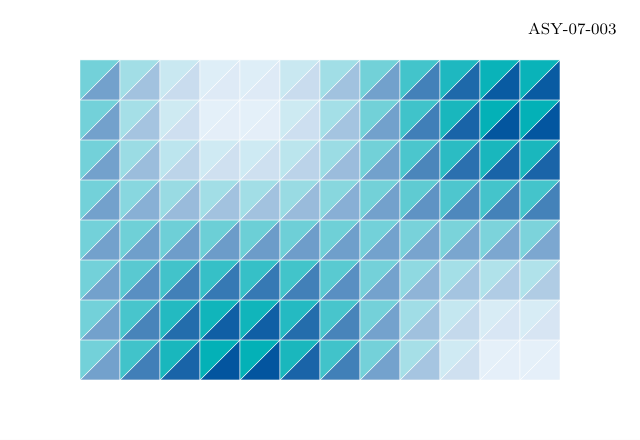
A scalar calculation assigns one colour to each triangular cell. This is a discrete field illustration, with a visible mesh rather than a raster interpolation.
Compilation completed successfully. No compiler messages were emitted.
Command or parameter
Meaning
Cell value
Evaluate the field once per rectangular cell.
Two triangles
Split each rectangle along its diagonal.
Flat colour
Each triangular cell has one fill value.
Complete standalone Asymptote program
settings.tex="pdflatex";settings.outformat="pdf";settings.render=0;settings.prc=false;settings.v3d=false;defaultpen(fontsize(10pt));penBlue=rgb(0,84/255.0,159/255.0),Teal=rgb(0,177/255.0,183/255.0);penOrange=rgb(246/255.0,168/255.0,0),Green=rgb(87/255.0,171/255.0,39/255.0);penGrey=gray(.4),Light=gray(.92),Wash=rgb(232/255.0,241/255.0,250/255.0);stringfigureID="ASY-07-003";size(320,220,IgnoreAspect);fill(box((0,0),(320,220)),white);// BEGIN DRAWINGfor(inti=0;i<12;++i)for(intj=0;j<8;++j){paira=(40+20*i,30+20*j),b=a+(20,0),c=a+(20,20),d=a+(0,20);realt=(1+sin(.45*i)*cos(.5*j))/2;filldraw(a--b--c--cycle,interp(Wash,Blue,t),white+.25);filldraw(a--c--d--cycle,interp(Wash,Teal,t),white+.25);}// END DRAWINGlabel("ASY-07-003",(310,210),SW,fontsize(8pt));shipout(figureID);
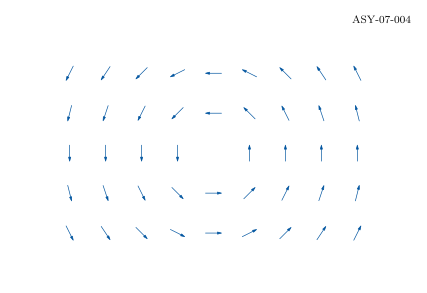
Compilation completed successfully. No compiler messages were emitted.
Command or parameter
Meaning
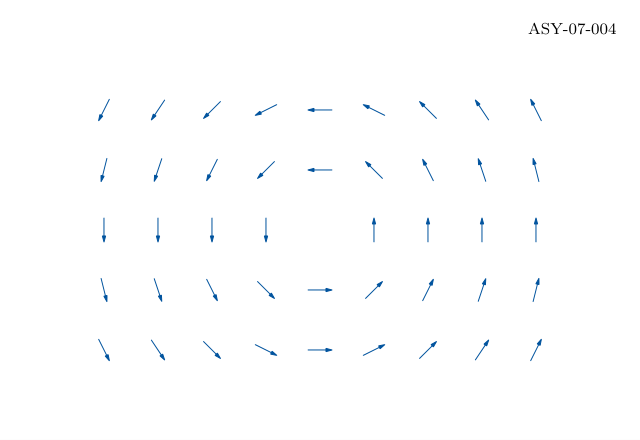
F(x,y)=(-y,x)
A rotational vector field.
unit(v)
Keep direction while normalizing length.
Zero vector
Skip normalization at the origin.
Complete standalone Asymptote program
settings.tex="pdflatex";settings.outformat="pdf";settings.render=0;settings.prc=false;settings.v3d=false;defaultpen(fontsize(10pt));penBlue=rgb(0,84/255.0,159/255.0),Teal=rgb(0,177/255.0,183/255.0);penOrange=rgb(246/255.0,168/255.0,0),Green=rgb(87/255.0,171/255.0,39/255.0);penGrey=gray(.4),Light=gray(.92),Wash=rgb(232/255.0,241/255.0,250/255.0);stringfigureID="ASY-07-004";size(320,220,IgnoreAspect);fill(box((0,0),(320,220)),white);// BEGIN DRAWINGfor(inti=-4;i<=4;++i)for(intj=-2;j<=2;++j){pairv=(-j,i),p=(160+27*i,105+30*j);if(abs(v)>0)draw(p-6*unit(v)--p+6*unit(v),Blue,Arrow(3));}// END DRAWINGlabel("ASY-07-004",(310,210),SW,fontsize(8pt));shipout(figureID);
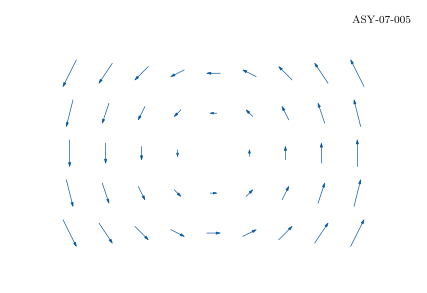
Compilation completed successfully. No compiler messages were emitted.
Command or parameter
Meaning
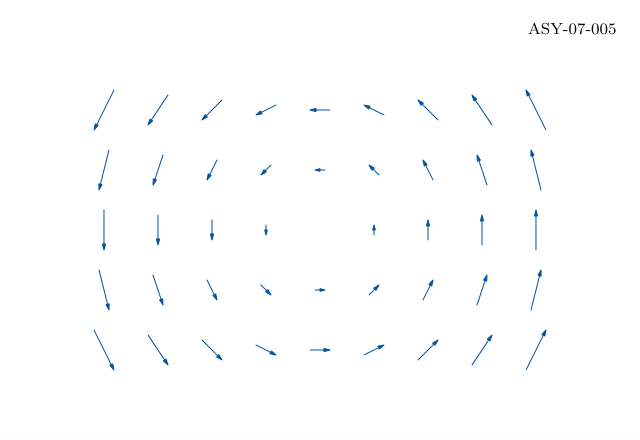
Common scale
Five drawing units represent one field unit.
Centred arrows
Keep the sample location at each arrow midpoint.
Complete standalone Asymptote program
settings.tex="pdflatex";settings.outformat="pdf";settings.render=0;settings.prc=false;settings.v3d=false;defaultpen(fontsize(10pt));penBlue=rgb(0,84/255.0,159/255.0),Teal=rgb(0,177/255.0,183/255.0);penOrange=rgb(246/255.0,168/255.0,0),Green=rgb(87/255.0,171/255.0,39/255.0);penGrey=gray(.4),Light=gray(.92),Wash=rgb(232/255.0,241/255.0,250/255.0);stringfigureID="ASY-07-005";size(320,220,IgnoreAspect);fill(box((0,0),(320,220)),white);// BEGIN DRAWINGfor(inti=-4;i<=4;++i)for(intj=-2;j<=2;++j){pairv=5*(-j,i),p=(160+27*i,105+30*j);if(abs(v)>0)draw(p-.5*v--p+.5*v,Blue,Arrow(3));}// END DRAWINGlabel("ASY-07-005",(310,210),SW,fontsize(8pt));shipout(figureID);
Compilation completed successfully. No compiler messages were emitted.
Command or parameter
Meaning
Euler update
Advance position using the current field value.
Approximation
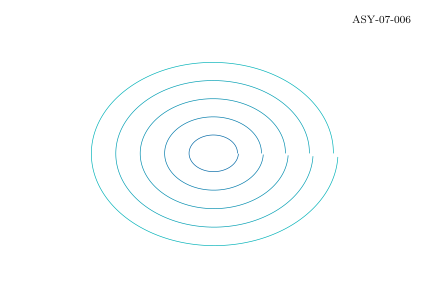
Euler introduces a small outward drift; it is not an exact circle.
h=.012
Set the integration step, independently of stroke width.
Complete standalone Asymptote program
settings.tex="pdflatex";settings.outformat="pdf";settings.render=0;settings.prc=false;settings.v3d=false;defaultpen(fontsize(10pt));penBlue=rgb(0,84/255.0,159/255.0),Teal=rgb(0,177/255.0,183/255.0);penOrange=rgb(246/255.0,168/255.0,0),Green=rgb(87/255.0,171/255.0,39/255.0);penGrey=gray(.4),Light=gray(.92),Wash=rgb(232/255.0,241/255.0,250/255.0);stringfigureID="ASY-07-006";size(320,220,IgnoreAspect);fill(box((0,0),(320,220)),white);// BEGIN DRAWINGfor(intk=1;k<=5;++k){pairq=(.18*k,0);guidetrajectory=q;realh=.012;for(inti=0;i<520;++i){q+=h*(-q.y,q.x);trajectory=trajectory--q;}draw(shift(160,105)*xscale(100)*yscale(75)*trajectory,interp(Blue,Teal,k/5.0));}// END DRAWINGlabel("ASY-07-006",(310,210),SW,fontsize(8pt));shipout(figureID);
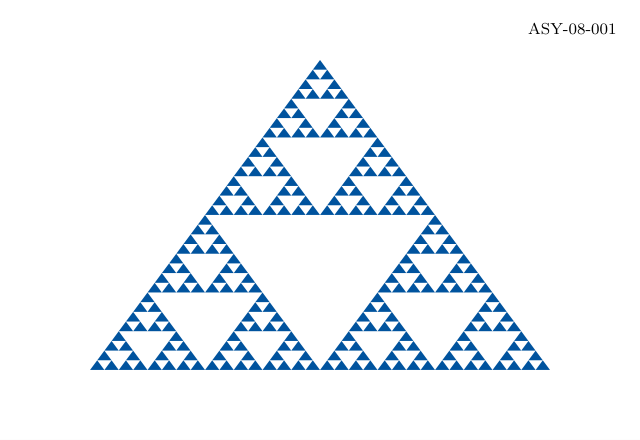
Compilation completed successfully. No compiler messages were emitted.
Command or parameter
Meaning
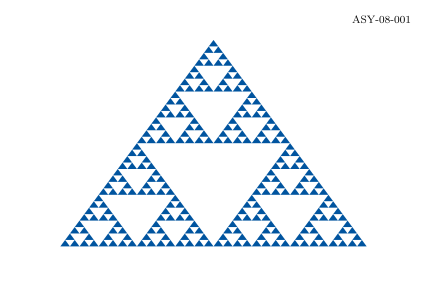
depth==0
Define an explicit termination condition.
Midpoints
Reuse affine interpolation at every level.
Complete standalone Asymptote program
settings.tex="pdflatex";settings.outformat="pdf";settings.render=0;settings.prc=false;settings.v3d=false;defaultpen(fontsize(10pt));penBlue=rgb(0,84/255.0,159/255.0),Teal=rgb(0,177/255.0,183/255.0);penOrange=rgb(246/255.0,168/255.0,0),Green=rgb(87/255.0,171/255.0,39/255.0);penGrey=gray(.4),Light=gray(.92),Wash=rgb(232/255.0,241/255.0,250/255.0);stringfigureID="ASY-08-001";size(320,220,IgnoreAspect);fill(box((0,0),(320,220)),white);// BEGIN DRAWINGvoidsubdivide(paira,pairb,pairc,intdepth){if(depth==0)fill(a--b--c--cycle,Blue);else{subdivide(a,(a+b)/2,(a+c)/2,depth-1);subdivide((a+b)/2,b,(b+c)/2,depth-1);subdivide((a+c)/2,(b+c)/2,c,depth-1);}}subdivide((45,35),(275,35),(160,190),5);// END DRAWINGlabel("ASY-08-001",(310,210),SW,fontsize(8pt));shipout(figureID);
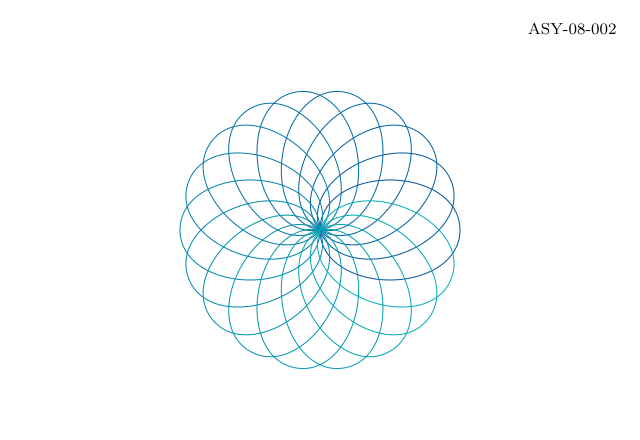
Compilation completed successfully. No compiler messages were emitted.
Command or parameter
Meaning
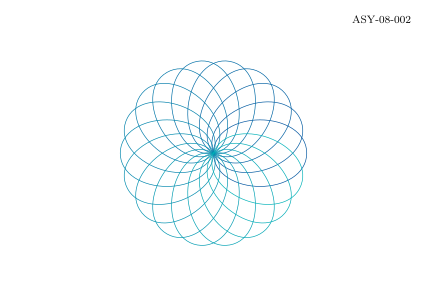
One motif
Define the path once.
rotate(20*k)
Distribute eighteen copies around a full turn.
Complete standalone Asymptote program
settings.tex="pdflatex";settings.outformat="pdf";settings.render=0;settings.prc=false;settings.v3d=false;defaultpen(fontsize(10pt));penBlue=rgb(0,84/255.0,159/255.0),Teal=rgb(0,177/255.0,183/255.0);penOrange=rgb(246/255.0,168/255.0,0),Green=rgb(87/255.0,171/255.0,39/255.0);penGrey=gray(.4),Light=gray(.92),Wash=rgb(232/255.0,241/255.0,250/255.0);stringfigureID="ASY-08-002";size(320,220,IgnoreAspect);fill(box((0,0),(320,220)),white);// BEGIN DRAWINGpathpetal=(0,0)..(35,25)..(70,0)..(35,-25)..cycle;for(intk=0;k<18;++k)draw(shift(160,105)*rotate(20*k)*petal,interp(Blue,Teal,k/17.0));// END DRAWINGlabel("ASY-08-002",(310,210),SW,fontsize(8pt));shipout(figureID);
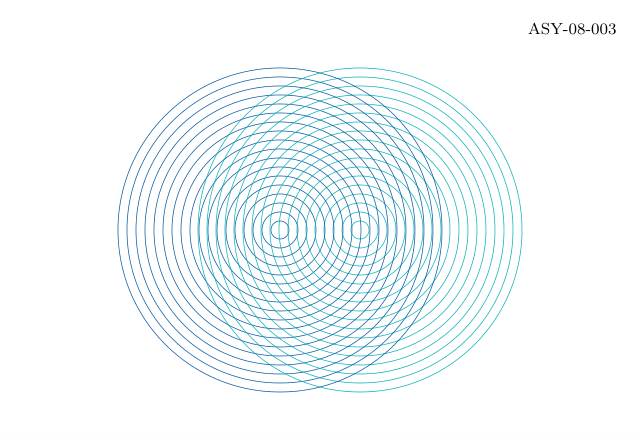
Compilation completed successfully. No compiler messages were emitted.
Command or parameter
Meaning
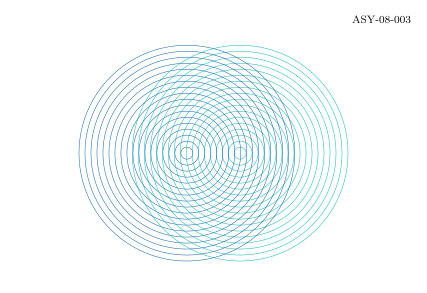
Two centres
Offset identical families by forty units.
Constant spacing
Keep the pattern regular before the families overlap.
Complete standalone Asymptote program
settings.tex="pdflatex";settings.outformat="pdf";settings.render=0;settings.prc=false;settings.v3d=false;defaultpen(fontsize(10pt));penBlue=rgb(0,84/255.0,159/255.0),Teal=rgb(0,177/255.0,183/255.0);penOrange=rgb(246/255.0,168/255.0,0),Green=rgb(87/255.0,171/255.0,39/255.0);penGrey=gray(.4),Light=gray(.92),Wash=rgb(232/255.0,241/255.0,250/255.0);stringfigureID="ASY-08-003";size(320,220,IgnoreAspect);fill(box((0,0),(320,220)),white);// BEGIN DRAWINGfor(intk=1;k<=18;++k){draw(circle((140,105),4.5*k),Blue+.35);draw(circle((180,105),4.5*k),Teal+.35);}// END DRAWINGlabel("ASY-08-003",(310,210),SW,fontsize(8pt));shipout(figureID);
Compilation completed successfully. No compiler messages were emitted.
Command or parameter
Meaning
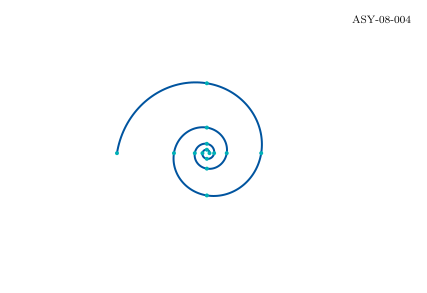
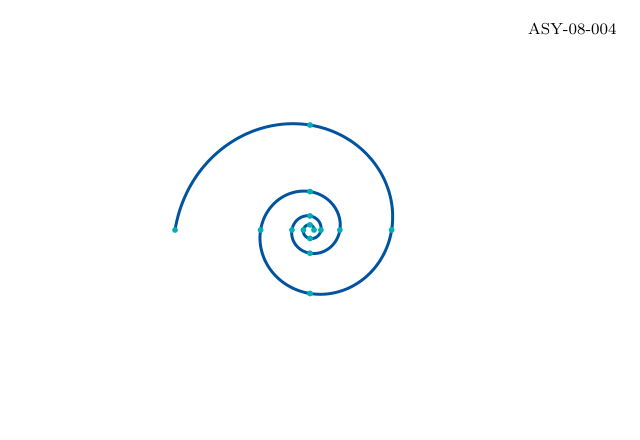
exp(.16*t)
Set the radial growth rate.
degrees(t)
Convert radians to the degree argument of dir.
Complete standalone Asymptote program
settings.tex="pdflatex";settings.outformat="pdf";settings.render=0;settings.prc=false;settings.v3d=false;defaultpen(fontsize(10pt));penBlue=rgb(0,84/255.0,159/255.0),Teal=rgb(0,177/255.0,183/255.0);penOrange=rgb(246/255.0,168/255.0,0),Green=rgb(87/255.0,171/255.0,39/255.0);penGrey=gray(.4),Light=gray(.92),Wash=rgb(232/255.0,241/255.0,250/255.0);stringfigureID="ASY-08-004";size(320,220,IgnoreAspect);fill(box((0,0),(320,220)),white);// BEGIN DRAWINGimportgraph;pairspiral(realt){return(155,105)+2*exp(.16*t)*dir(degrees(t));}draw(graph(spiral,0,7*pi,600),Blue+1.5);for(intk=0;k<=14;++k)dot(spiral(k*pi/2),Teal+3);// END DRAWINGlabel("ASY-08-004",(310,210),SW,fontsize(8pt));shipout(figureID);
Compilation completed successfully. No compiler messages were emitted.
Command or parameter
Meaning
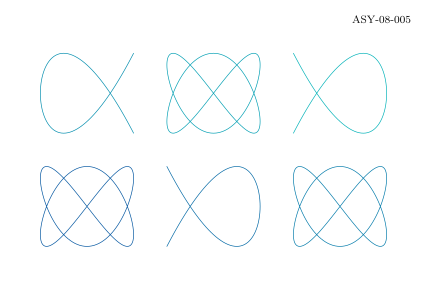
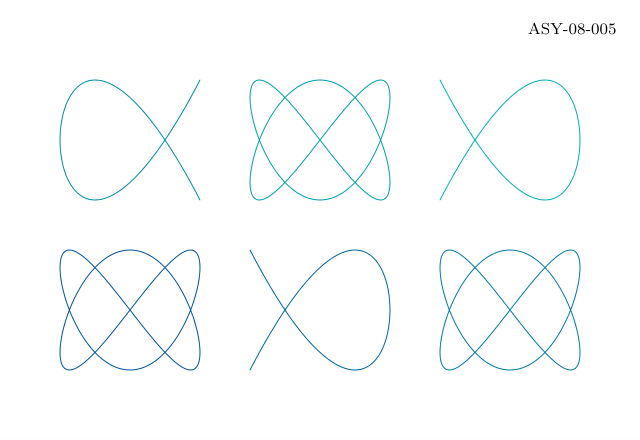
phase
Change only the x-coordinate phase.
Small multiples
Use the same geometry and scale for every panel.
Complete standalone Asymptote program
settings.tex="pdflatex";settings.outformat="pdf";settings.render=0;settings.prc=false;settings.v3d=false;defaultpen(fontsize(10pt));penBlue=rgb(0,84/255.0,159/255.0),Teal=rgb(0,177/255.0,183/255.0);penOrange=rgb(246/255.0,168/255.0,0),Green=rgb(87/255.0,171/255.0,39/255.0);penGrey=gray(.4),Light=gray(.92),Wash=rgb(232/255.0,241/255.0,250/255.0);stringfigureID="ASY-08-005";size(320,220,IgnoreAspect);fill(box((0,0),(320,220)),white);// BEGIN DRAWINGimportgraph;for(intj=0;j<2;++j)for(inti=0;i<3;++i){realphase=(i+3*j)*pi/6;pairf(realt){return(65+95*i,65+85*j)+(35*sin(2*t+phase),30*cos(3*t));}draw(graph(f,0,2*pi,240),interp(Blue,Teal,(i+3*j)/5.0));}// END DRAWINGlabel("ASY-08-005",(310,210),SW,fontsize(8pt));shipout(figureID);
Compilation completed successfully. No compiler messages were emitted.
Command or parameter
Meaning
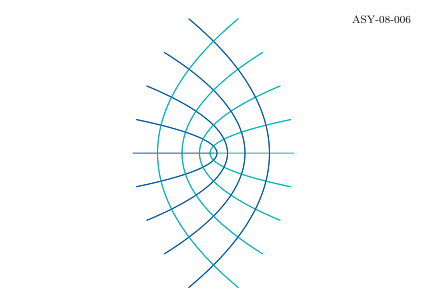
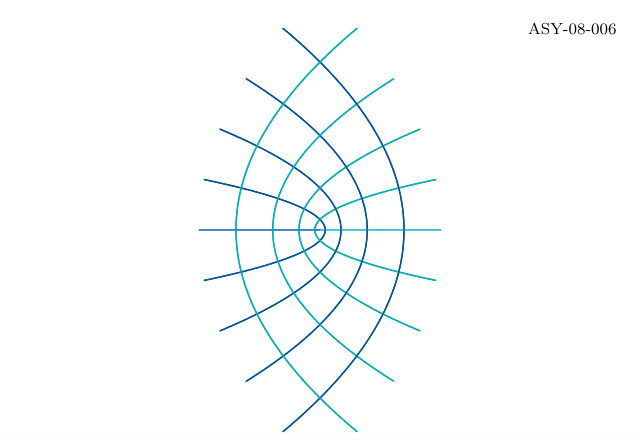
pair squared
Use the pair as a complex number.
Two grid families
Transform both horizontal and vertical coordinate lines.
Complete standalone Asymptote program
settings.tex="pdflatex";settings.outformat="pdf";settings.render=0;settings.prc=false;settings.v3d=false;defaultpen(fontsize(10pt));penBlue=rgb(0,84/255.0,159/255.0),Teal=rgb(0,177/255.0,183/255.0);penOrange=rgb(246/255.0,168/255.0,0),Green=rgb(87/255.0,171/255.0,39/255.0);penGrey=gray(.4),Light=gray(.92),Wash=rgb(232/255.0,241/255.0,250/255.0);stringfigureID="ASY-08-006";size(320,220,IgnoreAspect);fill(box((0,0),(320,220)),white);// BEGIN DRAWINGimportgraph;for(inti=-4;i<=4;++i){reala=i/4.0;pairf(realt){return(160,105)+42*(a,t)^2;}pairg(realt){return(160,105)+42*(t,a)^2;}draw(graph(f,-1.2,1.2,120),Blue+.7);draw(graph(g,-1.2,1.2,120),Teal+.7);}// END DRAWINGlabel("ASY-08-006",(310,210),SW,fontsize(8pt));shipout(figureID);
Compilation completed successfully. No compiler messages were emitted.
Command or parameter
Meaning
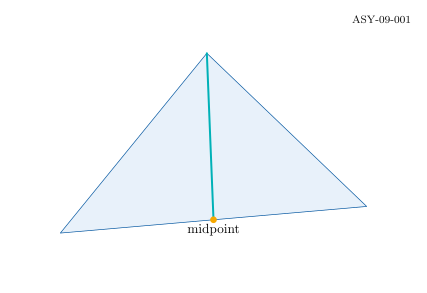
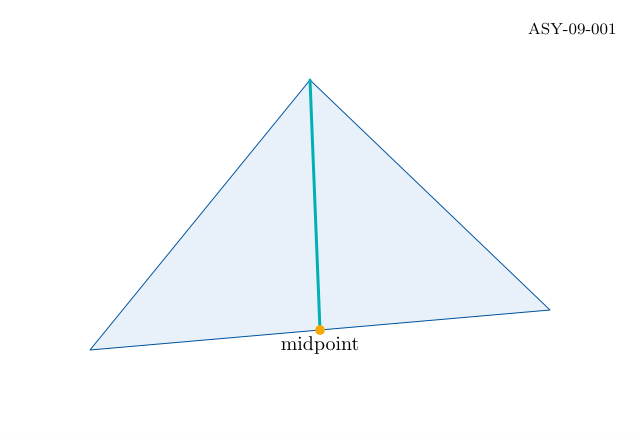
(a+b)/2
Compute the midpoint component by component.
Median
Connect a vertex to the opposite side midpoint.
Complete standalone Asymptote program
settings.tex="pdflatex";settings.outformat="pdf";settings.render=0;settings.prc=false;settings.v3d=false;defaultpen(fontsize(10pt));penBlue=rgb(0,84/255.0,159/255.0),Teal=rgb(0,177/255.0,183/255.0);penOrange=rgb(246/255.0,168/255.0,0),Green=rgb(87/255.0,171/255.0,39/255.0);penGrey=gray(.4),Light=gray(.92),Wash=rgb(232/255.0,241/255.0,250/255.0);stringfigureID="ASY-09-001";size(320,220,IgnoreAspect);fill(box((0,0),(320,220)),white);// BEGIN DRAWINGpaira=(45,45),b=(275,65),c=(155,180),m=(a+b)/2;filldraw(a--b--c--cycle,Wash,Blue);draw(c--m,Teal+1.5);dot(m,Orange+5);label("midpoint",m,S);// END DRAWINGlabel("ASY-09-001",(310,210),SW,fontsize(8pt));shipout(figureID);
Compilation completed successfully. No compiler messages were emitted.
Command or parameter
Meaning
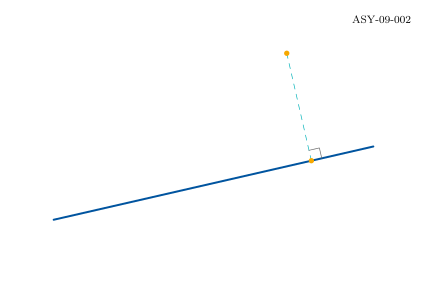
dot(p-a,u)
Compute signed distance along the unit direction.
Perpendicular vector
Rotate u by ninety degrees.
Complete standalone Asymptote program
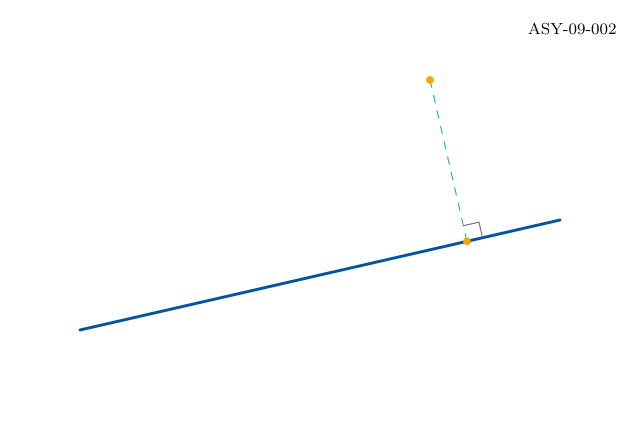
settings.tex="pdflatex";settings.outformat="pdf";settings.render=0;settings.prc=false;settings.v3d=false;defaultpen(fontsize(10pt));penBlue=rgb(0,84/255.0,159/255.0),Teal=rgb(0,177/255.0,183/255.0);penOrange=rgb(246/255.0,168/255.0,0),Green=rgb(87/255.0,171/255.0,39/255.0);penGrey=gray(.4),Light=gray(.92),Wash=rgb(232/255.0,241/255.0,250/255.0);stringfigureID="ASY-09-002";size(320,220,IgnoreAspect);fill(box((0,0),(320,220)),white);// BEGIN DRAWINGpaira=(40,55),b=(280,110),p=(215,180);pairu=unit(b-a),v=(-u.y,u.x);pairfoot=a+dot(p-a,u)*u;draw(a--b,Blue+1.5);draw(p--foot,Teal+dashed);draw(foot+8*u--foot+8*u+8*v--foot+8*v,Grey);dot(p,Orange+4);dot(foot,Orange+4);// END DRAWINGlabel("ASY-09-002",(310,210),SW,fontsize(8pt));shipout(figureID);
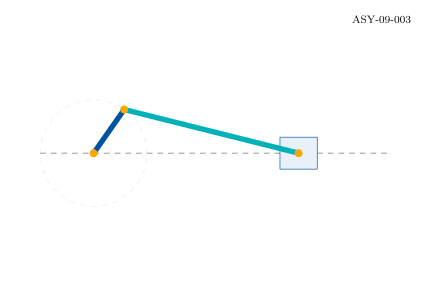
Solve the right triangle for the horizontal offset.
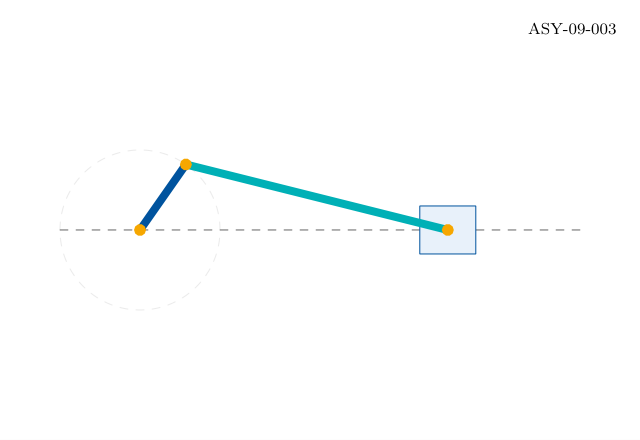
L=135
Preserve the connecting-rod length.
theta
Crank angle in degrees.
Complete standalone Asymptote program
settings.tex="pdflatex";settings.outformat="pdf";settings.render=0;settings.prc=false;settings.v3d=false;defaultpen(fontsize(10pt));penBlue=rgb(0,84/255.0,159/255.0),Teal=rgb(0,177/255.0,183/255.0);penOrange=rgb(246/255.0,168/255.0,0),Green=rgb(87/255.0,171/255.0,39/255.0);penGrey=gray(.4),Light=gray(.92),Wash=rgb(232/255.0,241/255.0,250/255.0);stringfigureID="ASY-09-003";size(320,220,IgnoreAspect);fill(box((0,0),(320,220)),white);// BEGIN DRAWINGpairo=(70,105);realr=40,L=135,theta=55;paira=o+r*dir(theta);realdx=sqrt(L^2-(a.y-o.y)^2);pairb=(a.x+dx,o.y);draw(circle(o,r),Light+dashed);draw((30,105)--(290,105),Grey+dashed);filldraw(box(b+(-14,-12),b+(14,12)),Wash,Blue);draw(o--a,Blue+4);draw(a--b,Teal+4);dot(newpair[]{o,a,b},Orange+6);write("check: rod-length="+(string)abs(b-a));// END DRAWINGlabel("ASY-09-003",(310,210),SW,fontsize(8pt));shipout(figureID);
Compilation completed successfully. No compiler messages were emitted.
Command or parameter
Meaning
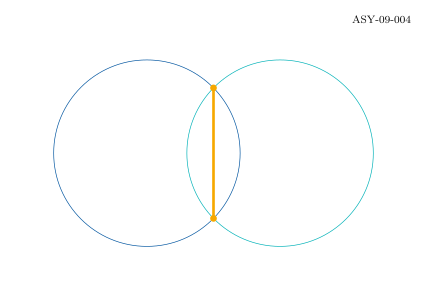
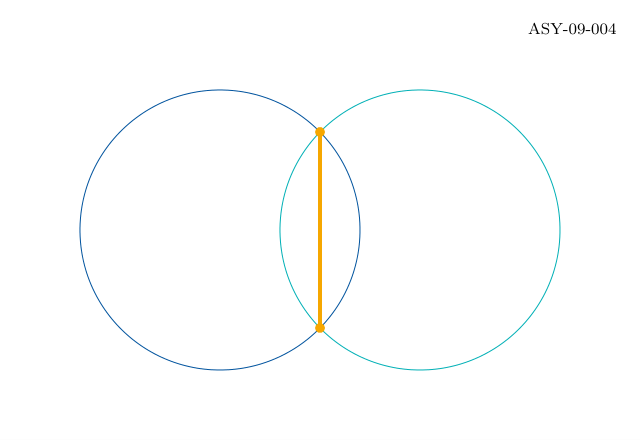
Equal radii
The common chord lies midway between centres.
r^2-x^2
Compute the squared half-chord length.
Complete standalone Asymptote program
settings.tex="pdflatex";settings.outformat="pdf";settings.render=0;settings.prc=false;settings.v3d=false;defaultpen(fontsize(10pt));penBlue=rgb(0,84/255.0,159/255.0),Teal=rgb(0,177/255.0,183/255.0);penOrange=rgb(246/255.0,168/255.0,0),Green=rgb(87/255.0,171/255.0,39/255.0);penGrey=gray(.4),Light=gray(.92),Wash=rgb(232/255.0,241/255.0,250/255.0);stringfigureID="ASY-09-004";size(320,220,IgnoreAspect);fill(box((0,0),(320,220)),white);// BEGIN DRAWINGpaira=(110,105),b=(210,105);realr=70,d=abs(b-a);realx=d/2,y=sqrt(r^2-x^2);pairupper=a+(x,y),lower=a+(x,-y);draw(circle(a,r),Blue);draw(circle(b,r),Teal);draw(lower--upper,Orange+2);dot(newpair[]{upper,lower},Orange+5);// END DRAWINGlabel("ASY-09-004",(310,210),SW,fontsize(8pt));shipout(figureID);
Compilation completed successfully. No compiler messages were emitted.
Command or parameter
Meaning
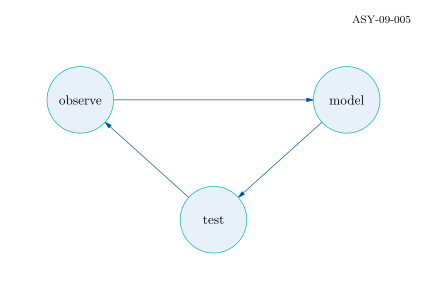
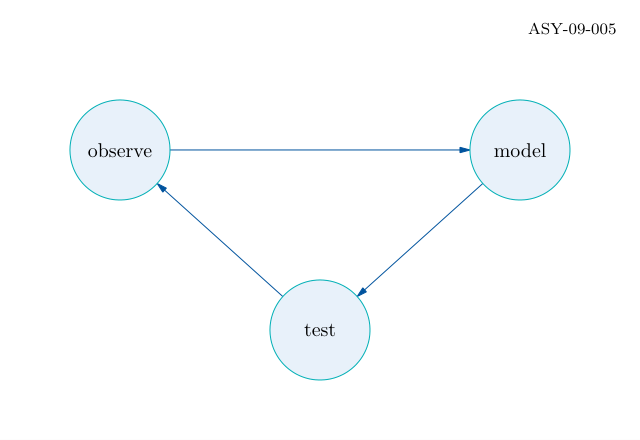
unit(b-a)
Find the connector direction.
Radius offsets
Place endpoints on circular boundaries.
Complete standalone Asymptote program
settings.tex="pdflatex";settings.outformat="pdf";settings.render=0;settings.prc=false;settings.v3d=false;defaultpen(fontsize(10pt));penBlue=rgb(0,84/255.0,159/255.0),Teal=rgb(0,177/255.0,183/255.0);penOrange=rgb(246/255.0,168/255.0,0),Green=rgb(87/255.0,171/255.0,39/255.0);penGrey=gray(.4),Light=gray(.92),Wash=rgb(232/255.0,241/255.0,250/255.0);stringfigureID="ASY-09-005";size(320,220,IgnoreAspect);fill(box((0,0),(320,220)),white);// BEGIN DRAWINGpair[]p={(60,145),(260,145),(160,55)};string[]names={"observe","model","test"};realr=25;for(inti=0;i<3;++i){intj=(i+1)%3;pairu=unit(p[j]-p[i]);draw(p[i]+r*u--p[j]-r*u,Blue,Arrow(5));}for(inti=0;i<3;++i){filldraw(circle(p[i],r),Wash,Teal);label(names[i],p[i]);}// END DRAWINGlabel("ASY-09-005",(310,210),SW,fontsize(8pt));shipout(figureID);
Compilation completed successfully. No compiler messages were emitted.
Command or parameter
Meaning
TeX strings
Use dollar delimiters for mathematics.
Alignment
N, S, E and W specify label placement relative to the anchor.
Complete standalone Asymptote program
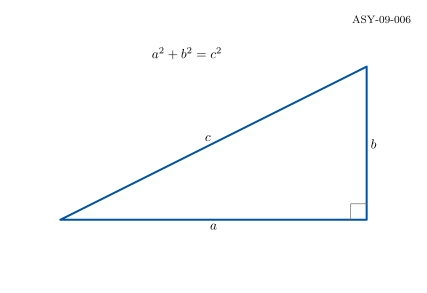
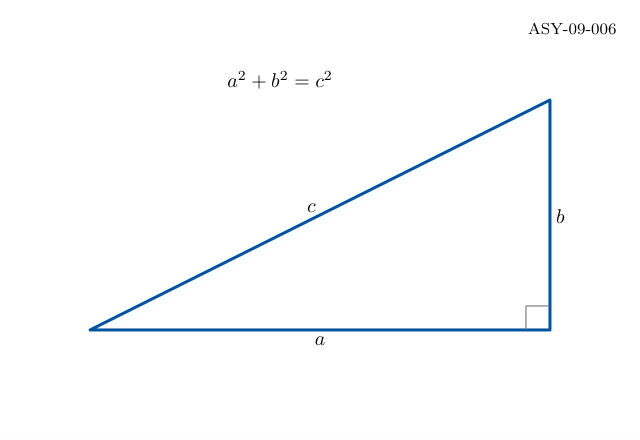
settings.tex="pdflatex";settings.outformat="pdf";settings.render=0;settings.prc=false;settings.v3d=false;defaultpen(fontsize(10pt));penBlue=rgb(0,84/255.0,159/255.0),Teal=rgb(0,177/255.0,183/255.0);penOrange=rgb(246/255.0,168/255.0,0),Green=rgb(87/255.0,171/255.0,39/255.0);penGrey=gray(.4),Light=gray(.92),Wash=rgb(232/255.0,241/255.0,250/255.0);stringfigureID="ASY-09-006";size(320,220,IgnoreAspect);fill(box((0,0),(320,220)),white);// BEGIN DRAWINGdraw((45,55)--(275,55)--(275,170)--cycle,Blue+1.5);label("$a$",(160,55),S);label("$b$",(275,112),E);label("$c$",(160,112),NW);label("$a^2+b^2=c^2$",(140,180));draw((263,55)--(263,67)--(275,67),Grey);// END DRAWINGlabel("ASY-09-006",(310,210),SW,fontsize(8pt));shipout(figureID);
Compilation completed successfully. No compiler messages were emitted.
Command or parameter
Meaning
triple
Represent a point or vector in three dimensions.
project(path3,camera)
Return a 2D path under the chosen projection.
Complete standalone Asymptote program
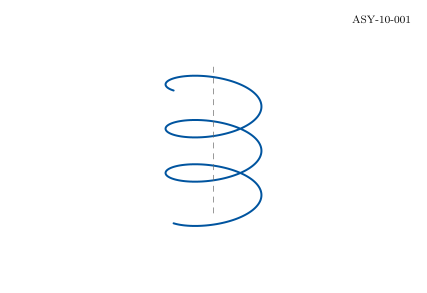
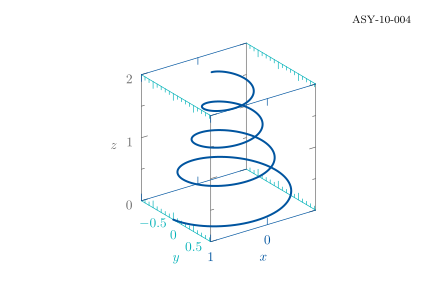
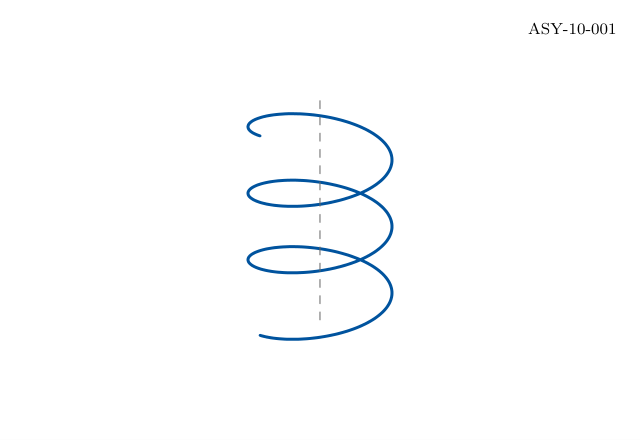
settings.tex="pdflatex";settings.outformat="pdf";settings.render=0;settings.prc=false;settings.v3d=false;defaultpen(fontsize(10pt));penBlue=rgb(0,84/255.0,159/255.0),Teal=rgb(0,177/255.0,183/255.0);penOrange=rgb(246/255.0,168/255.0,0),Green=rgb(87/255.0,171/255.0,39/255.0);penGrey=gray(.4),Light=gray(.92),Wash=rgb(232/255.0,241/255.0,250/255.0);stringfigureID="ASY-10-001";size(320,220,IgnoreAspect);fill(box((0,0),(320,220)),white);// BEGIN DRAWINGimportgraph3;triplehelix(realt){return(cos(t),sin(t),t/(2*pi));}projectioncamera=orthographic(4,6,3);pathp=project(graph(helix,0,6*pi,400),camera);draw(shift(160,60)*scale(36)*p,Blue+1.5);draw(shift(160,60)*scale(36)*project(O--3.3*Z,camera),Grey+dashed);// END DRAWINGlabel("ASY-10-001",(310,210),SW,fontsize(8pt));shipout(figureID);
Compilation completed successfully. No compiler messages were emitted.
Command or parameter
Meaning
path3
Keep the curve in three-dimensional coordinates.
Arrow3
Use a spatial arrowhead.
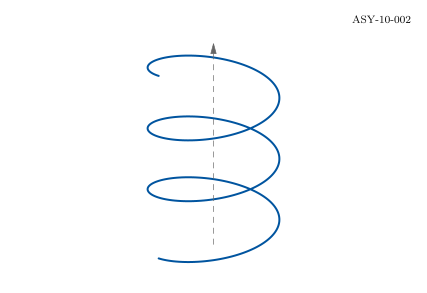
render=0
Produce a static vector projection.
Complete standalone Asymptote program
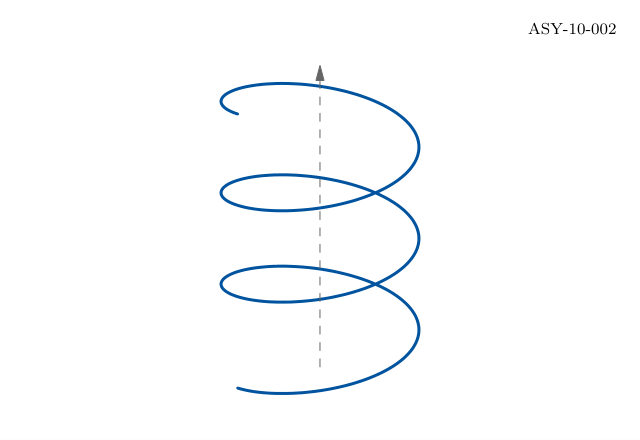
settings.tex="pdflatex";settings.outformat="pdf";settings.render=0;settings.prc=false;settings.v3d=false;defaultpen(fontsize(10pt));penBlue=rgb(0,84/255.0,159/255.0),Teal=rgb(0,177/255.0,183/255.0);penOrange=rgb(246/255.0,168/255.0,0),Green=rgb(87/255.0,171/255.0,39/255.0);penGrey=gray(.4),Light=gray(.92),Wash=rgb(232/255.0,241/255.0,250/255.0);stringfigureID="ASY-10-002";size(270,165);// BEGIN DRAWINGimportgraph3;currentprojection=orthographic(4,6,3);triplehelix(realt){return(cos(t),sin(t),t/(2*pi));}draw(graph(helix,0,6*pi,400),Blue+1.5);draw(O--3.3*Z,Grey+dashed,Arrow3);// END DRAWINGpicturedrawing=currentpicture;currentpicture=newpicture;size(320,220,IgnoreAspect);fill(box((0,0),(320,220)),white);add(drawing.fit3(),(160,105),align=0);label("ASY-10-002",(310,210),SW,fontsize(8pt));shipout(figureID);
Compilation completed successfully. No compiler messages were emitted.
Command or parameter
Meaning
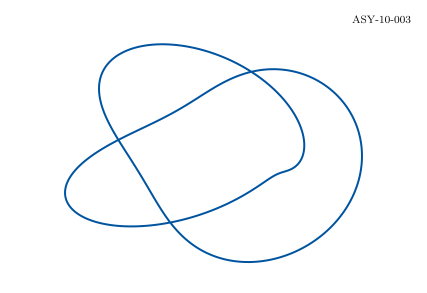
2 and 3 windings
Set the two integer frequencies of this torus knot.
Fixed camera
Keep comparison and print views reproducible.
Complete standalone Asymptote program
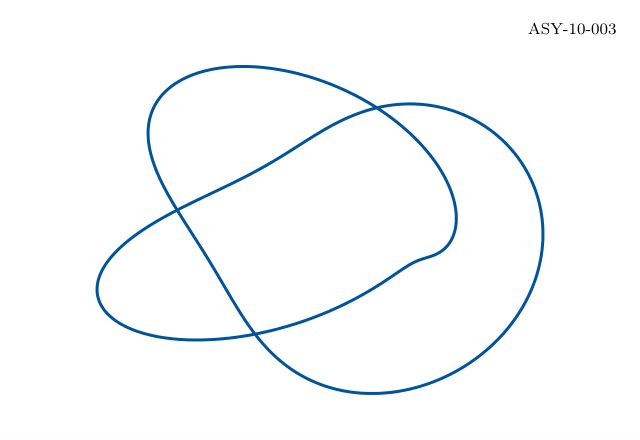
settings.tex="pdflatex";settings.outformat="pdf";settings.render=0;settings.prc=false;settings.v3d=false;defaultpen(fontsize(10pt));penBlue=rgb(0,84/255.0,159/255.0),Teal=rgb(0,177/255.0,183/255.0);penOrange=rgb(246/255.0,168/255.0,0),Green=rgb(87/255.0,171/255.0,39/255.0);penGrey=gray(.4),Light=gray(.92),Wash=rgb(232/255.0,241/255.0,250/255.0);stringfigureID="ASY-10-003";size(270,165);// BEGIN DRAWINGimportgraph3;currentprojection=orthographic(4,5,6);tripleknot(realt){return((2+.65*cos(3*t))*cos(2*t),(2+.65*cos(3*t))*sin(2*t),.65*sin(3*t));}draw(graph(knot,0,2*pi,600),Blue+1.5);// END DRAWINGpicturedrawing=currentpicture;currentpicture=newpicture;size(320,220,IgnoreAspect);fill(box((0,0),(320,220)),white);add(drawing.fit3(),(160,105),align=0);label("ASY-10-003",(310,210),SW,fontsize(8pt));shipout(figureID);
Compilation completed successfully. No compiler messages were emitted.
Command or parameter
Meaning
Bounds
Place axes at the spatial bounding box.
InTicks
Draw inward tick marks.
Damping
Decrease radius as height increases.
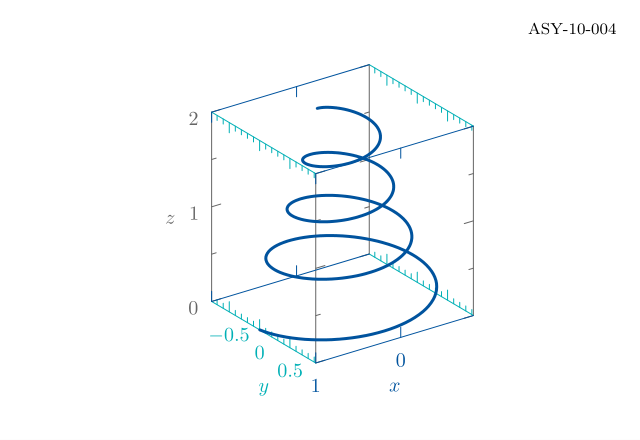
Complete standalone Asymptote program
settings.tex="pdflatex";settings.outformat="pdf";settings.render=0;settings.prc=false;settings.v3d=false;defaultpen(fontsize(10pt));penBlue=rgb(0,84/255.0,159/255.0),Teal=rgb(0,177/255.0,183/255.0);penOrange=rgb(246/255.0,168/255.0,0),Green=rgb(87/255.0,171/255.0,39/255.0);penGrey=gray(.4),Light=gray(.92),Wash=rgb(232/255.0,241/255.0,250/255.0);stringfigureID="ASY-10-004";size(270,165);// BEGIN DRAWINGimportgraph3;currentprojection=orthographic(5,7,4);triplef(realt){return(exp(-.15*t)*cos(3*t),exp(-.15*t)*sin(3*t),t/4);}draw(graph(f,0,8,350),Blue+1.5);xaxis3("$x$",Bounds,Blue,InTicks);yaxis3("$y$",Bounds,Teal,InTicks);zaxis3("$z$",Bounds,Grey,InTicks);// END DRAWINGpicturedrawing=currentpicture;currentpicture=newpicture;size(320,220,IgnoreAspect);fill(box((0,0),(320,220)),white);add(drawing.fit3(),(160,105),align=0);label("ASY-10-004",(310,210),SW,fontsize(8pt));shipout(figureID);
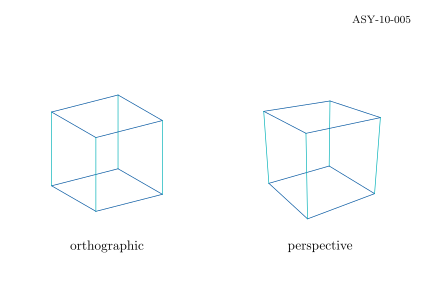
Compilation completed successfully. No compiler messages were emitted.
Command or parameter
Meaning
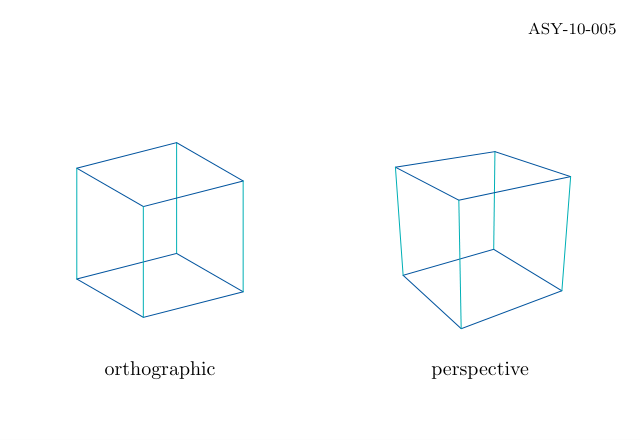
orthographic
Remove depth-dependent size change.
perspective
Project from a finite camera position.
Complete standalone Asymptote program
settings.tex="pdflatex";settings.outformat="pdf";settings.render=0;settings.prc=false;settings.v3d=false;defaultpen(fontsize(10pt));penBlue=rgb(0,84/255.0,159/255.0),Teal=rgb(0,177/255.0,183/255.0);penOrange=rgb(246/255.0,168/255.0,0),Green=rgb(87/255.0,171/255.0,39/255.0);penGrey=gray(.4),Light=gray(.92),Wash=rgb(232/255.0,241/255.0,250/255.0);stringfigureID="ASY-10-005";size(320,220,IgnoreAspect);fill(box((0,0),(320,220)),white);// BEGIN DRAWINGimportthree;triple[]v={(-1,-1,-1),(1,-1,-1),(1,1,-1),(-1,1,-1),(-1,-1,1),(1,-1,1),(1,1,1),(-1,1,1)};for(intk=0;k<2;++k){projectioncamera=k==0?orthographic(4,6,3):perspective(4,6,3);transformT=shift(80+160*k,105)*scale(30);for(inti=0;i<4;++i){draw(T*project(v[i]--v[(i+1)%4],camera),Blue);draw(T*project(v[i+4]--v[(i+1)%4+4],camera),Blue);draw(T*project(v[i]--v[i+4],camera),Teal);}label(k==0?"orthographic":"perspective",(80+160*k,35));}// END DRAWINGlabel("ASY-10-005",(310,210),SW,fontsize(8pt));shipout(figureID);
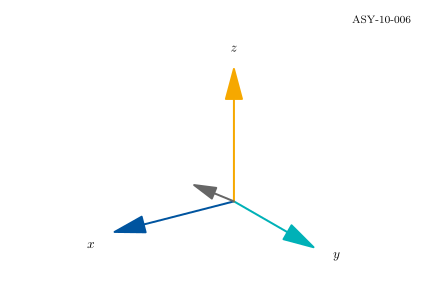
Compilation completed successfully. No compiler messages were emitted.
Command or parameter
Meaning
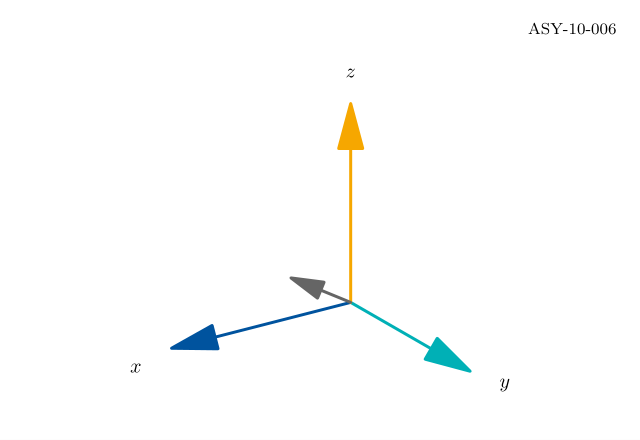
O, X, Y, Z
Use standard triples for the origin and coordinate directions.
Spatial labels
Place each label in the same coordinate system as its arrow.
Complete standalone Asymptote program
settings.tex="pdflatex";settings.outformat="pdf";settings.render=0;settings.prc=false;settings.v3d=false;defaultpen(fontsize(10pt));penBlue=rgb(0,84/255.0,159/255.0),Teal=rgb(0,177/255.0,183/255.0);penOrange=rgb(246/255.0,168/255.0,0),Green=rgb(87/255.0,171/255.0,39/255.0);penGrey=gray(.4),Light=gray(.92),Wash=rgb(232/255.0,241/255.0,250/255.0);stringfigureID="ASY-10-006";size(270,165);// BEGIN DRAWINGimportthree;currentprojection=orthographic(4,6,3);draw(O--X,Blue+1.5,Arrow3);draw(O--Y,Teal+1.5,Arrow3);draw(O--Z,Orange+1.5,Arrow3);draw(O--(1,1,.7),Grey+1.5,Arrow3);label("$x$",1.2X,S);label("$y$",1.2Y,E);label("$z$",1.1Z,N);// END DRAWINGpicturedrawing=currentpicture;currentpicture=newpicture;size(320,220,IgnoreAspect);fill(box((0,0),(320,220)),white);add(drawing.fit3(),(160,105),align=0);label("ASY-10-006",(310,210),SW,fontsize(8pt));shipout(figureID);
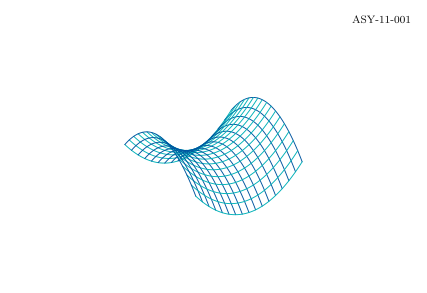
Compilation completed successfully. No compiler messages were emitted.
Command or parameter
Meaning
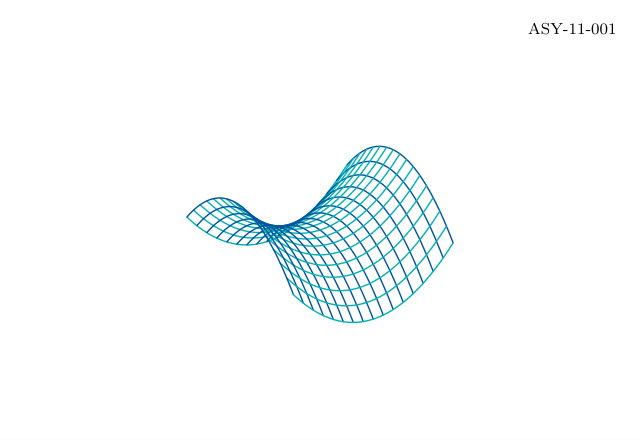
Wireframe
Draw both parameter directions.
No hidden-line solver
Explicitly projected wires all remain visible.
Complete standalone Asymptote program
settings.tex="pdflatex";settings.outformat="pdf";settings.render=0;settings.prc=false;settings.v3d=false;defaultpen(fontsize(10pt));penBlue=rgb(0,84/255.0,159/255.0),Teal=rgb(0,177/255.0,183/255.0);penOrange=rgb(246/255.0,168/255.0,0),Green=rgb(87/255.0,171/255.0,39/255.0);penGrey=gray(.4),Light=gray(.92),Wash=rgb(232/255.0,241/255.0,250/255.0);stringfigureID="ASY-11-001";size(320,220,IgnoreAspect);fill(box((0,0),(320,220)),white);// BEGIN DRAWINGimportgraph3;projectioncamera=orthographic(4,6,4);transformT=shift(160,105)*scale(48);for(inti=-8;i<=8;++i){reala=i/8.0;triplef(realt){return(a,t,.6*(a*a-t*t));}tripleg(realt){return(t,a,.6*(t*t-a*a));}draw(T*project(graph(f,-1,1,60),camera),Blue+.7);draw(T*project(graph(g,-1,1,60),camera),Teal+.7);}// END DRAWINGlabel("ASY-11-001",(310,210),SW,fontsize(8pt));shipout(figureID);
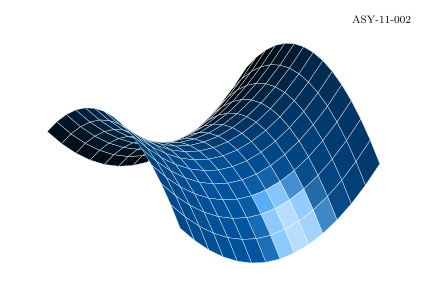
Compilation completed successfully. No compiler messages were emitted.
Command or parameter
Meaning
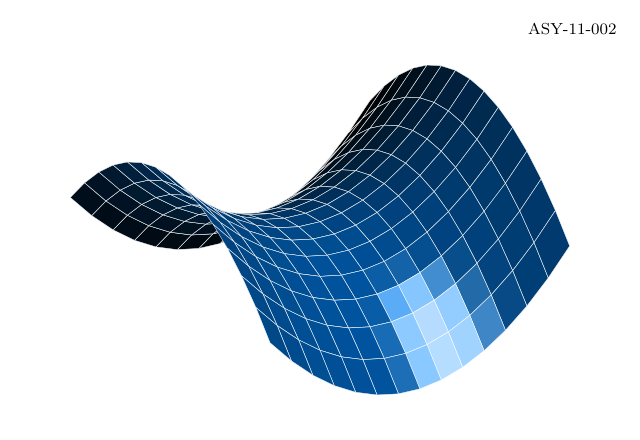
surface(f,a,b)
Sample a pair-valued parameter domain into a spatial surface.
nu / nv
Set patch counts in the two directions.
meshpen
Draw the parameter mesh on the filled surface.
Complete standalone Asymptote program
settings.tex="pdflatex";settings.outformat="pdf";settings.render=0;settings.prc=false;settings.v3d=false;defaultpen(fontsize(10pt));penBlue=rgb(0,84/255.0,159/255.0),Teal=rgb(0,177/255.0,183/255.0);penOrange=rgb(246/255.0,168/255.0,0),Green=rgb(87/255.0,171/255.0,39/255.0);penGrey=gray(.4),Light=gray(.92),Wash=rgb(232/255.0,241/255.0,250/255.0);stringfigureID="ASY-11-002";size(270,165);// BEGIN DRAWINGimportgraph3;currentprojection=orthographic(4,6,4);triplef(pairt){return(t.x,t.y,.6*(t.x^2-t.y^2));}surfaces=surface(f,(-1,-1),(1,1),nu=14,nv=14);draw(s,Blue,meshpen=white+.25);// END DRAWINGpicturedrawing=currentpicture;currentpicture=newpicture;size(320,220,IgnoreAspect);fill(box((0,0),(320,220)),white);add(drawing.fit3(),(160,105),align=0);label("ASY-11-002",(310,210),SW,fontsize(8pt));shipout(figureID);
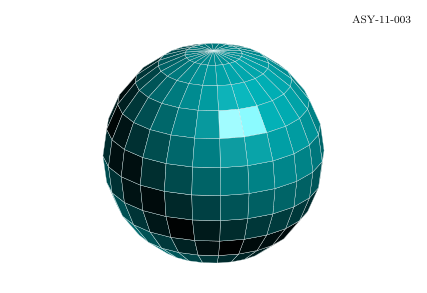
Compilation completed successfully. No compiler messages were emitted.
Command or parameter
Meaning
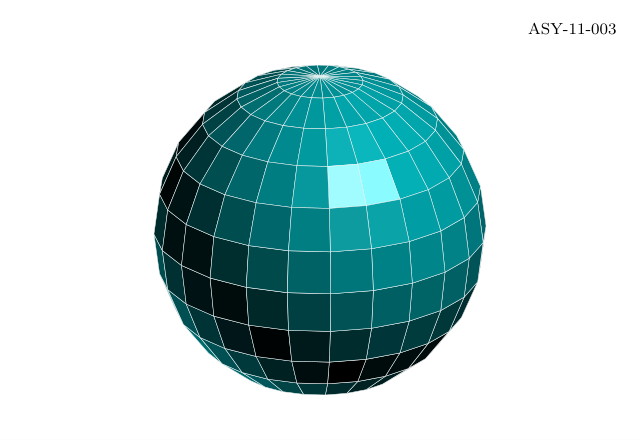
Angular coordinates
Use radians for both parameters.
Latitude poles
The horizontal radius vanishes at plus or minus pi/2.
Complete standalone Asymptote program
settings.tex="pdflatex";settings.outformat="pdf";settings.render=0;settings.prc=false;settings.v3d=false;defaultpen(fontsize(10pt));penBlue=rgb(0,84/255.0,159/255.0),Teal=rgb(0,177/255.0,183/255.0);penOrange=rgb(246/255.0,168/255.0,0),Green=rgb(87/255.0,171/255.0,39/255.0);penGrey=gray(.4),Light=gray(.92),Wash=rgb(232/255.0,241/255.0,250/255.0);stringfigureID="ASY-11-003";size(270,165);// BEGIN DRAWINGimportgraph3;currentprojection=orthographic(4,6,3);triplespherepoint(pairuv){return(cos(uv.x)*cos(uv.y),sin(uv.x)*cos(uv.y),sin(uv.y));}surfaces=surface(spherepoint,(0,-pi/2),(2*pi,pi/2),nu=24,nv=12);draw(s,Teal,meshpen=white+.25);// END DRAWINGpicturedrawing=currentpicture;currentpicture=newpicture;size(320,220,IgnoreAspect);fill(box((0,0),(320,220)),white);add(drawing.fit3(),(160,105),align=0);label("ASY-11-003",(310,210),SW,fontsize(8pt));shipout(figureID);
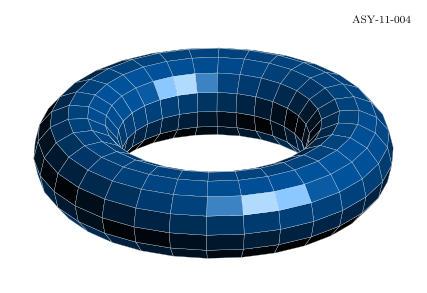
Compilation completed successfully. No compiler messages were emitted.
Command or parameter
Meaning
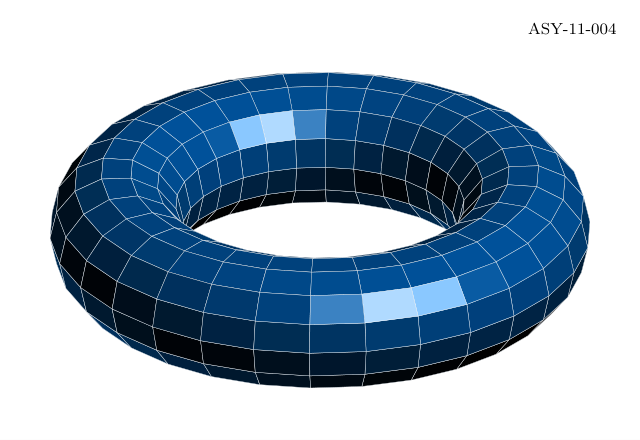
R=2
Set distance from the centre to the tube centre.
r=.65
Set the tube radius.
Periodic domain
Both angles cover one full turn.
Complete standalone Asymptote program
settings.tex="pdflatex";settings.outformat="pdf";settings.render=0;settings.prc=false;settings.v3d=false;defaultpen(fontsize(10pt));penBlue=rgb(0,84/255.0,159/255.0),Teal=rgb(0,177/255.0,183/255.0);penOrange=rgb(246/255.0,168/255.0,0),Green=rgb(87/255.0,171/255.0,39/255.0);penGrey=gray(.4),Light=gray(.92),Wash=rgb(232/255.0,241/255.0,250/255.0);stringfigureID="ASY-11-004";size(270,165);// BEGIN DRAWINGimportgraph3;currentprojection=orthographic(5,6,4);tripletorus(pairuv){realR=2,r=.65;return((R+r*cos(uv.y))*cos(uv.x),(R+r*cos(uv.y))*sin(uv.x),r*sin(uv.y));}draw(surface(torus,(0,0),(2*pi,2*pi),nu=30,nv=14),Blue,meshpen=white+.2);// END DRAWINGpicturedrawing=currentpicture;currentpicture=newpicture;size(320,220,IgnoreAspect);fill(box((0,0),(320,220)),white);add(drawing.fit3(),(160,105),align=0);label("ASY-11-004",(310,210),SW,fontsize(8pt));shipout(figureID);
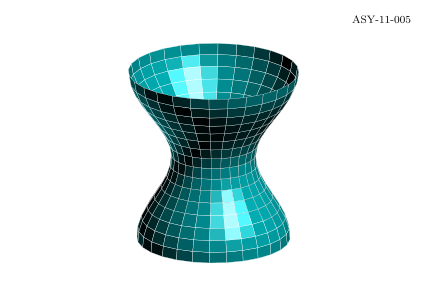
Compilation completed successfully. No compiler messages were emitted.
Command or parameter
Meaning
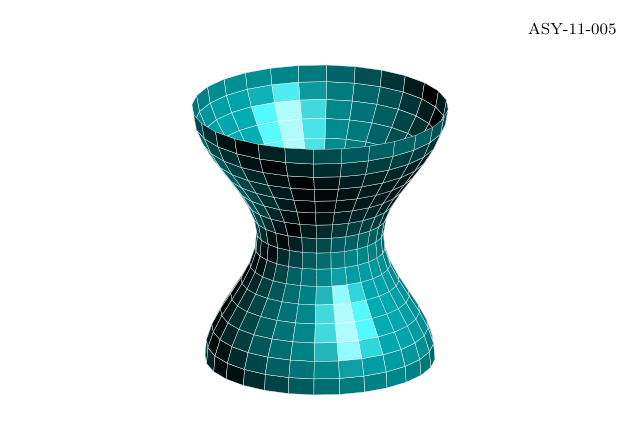
uv.x
Angular position around the axis.
uv.y
Normalized height between zero and one.
Profile
Use one formula for radius as a function of height.
Complete standalone Asymptote program
settings.tex="pdflatex";settings.outformat="pdf";settings.render=0;settings.prc=false;settings.v3d=false;defaultpen(fontsize(10pt));penBlue=rgb(0,84/255.0,159/255.0),Teal=rgb(0,177/255.0,183/255.0);penOrange=rgb(246/255.0,168/255.0,0),Green=rgb(87/255.0,171/255.0,39/255.0);penGrey=gray(.4),Light=gray(.92),Wash=rgb(232/255.0,241/255.0,250/255.0);stringfigureID="ASY-11-005";size(270,165);// BEGIN DRAWINGimportgraph3;currentprojection=orthographic(5,7,3);triplevase(pairuv){realr=.65+.22*cos(2*pi*uv.y)+.1*uv.y;return(r*cos(uv.x),r*sin(uv.x),2*uv.y);}draw(surface(vase,(0,0),(2*pi,1),nu=28,nv=16),Teal,meshpen=white+.2);// END DRAWINGpicturedrawing=currentpicture;currentpicture=newpicture;size(320,220,IgnoreAspect);fill(box((0,0),(320,220)),white);add(drawing.fit3(),(160,105),align=0);label("ASY-11-005",(310,210),SW,fontsize(8pt));shipout(figureID);
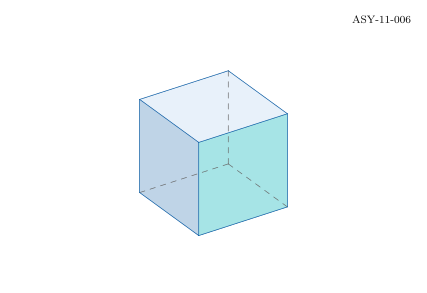
Three selected faces and twelve edges make the projection readable. Hidden edges are styled manually for this chosen view; this is not an automatic visibility algorithm.
Compilation completed successfully. No compiler messages were emitted.
Command or parameter
Meaning
Explicit faces
Choose and fill three faces for the fixed camera.
Hidden edges
Use dashed pens for the manually identified hidden edges.
Complete standalone Asymptote program
settings.tex="pdflatex";settings.outformat="pdf";settings.render=0;settings.prc=false;settings.v3d=false;defaultpen(fontsize(10pt));penBlue=rgb(0,84/255.0,159/255.0),Teal=rgb(0,177/255.0,183/255.0);penOrange=rgb(246/255.0,168/255.0,0),Green=rgb(87/255.0,171/255.0,39/255.0);penGrey=gray(.4),Light=gray(.92),Wash=rgb(232/255.0,241/255.0,250/255.0);stringfigureID="ASY-11-006";size(320,220,IgnoreAspect);fill(box((0,0),(320,220)),white);// BEGIN DRAWINGimportthree;projectioncamera=orthographic(4,6,4);pairP(triplev){return(160,105)+40*project(v,camera);}triple[]v={(-1,-1,-1),(1,-1,-1),(1,1,-1),(-1,1,-1),(-1,-1,1),(1,-1,1),(1,1,1),(-1,1,1)};fill(P(v[4])--P(v[5])--P(v[6])--P(v[7])--cycle,Wash);fill(P(v[1])--P(v[2])--P(v[6])--P(v[5])--cycle,interp(white,Blue,.25));fill(P(v[2])--P(v[3])--P(v[7])--P(v[6])--cycle,interp(white,Teal,.35));for(inti=0;i<4;++i){draw(P(v[i])--P(v[(i+1)%4]),i==0||i==3?Grey+dashed:Blue);draw(P(v[i+4])--P(v[(i+1)%4+4]),Blue);draw(P(v[i])--P(v[i+4]),i==0?Grey+dashed:Blue);}// END DRAWINGlabel("ASY-11-006",(310,210),SW,fontsize(8pt));shipout(figureID);
Compilation completed successfully. No compiler messages were emitted.
Command or parameter
Meaning
picture
Collect drawing operations before composition.
clip
Keep only the portion inside a closed path.
Complete standalone Asymptote program
settings.tex="pdflatex";settings.outformat="pdf";settings.render=0;settings.prc=false;settings.v3d=false;defaultpen(fontsize(10pt));penBlue=rgb(0,84/255.0,159/255.0),Teal=rgb(0,177/255.0,183/255.0);penOrange=rgb(246/255.0,168/255.0,0),Green=rgb(87/255.0,171/255.0,39/255.0);penGrey=gray(.4),Light=gray(.92),Wash=rgb(232/255.0,241/255.0,250/255.0);stringfigureID="ASY-12-001";size(320,220,IgnoreAspect);fill(box((0,0),(320,220)),white);// BEGIN DRAWINGpicturewaves;for(intj=-4;j<=16;++j){pathp=(0,12*j)..(80,12*j+18)..(160,12*j)..(240,12*j+18)..(320,12*j);draw(waves,p,Blue+.7);}pathboundary=circle((160,105),80);clip(waves,boundary);add(waves);draw(boundary,Grey);// END DRAWINGlabel("ASY-12-001",(310,210),SW,fontsize(8pt));shipout(figureID);
Compilation completed successfully. No compiler messages were emitted.
Command or parameter
Meaning
size(picture,w,h)
Scale each subplot independently.
fit()
Convert a picture to a physical-size frame.
add(frame,position)
Place the fitted result on the common canvas.
Complete standalone Asymptote program
settings.tex="pdflatex";settings.outformat="pdf";settings.render=0;settings.prc=false;settings.v3d=false;defaultpen(fontsize(10pt));penBlue=rgb(0,84/255.0,159/255.0),Teal=rgb(0,177/255.0,183/255.0);penOrange=rgb(246/255.0,168/255.0,0),Green=rgb(87/255.0,171/255.0,39/255.0);penGrey=gray(.4),Light=gray(.92),Wash=rgb(232/255.0,241/255.0,250/255.0);stringfigureID="ASY-12-002";size(320,220,IgnoreAspect);fill(box((0,0),(320,220)),white);// BEGIN DRAWINGimportgraph;picturea,b;size(a,120,110);size(b,120,110);draw(a,graph(sin,0,2*pi),Blue+1.2);xaxis(a,"$x$",Bottom,Ticks);yaxis(a,"$\sin x$",Left,Ticks);realf(realx){returnexp(-x);}draw(b,graph(f,0,4),Teal+1.2);xaxis(b,"$x$",Bottom,Ticks);yaxis(b,"$e^{-x}$",Left,Ticks);add(a.fit(),(80,105),align=0);add(b.fit(),(240,105),align=0);label("(a)",(80,185));label("(b)",(240,185));// END DRAWINGlabel("ASY-12-002",(310,210),SW,fontsize(8pt));shipout(figureID);
Compilation completed successfully. No compiler messages were emitted.
Command or parameter
Meaning
Supplied intervals
The example does not infer a confidence level.
Bars(4)
Use physical-size end caps.
Legend sample
Reuse the actual plotted styling.
Complete standalone Asymptote program
settings.tex="pdflatex";settings.outformat="pdf";settings.render=0;settings.prc=false;settings.v3d=false;defaultpen(fontsize(10pt));penBlue=rgb(0,84/255.0,159/255.0),Teal=rgb(0,177/255.0,183/255.0);penOrange=rgb(246/255.0,168/255.0,0),Green=rgb(87/255.0,171/255.0,39/255.0);penGrey=gray(.4),Light=gray(.92),Wash=rgb(232/255.0,241/255.0,250/255.0);stringfigureID="ASY-12-003";size(320,220,IgnoreAspect);fill(box((0,0),(320,220)),white);// BEGIN DRAWINGrealxmin=0,xmax=5,ymin=0,ymax=8;pairP(realx,realy){return(45+245*(x-xmin)/(xmax-xmin),35+145*(y-ymin)/(ymax-ymin));}for(inti=0;i<=4;++i){realx=xmin+i*(xmax-xmin)/4,y=ymin+i*(ymax-ymin)/4;draw(P(x,ymin)--P(x,ymax),Light);draw(P(xmin,y)--P(xmax,y),Light);label(format("$%.3g$",x),P(x,ymin),S);label(format("$%.3g$",y),P(xmin,y),W);}draw(P(xmin,ymax)--P(xmin,ymin)--P(xmax,ymin),Grey);real[]y={2,4,3.5,6},e={.6,.8,.5,1};for(inti=0;i<y.length;++i){draw(P(i+1,y[i]-e[i])--P(i+1,y[i]+e[i]),Blue,Bars(4));dot(P(i+1,y[i]),Orange+5);}draw((130,195)--(150,195),Blue,Bars(4));label("supplied interval",(155,195),E);// END DRAWINGlabel("ASY-12-003",(310,210),SW,fontsize(8pt));shipout(figureID);
Compilation completed successfully. No compiler messages were emitted.
Command or parameter
Meaning
bbox
Construct a fitted frame around typeset content.
Padding 6
Leave six physical points around the label.
Fill(Wash)
Give the frame an opaque background.
Complete standalone Asymptote program
settings.tex="pdflatex";settings.outformat="pdf";settings.render=0;settings.prc=false;settings.v3d=false;defaultpen(fontsize(10pt));penBlue=rgb(0,84/255.0,159/255.0),Teal=rgb(0,177/255.0,183/255.0);penOrange=rgb(246/255.0,168/255.0,0),Green=rgb(87/255.0,171/255.0,39/255.0);penGrey=gray(.4),Light=gray(.92),Wash=rgb(232/255.0,241/255.0,250/255.0);stringfigureID="ASY-12-004";size(320,220,IgnoreAspect);fill(box((0,0),(320,220)),white);// BEGIN DRAWINGpicturetext;label(text,"$\displaystyle \int_0^\pi \sin x\,dx=2$",(0,0));framef=bbox(text,6,Blue,Fill(Wash));add(f,(160,105),align=0);// END DRAWINGlabel("ASY-12-004",(310,210),SW,fontsize(8pt));shipout(figureID);
Compilation completed successfully. No compiler messages were emitted.
Command or parameter
Meaning
size
Choose the fitted geometric dimensions.
Physical pens
Line width remains 1.5 points in both pictures.
fontsize
Keep text at ten points in both pictures.
Complete standalone Asymptote program
settings.tex="pdflatex";settings.outformat="pdf";settings.render=0;settings.prc=false;settings.v3d=false;defaultpen(fontsize(10pt));penBlue=rgb(0,84/255.0,159/255.0),Teal=rgb(0,177/255.0,183/255.0);penOrange=rgb(246/255.0,168/255.0,0),Green=rgb(87/255.0,171/255.0,39/255.0);penGrey=gray(.4),Light=gray(.92),Wash=rgb(232/255.0,241/255.0,250/255.0);stringfigureID="ASY-12-005";size(320,220,IgnoreAspect);fill(box((0,0),(320,220)),white);// BEGIN DRAWINGpicturea,b;pathmotif=(0,0)..(1,1)..(2,0);size(a,85,65);size(b,145,110);draw(a,motif,Blue+1.5);draw(b,motif,Blue+1.5);label(a,"small",(1,0),S,fontsize(10pt));label(b,"large",(1,0),S,fontsize(10pt));add(a.fit(),(80,105),align=0);add(b.fit(),(230,105),align=0);// END DRAWINGlabel("ASY-12-005",(310,210),SW,fontsize(8pt));shipout(figureID);
A finished plot combines several independent encodings. The tangent uses the analytic derivative; the shaded area is an explicit interval under the function.
Fill only between x=1 and x=3 and the zero baseline.
One coordinate map
Use the same P function for every layer.
Complete standalone Asymptote program
settings.tex="pdflatex";settings.outformat="pdf";settings.render=0;settings.prc=false;settings.v3d=false;defaultpen(fontsize(10pt));penBlue=rgb(0,84/255.0,159/255.0),Teal=rgb(0,177/255.0,183/255.0);penOrange=rgb(246/255.0,168/255.0,0),Green=rgb(87/255.0,171/255.0,39/255.0);penGrey=gray(.4),Light=gray(.92),Wash=rgb(232/255.0,241/255.0,250/255.0);stringfigureID="ASY-12-006";size(320,220,IgnoreAspect);fill(box((0,0),(320,220)),white);// BEGIN DRAWINGrealxmin=0,xmax=6,ymin=-1.5,ymax=1.5;pairP(realx,realy){return(45+245*(x-xmin)/(xmax-xmin),35+145*(y-ymin)/(ymax-ymin));}for(inti=0;i<=4;++i){realx=xmin+i*(xmax-xmin)/4,y=ymin+i*(ymax-ymin)/4;draw(P(x,ymin)--P(x,ymax),Light);draw(P(xmin,y)--P(xmax,y),Light);label(format("$%.3g$",x),P(x,ymin),S);label(format("$%.3g$",y),P(xmin,y),W);}draw(P(xmin,ymax)--P(xmin,ymin)--P(xmax,ymin),Grey);importgraph;pairf(realx){returnP(x,sin(x));}pathp=graph(f,0,6,200),area=graph(f,1,3,80);fill(area--P(3,0)--P(1,0)--cycle,Wash);draw(p,Blue+1.5);reala=2,slope=cos(a);draw(P(1,sin(a)-slope)--P(3,sin(a)+slope),Orange+1.5);dot(P(a,sin(a)),Teal+5);label("tangent",P(2.8,1.1),Orange);write("check: tangent-slope="+(string)slope);// END DRAWINGlabel("ASY-12-006",(310,210),SW,fontsize(8pt));shipout(figureID);