Skip to examples

A visual reference · grap

grap,
one change at a time

Complete source. One deliberate change. Its actual result. Follow measurements from a small field archive through counts, trends and scientific comparisons. Data coordinates and physical page dimensions have different jobs; each example makes that distinction visible.

The Org file is canonical. Read the searchable HTML beside your editor or use the PDF offline. All measurements and operational quantities are synthetic teaching fixtures.

Last changes: 2026-11-16. Original examples, pinned native rendering and portable source/configuration downloads.

Download PDFRendered tour · read offline
60worked examples
10topic families
1canonical Org source

Reading the tour

Three ways to see a change

Read the source

Each example is a complete file. Identify the syntax introduced before changing it.

Inspect the output

Open a gallery thumbnail, compare the native figure and follow a sibling example.

Make a change

Download the source/configuration ZIP, make the suggested edit and repeat its exact command.

Browse this tour with the gallery, search and topic filters. Stable IDs identify chapters and examples; Back to diagram overview returns to the corresponding thumbnail. The shared configuration sets appearance, never example data.

Reproduce the diagrams

The reviewed native toolchain is GNU pic and groff 1.25.0, grap 1.49, pdfcrop 1.42, Ghostscript 10.08.0 and Poppler 26.11.0. Exact checksums and publisher versions are recorded in VERSIONS.json. Install GNU groff, Ghostscript, Poppler and TeX Live with pdfcrop. Install grap 1.49 as well. The driver checks the native versions and the bundled Nimbus Sans font programs. Native PDF is produced by groff with all used fonts embedded, then cropped by pdfcrop; Poppler creates the SVG and PNG companions.

Install the shared publisher with make setup in its sibling directory. Activate that Python environment before using a standalone bundle, or install its pinned requirements.txt in a fresh environment. The published HTML embeds figures and works offline; keep the companion directories for individual downloads.

make full
make check
tools/render --version
tools/render examples/GRA-01-001.grap
Command or configuration Meaning in this tour
tools/render SOURCE Run the pinned native pipeline and write PDF, SVG and PNG.
config/render.json Reviewed tool versions and bundled font checksums.
SOURCE_DATE_EPOCH=0 Fix native build-date inputs; the driver removes PDF date metadata.
make full Explicitly execute reviewed programs, then build HTML and PDF.
make Reuse verified local results; never execute examples implicitly.
make check Verify output hashes, example IDs and offline links.
pic -S Expand the complete drawing with native safe mode.
groff -Tpdf -P-e -P-W -P-pa3 Embed all used fonts, make warnings fatal and use a generous A3 working canvas.
pdfcrop --hires --margins 10 Trim the native PDF and preserve a ten-point margin.
pdftocairo -svg Convert the native PDF to its self-contained SVG companion.
pdftocairo -png -singlefile -r 120 Produce the downloadable PNG at a fixed resolution.
grap -d config/grap.defines Read the bundled standard macro definitions before pic.

The grap 1.49 version query returns exit status 5 while printing its banner. The driver checks that banner; every actual example render must return zero.

Download the complete reproduction bundle to run all examples, or inspect the shared render configuration. After installing system tools and the shared Python dependencies, preparation and rendering use no network. SVG is self-contained vector artwork; native PDF pages are placed directly in the guide. Repair sources rather than editing generated figures.

01 · First graphs

Separate the physical frame from the data values plotted inside it.

GRA-01-001

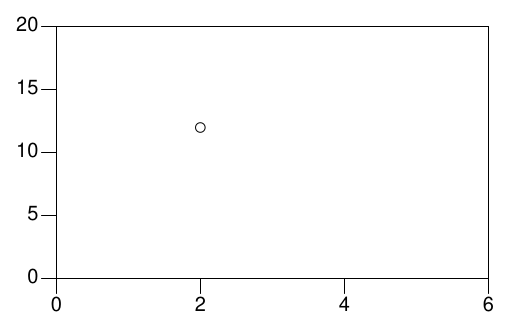
Place one reading

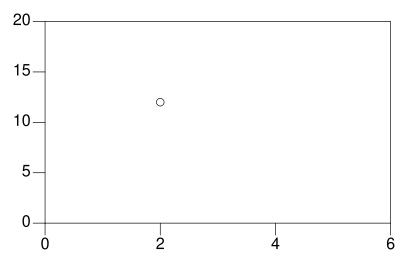
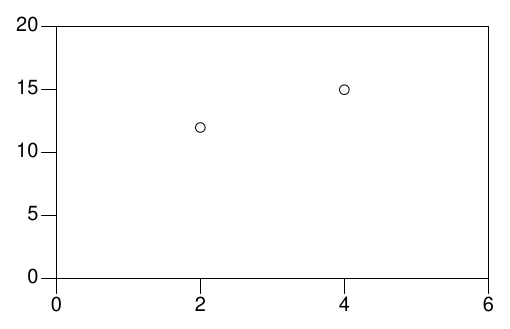
A circle places one supplied reading inside explicit data limits. Use a fixed frame so later examples can be compared without changing their scale.

Back to diagram overview

Compare with groff document and diagram tour.

Complete grap source

.so config/render.roff
.G1
frame ht 2.1 wid 3.6
coord x 0,6 y 0,20
circle at 2,12 radius .04
.G2
ParameterMeaning in this example
coord x / yDefine the horizontal and vertical data ranges.
circle atPlace a marker at one data coordinate.

Render this diagram

tools/render examples/GRA-01-001.grap

Try changing: Move the reading to 3,14.

Actual output

Place one reading
GRA-01-001 · grap native output

grap · exit 0

Native compiler log

Standard output

GRA-01-001: native PDF, SVG and PNG rendered with GNU pic / groff 1.25.0; grap 1.49

Download: Source · Source + configuration ZIP · SVG · Native PDF · PNG

GRA-01-002

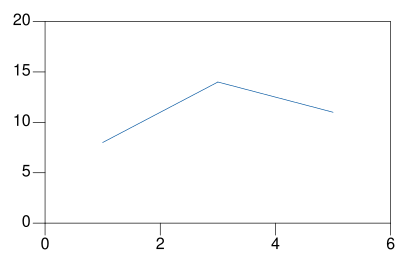
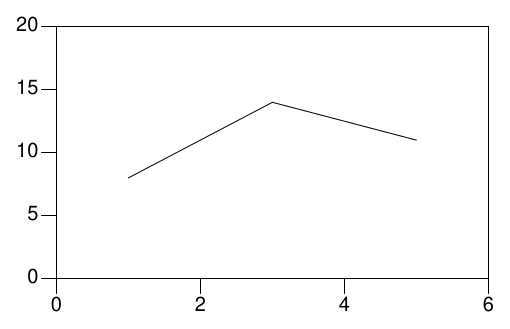
Connect successive readings

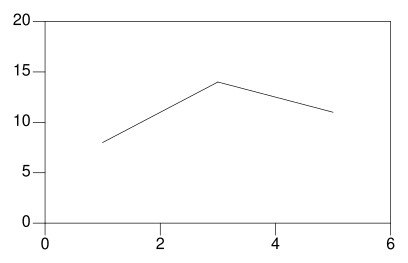
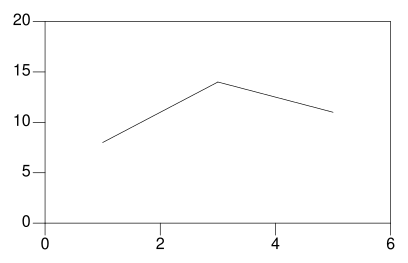
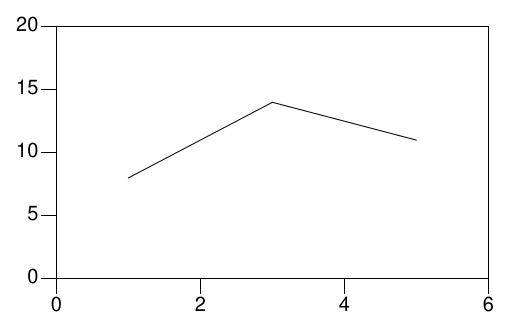
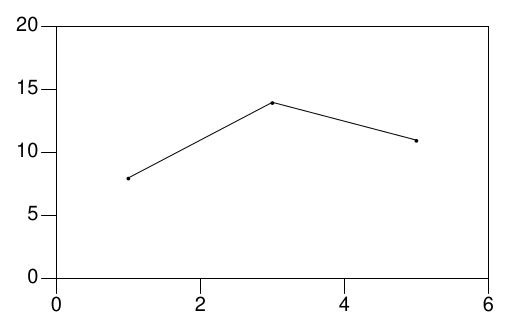
Next commands extend one named sequence in source order. Use a line for ordered measurements whose connection is meaningful.

Back to diagram overview

Compare with GRA-01-001 · Place one reading.

Complete grap source

.so config/render.roff
.G1
frame ht 2.1 wid 3.6
coord x 0,6 y 0,20
draw solid
next at 1,8
next at 3,14
next at 5,11
.G2
ParameterMeaning in this example
draw solidConnect successive points with a solid line.
next atAppend a point to the sequence.

Render this diagram

tools/render examples/GRA-01-002.grap

Try changing: Change the middle value to 16.

Actual output

Connect successive readings
GRA-01-002 · grap native output

grap · exit 0

Native compiler log

Standard output

GRA-01-002: native PDF, SVG and PNG rendered with GNU pic / groff 1.25.0; grap 1.49

Download: Source · Source + configuration ZIP · SVG · Native PDF · PNG

GRA-01-003

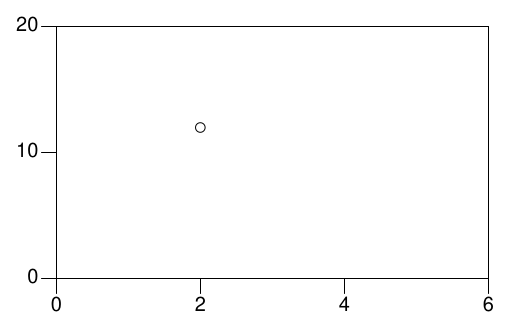
Choose the axis ticks

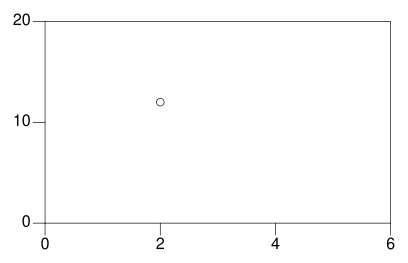
Explicit ticks make the reference values deliberate. Use them when a report needs the same visible scale across several figures.

Back to diagram overview

Compare with GRA-01-002 · Connect successive readings.

Complete grap source

.so config/render.roff
.G1
frame ht 2.1 wid 3.6
coord x 0,6 y 0,20
ticks left at 0,10,20
circle at 2,12 radius .04
.G2
ParameterMeaning in this example
ticks left atReplace automatic left-axis ticks with these values.

Render this diagram

tools/render examples/GRA-01-003.grap

Try changing: Add a tick at 15.

Actual output

Choose the axis ticks
GRA-01-003 · grap native output

grap · exit 0

Native compiler log

Standard output

GRA-01-003: native PDF, SVG and PNG rendered with GNU pic / groff 1.25.0; grap 1.49

Download: Source · Source + configuration ZIP · SVG · Native PDF · PNG

GRA-01-004

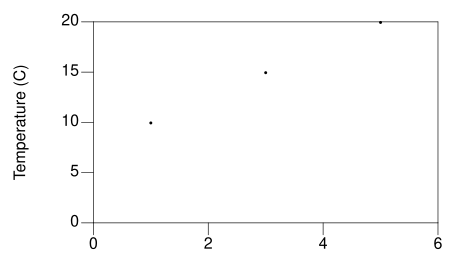
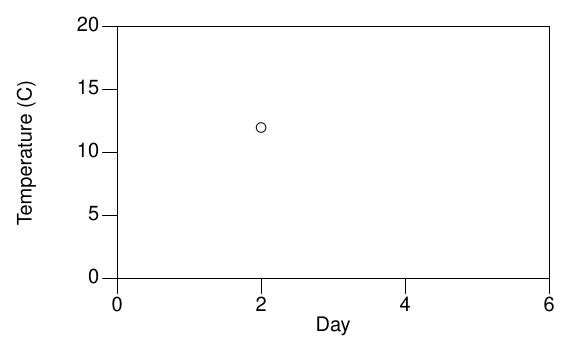
Name the axes and units

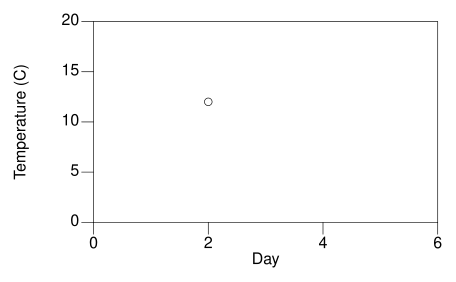
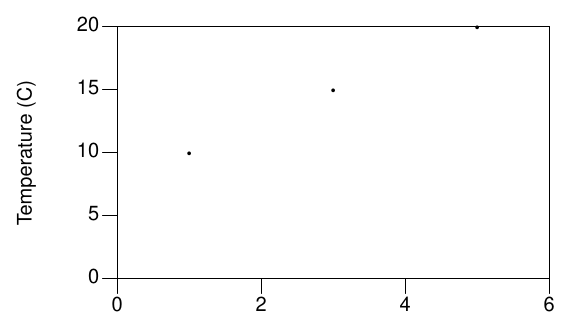
Axis labels explain what the coordinates measure. Use a unit in the value label so a numeric reading is not ambiguous.

Back to diagram overview

Compare with GRA-01-003 · Choose the axis ticks.

Complete grap source

.so config/render.roff
.G1
frame ht 2.1 wid 3.6
coord x 0,6 y 0,20
label bottom "Day"
label left "Temperature (C)" left .35
circle at 2,12 radius .04
.G2
ParameterMeaning in this example
labelAttach explanatory text to a side of the frame.

Render this diagram

tools/render examples/GRA-01-004.grap

Try changing: Change Temperature (C) to Count.

Actual output

Name the axes and units
GRA-01-004 · grap native output

grap · exit 0

Native compiler log

Standard output

GRA-01-004: native PDF, SVG and PNG rendered with GNU pic / groff 1.25.0; grap 1.49

Download: Source · Source + configuration ZIP · SVG · Native PDF · PNG

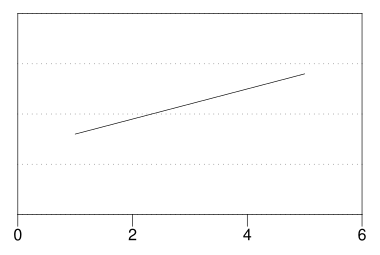
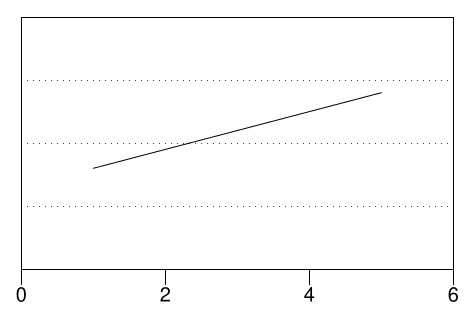
GRA-01-005

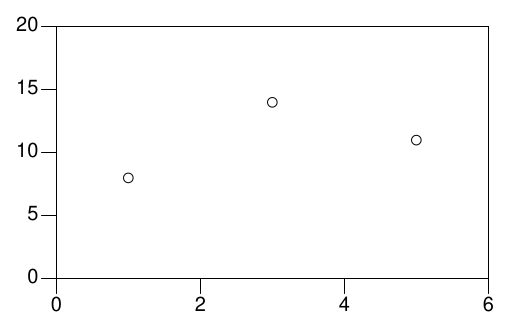
Read a small number list

A numeric list supplies x and y values without repeating next. Use it for a short complete dataset that belongs with the source.

Back to diagram overview

Compare with GRA-01-004 · Name the axes and units.

Complete grap source

.so config/render.roff
.G1
frame ht 2.1 wid 3.6
coord x 0,6 y 0,20
draw solid
1 8
3 14
5 11
.G2
ParameterMeaning in this example
Two numeric columnsInterpret each row as one x,y pair.

Render this diagram

tools/render examples/GRA-01-005.grap

Try changing: Add a row 6 13.

Actual output

Read a small number list
GRA-01-005 · grap native output

grap · exit 0

Native compiler log

Standard output

GRA-01-005: native PDF, SVG and PNG rendered with GNU pic / groff 1.25.0; grap 1.49

Download: Source · Source + configuration ZIP · SVG · Native PDF · PNG

GRA-01-006

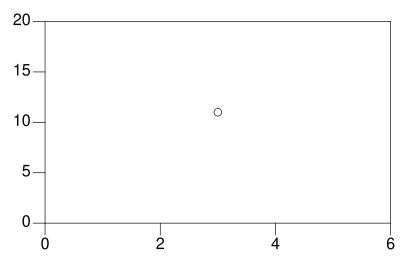
Plot a numeric label

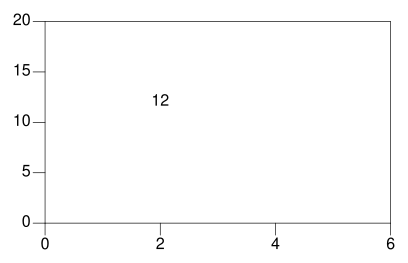
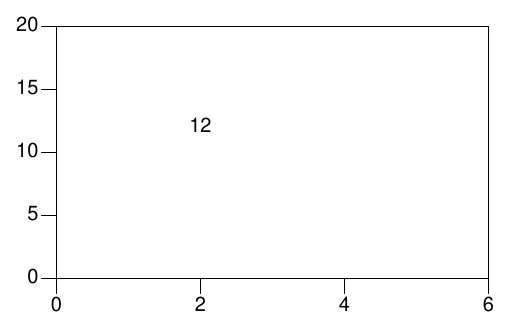
Plot formats a supplied value at a chosen coordinate. Use it when the number itself communicates more than an unlabeled marker.

Back to diagram overview

Compare with GRA-01-005 · Read a small number list.

Complete grap source

.so config/render.roff
.G1
frame ht 2.1 wid 3.6
coord x 0,6 y 0,20
plot 12 at 2,12
.G2
ParameterMeaning in this example
plot VALUE atPrint the value at the supplied data coordinate.

Render this diagram

tools/render examples/GRA-01-006.grap

Try changing: Change the value and its vertical coordinate to 15.

Actual output

Plot a numeric label
GRA-01-006 · grap native output

grap · exit 0

Native compiler log

Standard output

GRA-01-006: native PDF, SVG and PNG rendered with GNU pic / groff 1.25.0; grap 1.49

Download: Source · Source + configuration ZIP · SVG · Native PDF · PNG

02 · Coordinates and ranges

Choose the domain before interpreting slopes, distances or relative heights.

GRA-02-001

Let the data set the range

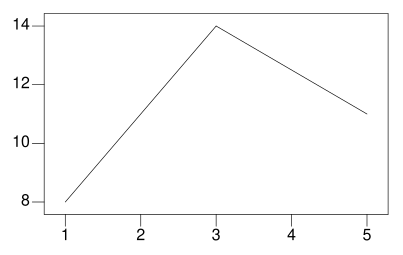
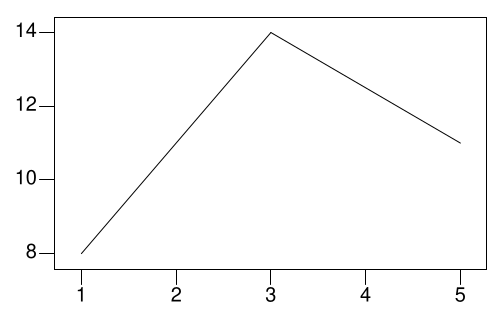
Without coord, grap derives a range from the supplied points. Use automatic limits for exploration, then fix them before comparing panels.

Back to diagram overview

Compare with GRA-01-002 · Connect successive readings.

Complete grap source

.so config/render.roff
.G1
frame ht 2.1 wid 3.6
draw solid
1 8
3 14
5 11
.G2
ParameterMeaning in this example
No coord statementAllow the plotted values to determine the range.

Render this diagram

tools/render examples/GRA-02-001.grap

Try changing: Add a point at 8,18 and inspect the new limits.

Actual output

Let the data set the range
GRA-02-001 · grap native output

grap · exit 0

Native compiler log

Standard output

GRA-02-001: native PDF, SVG and PNG rendered with GNU pic / groff 1.25.0; grap 1.49

Download: Source · Source + configuration ZIP · SVG · Native PDF · PNG

GRA-02-002

Retain a zero baseline

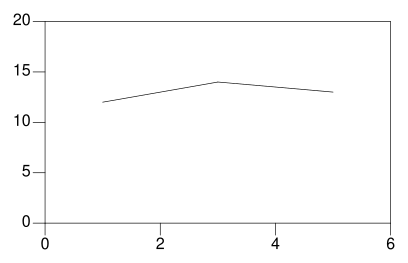
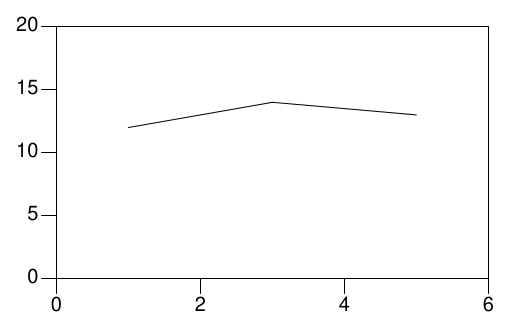
A zero baseline keeps bar or height comparisons proportional. Use explicit limits to avoid exaggerating a narrow variation.

Back to diagram overview

Compare with GRA-02-001 · Let the data set the range.

Complete grap source

.so config/render.roff
.G1
frame ht 2.1 wid 3.6
coord x 0,6 y 0,20
draw solid
1 12
3 14
5 13
.G2
ParameterMeaning in this example
y 0,20Keep zero visible below the readings.

Render this diagram

tools/render examples/GRA-02-002.grap

Try changing: Compare with y 10,16.

Actual output

Retain a zero baseline
GRA-02-002 · grap native output

grap · exit 0

Native compiler log

Standard output

GRA-02-002: native PDF, SVG and PNG rendered with GNU pic / groff 1.25.0; grap 1.49

Download: Source · Source + configuration ZIP · SVG · Native PDF · PNG

GRA-02-003

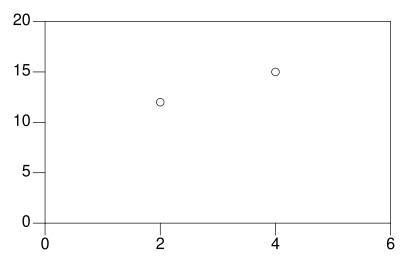
Name another coordinate system

A named system can express the same frame in different units. Use it when a second set of values needs a known linear conversion.

Back to diagram overview

Compare with GRA-02-002 · Retain a zero baseline.

Complete grap source

.so config/render.roff
.G1
frame ht 2.1 wid 3.6
coord x 0,6 y 0,20
coord pct x 0,6 y 0,100
circle at 2,12 radius .04
circle at pct 4,75 radius .04
.G2
ParameterMeaning in this example
coord pctCreate a second named mapping within the frame.
at pctInterpret this point using that mapping.

Render this diagram

tools/render examples/GRA-02-003.grap

Try changing: Change the percentage reading to 50.

Actual output

Name another coordinate system
GRA-02-003 · grap native output

grap · exit 0

Native compiler log

Standard output

GRA-02-003: native PDF, SVG and PNG rendered with GNU pic / groff 1.25.0; grap 1.49

Download: Source · Source + configuration ZIP · SVG · Native PDF · PNG

GRA-02-004

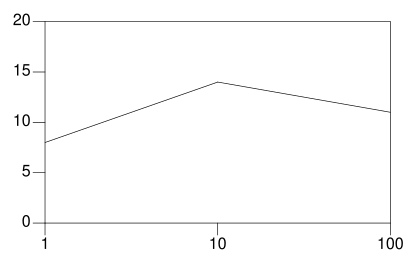
Use a logarithmic horizontal axis

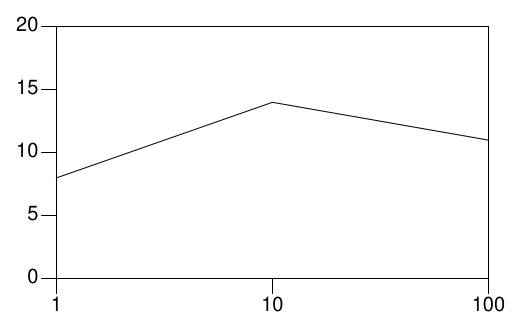
A log axis gives equal distance to equal ratios. Use strictly positive values when the time or concentration domain spans orders of magnitude.

Back to diagram overview

Compare with GRA-02-003 · Name another coordinate system.

Complete grap source

.so config/render.roff
.G1
frame ht 2.1 wid 3.6
coord x 1,100 y 0,20
coord log x
draw solid
1 8
10 14
100 11
.G2
ParameterMeaning in this example
log xMap the horizontal data logarithmically.

Render this diagram

tools/render examples/GRA-02-004.grap

Try changing: Add a reading at 30,16.

Actual output

Use a logarithmic horizontal axis
GRA-02-004 · grap native output

grap · exit 0

Native compiler log

Standard output

GRA-02-004: native PDF, SVG and PNG rendered with GNU pic / groff 1.25.0; grap 1.49

Download: Source · Source + configuration ZIP · SVG · Native PDF · PNG

GRA-02-005

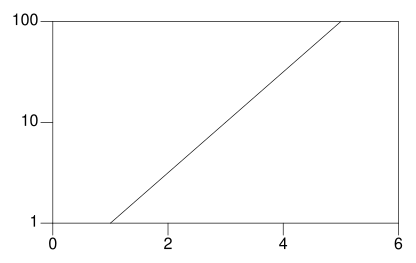
Use a logarithmic value axis

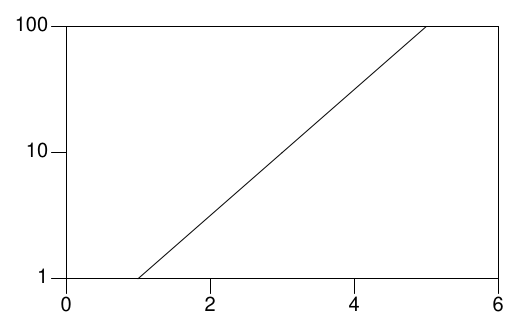
A logarithmic value scale can reveal multiplicative growth. Keep zero out of the domain and state that equal vertical distances represent equal ratios.

Back to diagram overview

Compare with GRA-02-004 · Use a logarithmic horizontal axis.

Complete grap source

.so config/render.roff
.G1
frame ht 2.1 wid 3.6
coord x 0,6 y 1,100
coord log y
draw solid
1 1
3 10
5 100
.G2
ParameterMeaning in this example
log yMap positive vertical values logarithmically.

Render this diagram

tools/render examples/GRA-02-005.grap

Try changing: Change the middle value to 20.

Actual output

Use a logarithmic value axis
GRA-02-005 · grap native output

grap · exit 0

Native compiler log

Standard output

GRA-02-005: native PDF, SVG and PNG rendered with GNU pic / groff 1.25.0; grap 1.49

Download: Source · Source + configuration ZIP · SVG · Native PDF · PNG

GRA-02-006

Convert the values before drawing

A numeric expression can change units without changing the source observations. Use a visible conversion so the axis label and plotted values agree.

Back to diagram overview

Compare with GRA-02-005 · Use a logarithmic value axis.

Complete grap source

.so config/render.roff
.G1
frame ht 2.1 wid 3.6
coord x 0,6 y 0,20
label left "Temperature (C)" left .35
next at 1,(50-32)*5/9
next at 3,(59-32)*5/9
next at 5,(68-32)*5/9
.G2
ParameterMeaning in this example
(F-32)*5/9Convert each supplied Fahrenheit reading to Celsius.

Render this diagram

tools/render examples/GRA-02-006.grap

Try changing: Add a Fahrenheit value of 77 at day 6.

Actual output

Convert the values before drawing
GRA-02-006 · grap native output

grap · exit 0

Native compiler log

Standard output

GRA-02-006: native PDF, SVG and PNG rendered with GNU pic / groff 1.25.0; grap 1.49

Download: Source · Source + configuration ZIP · SVG · Native PDF · PNG

03 · Axes, ticks and grids

Use ticks for reading values and restrained grids for comparison.

GRA-03-001

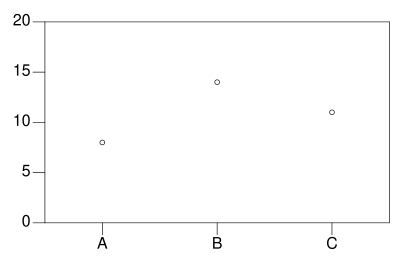
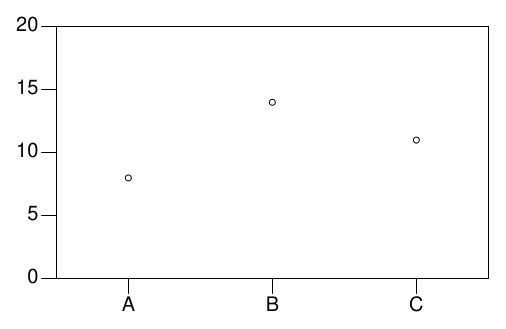
Name categorical tick positions

Tick strings can explain numeric category positions. Use them for named intake batches instead of displaying arbitrary category codes.

Back to diagram overview

Compare with GRA-01-003 · Choose the axis ticks.

Complete grap source

.so config/render.roff
.G1
frame ht 2.1 wid 3.6
coord x 0,6 y 0,20
ticks bottom at 1 "A",3 "B",5 "C"
circle at 1,8
circle at 3,14
circle at 5,11
.G2
ParameterMeaning in this example
Tick stringReplace a numeric tick label with its supplied category name.

Render this diagram

tools/render examples/GRA-03-001.grap

Try changing: Rename A, B and C to North, East and West.

Actual output

Name categorical tick positions
GRA-03-001 · grap native output

grap · exit 0

Native compiler log

Standard output

GRA-03-001: native PDF, SVG and PNG rendered with GNU pic / groff 1.25.0; grap 1.49

Download: Source · Source + configuration ZIP · SVG · Native PDF · PNG

GRA-03-002

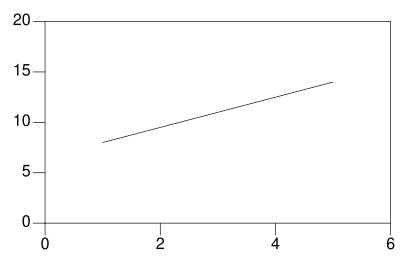
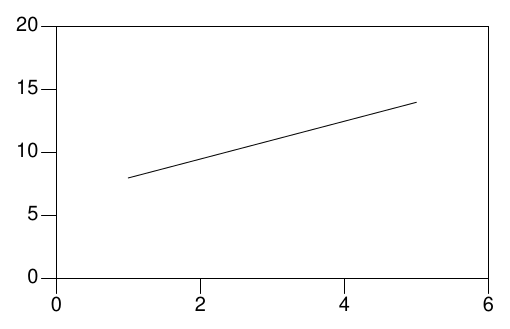
Generate regularly spaced ticks

A from/to range avoids listing regular ticks individually. Use a visible interval that matches the precision readers need.

Back to diagram overview

Compare with GRA-03-001 · Name categorical tick positions.

Complete grap source

.so config/render.roff
.G1
frame ht 2.1 wid 3.6
coord x 0,6 y 0,20
ticks left from 0 to 20 by 5
line from 1,8 to 5,14
.G2
ParameterMeaning in this example
from / to / byGenerate ticks over a fixed interval.

Render this diagram

tools/render examples/GRA-03-002.grap

Try changing: Change the interval to 4.

Actual output

Generate regularly spaced ticks
GRA-03-002 · grap native output

grap · exit 0

Native compiler log

Standard output

GRA-03-002: native PDF, SVG and PNG rendered with GNU pic / groff 1.25.0; grap 1.49

Download: Source · Source + configuration ZIP · SVG · Native PDF · PNG

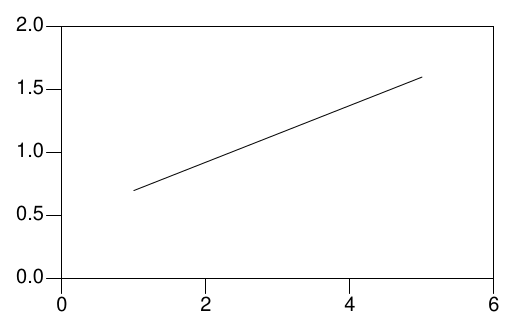
GRA-03-003

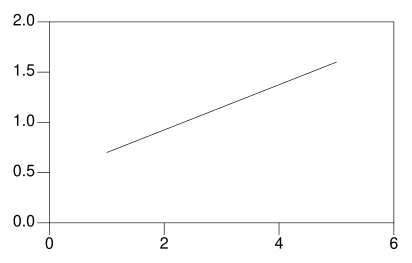
Format tick precision

A format string controls displayed precision. Use one decimal place when the measurement scale carries tenths rather than whole counts.

Back to diagram overview

Compare with GRA-03-002 · Generate regularly spaced ticks.

Complete grap source

.so config/render.roff
.G1
frame ht 2.1 wid 3.6
coord x 0,6 y 0,2
ticks left from 0 to 2 by .5 "%.1f"
line from 1,.7 to 5,1.6
.G2
ParameterMeaning in this example
"%.1f"Print the tick value with one decimal place.

Render this diagram

tools/render examples/GRA-03-003.grap

Try changing: Change the format to %.2f.

Actual output

Format tick precision
GRA-03-003 · grap native output

grap · exit 0

Native compiler log

Standard output

GRA-03-003: native PDF, SVG and PNG rendered with GNU pic / groff 1.25.0; grap 1.49

Download: Source · Source + configuration ZIP · SVG · Native PDF · PNG

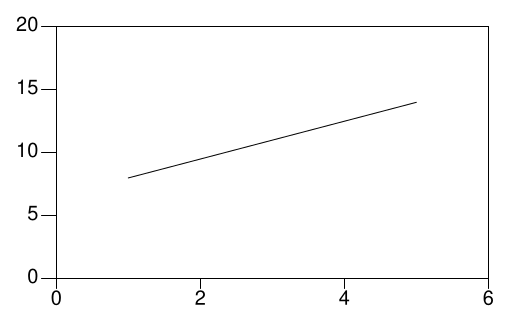
GRA-03-004

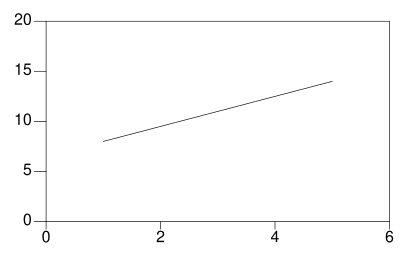
Turn ticks outward

Outward ticks leave the interior clearer. Use an explicit physical tick length when preparing a small printed chart.

Back to diagram overview

Compare with GRA-03-003 · Format tick precision.

Complete grap source

.so config/render.roff
.G1
frame ht 2.1 wid 3.6
coord x 0,6 y 0,20
ticks bottom out .08 from 0 to 6 by 2
line from 1,8 to 5,14
.G2
ParameterMeaning in this example
out .08Draw ticks 0.08 inches outside the frame.

Render this diagram

tools/render examples/GRA-03-004.grap

Try changing: Reduce the length to .04.

Actual output

Turn ticks outward
GRA-03-004 · grap native output

grap · exit 0

Native compiler log

Standard output

GRA-03-004: native PDF, SVG and PNG rendered with GNU pic / groff 1.25.0; grap 1.49

Download: Source · Source + configuration ZIP · SVG · Native PDF · PNG

GRA-03-005

Add a light reading grid

Grid lines provide horizontal reference across the plot. Use a dotted style and omit duplicate grid labels when ticks already identify the values.

Back to diagram overview

Compare with GRA-03-004 · Turn ticks outward.

Complete grap source

.so config/render.roff
.G1
frame ht 2.1 wid 3.6
coord x 0,6 y 0,20
grid left dotted from 0 to 20 by 5 ""
line from 1,8 to 5,14
.G2
ParameterMeaning in this example
grid leftExtend references horizontally from the left axis.
""Omit labels on the grid lines.

Render this diagram

tools/render examples/GRA-03-005.grap

Try changing: Change the grid interval to 10.

Actual output

Add a light reading grid
GRA-03-005 · grap native output

grap · exit 0

Native compiler log

Standard output

GRA-03-005: native PDF, SVG and PNG rendered with GNU pic / groff 1.25.0; grap 1.49

Download: Source · Source + configuration ZIP · SVG · Native PDF · PNG

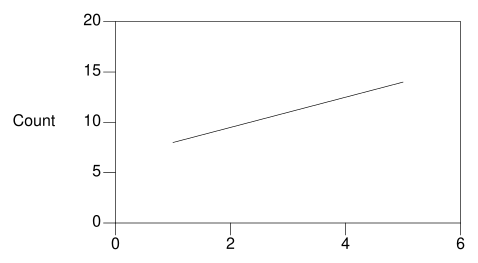
GRA-03-006

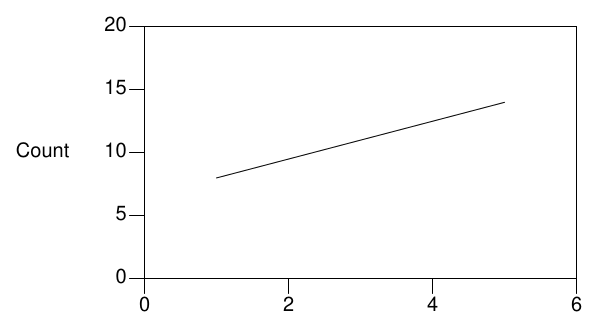
Align the value label horizontally

An unaligned side label stays horizontal. Use it when a short unit caption reads better beside a small chart than as rotated text.

Back to diagram overview

Compare with GRA-03-005 · Add a light reading grid.

Complete grap source

.so config/render.roff
.G1
frame ht 2.1 wid 3.6
coord x 0,6 y 0,20
label left "Count" unaligned left .45
line from 1,8 to 5,14
.G2
ParameterMeaning in this example
unalignedKeep the side label horizontal.

Render this diagram

tools/render examples/GRA-03-006.grap

Try changing: Replace Count with Samples.

Actual output

Align the value label horizontally
GRA-03-006 · grap native output

grap · exit 0

Native compiler log

Standard output

GRA-03-006: native PDF, SVG and PNG rendered with GNU pic / groff 1.25.0; grap 1.49

Download: Source · Source + configuration ZIP · SVG · Native PDF · PNG

04 · Lines, markers and series

Distinguish series with labels and line styles as well as color.

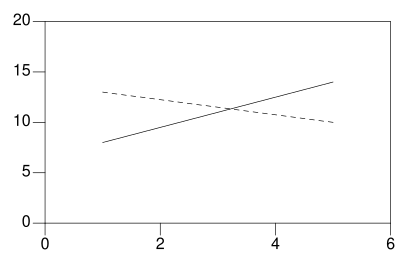
GRA-04-001

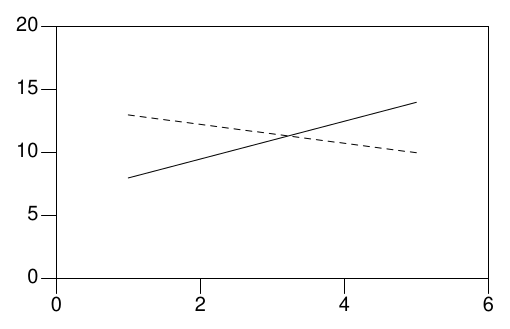
Name independent series

Named drawing streams prevent one series from connecting to another. Use a separate next sequence for each field station.

Back to diagram overview

Compare with GRA-01-002 · Connect successive readings.

Complete grap source

.so config/render.roff
.G1
frame ht 2.1 wid 3.6
coord x 0,6 y 0,20
draw North solid
draw South dashed
next North at 1,8
next South at 1,13
next North at 5,14
next South at 5,10
.G2
ParameterMeaning in this example
draw NAMEDefine an independent sequence of connected points.

Render this diagram

tools/render examples/GRA-04-001.grap

Try changing: Change the South endpoint to 16.

Actual output

Name independent series
GRA-04-001 · grap native output

grap · exit 0

Native compiler log

Standard output

GRA-04-001: native PDF, SVG and PNG rendered with GNU pic / groff 1.25.0; grap 1.49

Download: Source · Source + configuration ZIP · SVG · Native PDF · PNG

GRA-04-002

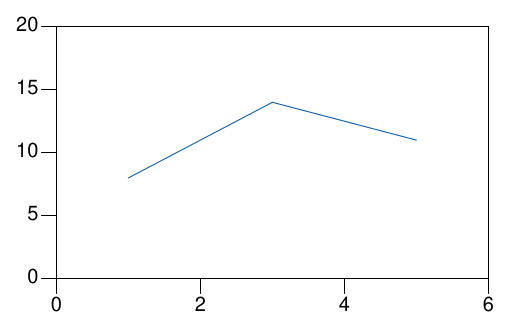
Set a line color

Color can reinforce a series identity. Use a named local color while keeping the line shape and labels intelligible in monochrome.

Back to diagram overview

Compare with GRA-04-001 · Name independent series.

Complete grap source

.so config/render.roff
.G1
frame ht 2.1 wid 3.6
coord x 0,6 y 0,20
draw solid color "blue"
1 8
3 14
5 11
.G2
ParameterMeaning in this example
colorSelect the color of the line stroke.

Render this diagram

tools/render examples/GRA-04-002.grap

Try changing: Change blue to orange.

Actual output

Set a line color
GRA-04-002 · grap native output

grap · exit 0

Native compiler log

Standard output

GRA-04-002: native PDF, SVG and PNG rendered with GNU pic / groff 1.25.0; grap 1.49

Download: Source · Source + configuration ZIP · SVG · Native PDF · PNG

GRA-04-003

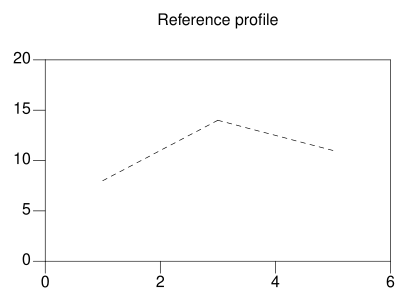
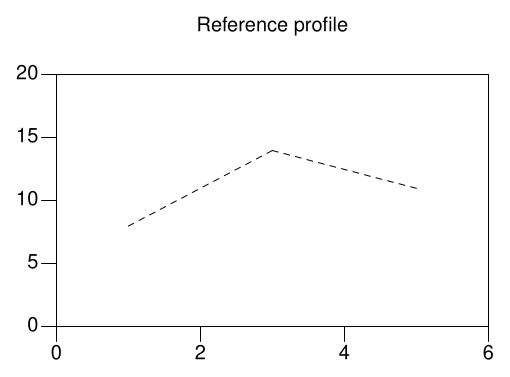
Use a dashed comparison

A dashed line distinguishes a supplied reference from ordinary observations. Use it for a target profile rather than another unlabeled measurement stream.

Back to diagram overview

Compare with GRA-04-002 · Set a line color.

Complete grap source

.so config/render.roff
.G1
frame ht 2.1 wid 3.6
coord x 0,6 y 0,20
draw dashed
label top "Reference profile"
1 8
3 14
5 11
.G2
ParameterMeaning in this example
dashedDraw the same values with a broken stroke.

Render this diagram

tools/render examples/GRA-04-003.grap

Try changing: Change dashed to dotted.

Actual output

Use a dashed comparison
GRA-04-003 · grap native output

grap · exit 0

Native compiler log

Standard output

GRA-04-003: native PDF, SVG and PNG rendered with GNU pic / groff 1.25.0; grap 1.49

Download: Source · Source + configuration ZIP · SVG · Native PDF · PNG

GRA-04-004

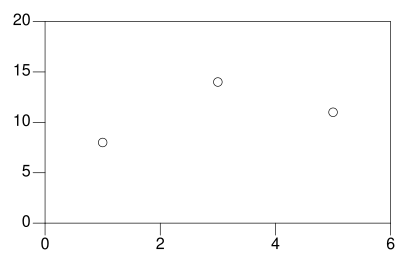
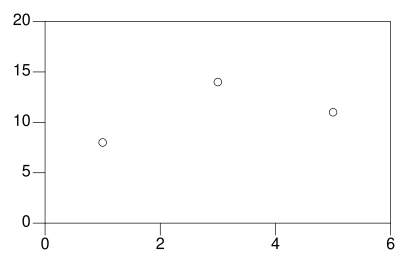
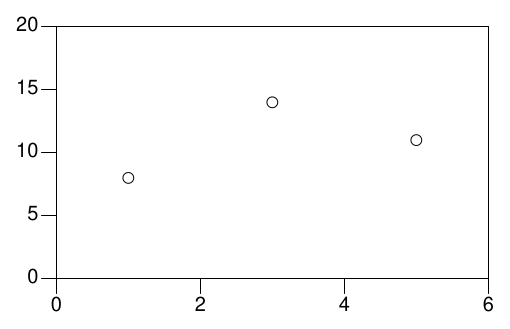
Draw separate markers

Individual circles avoid implying interpolation. Use them when samples have independent positions rather than an ordered connecting path.

Back to diagram overview

Compare with GRA-04-003 · Use a dashed comparison.

Complete grap source

.so config/render.roff
.G1
frame ht 2.1 wid 3.6
coord x 0,6 y 0,20
circle at 1,8 radius .045
circle at 3,14 radius .045
circle at 5,11 radius .045
.G2
ParameterMeaning in this example
radiusSet marker radius in physical inches.

Render this diagram

tools/render examples/GRA-04-004.grap

Try changing: Increase the marker radius to .06.

Actual output

Draw separate markers
GRA-04-004 · grap native output

grap · exit 0

Native compiler log

Standard output

GRA-04-004: native PDF, SVG and PNG rendered with GNU pic / groff 1.25.0; grap 1.49

Download: Source · Source + configuration ZIP · SVG · Native PDF · PNG

GRA-04-005

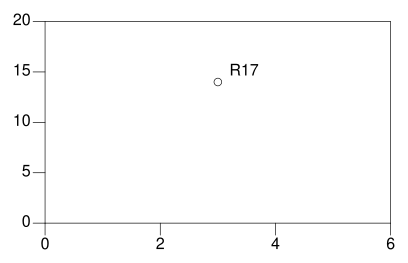
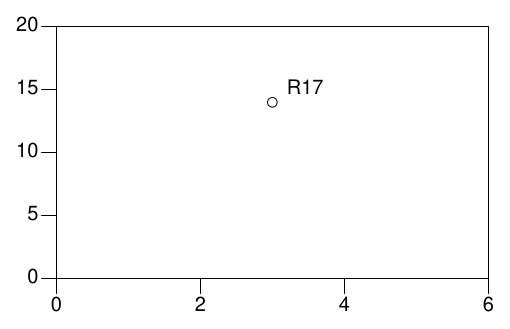
Label one selected reading

An offset text label can identify an observation without covering it. Use a short name and keep the underlying point visible.

Back to diagram overview

Compare with GRA-04-004 · Draw separate markers.

Complete grap source

.so config/render.roff
.G1
frame ht 2.1 wid 3.6
coord x 0,6 y 0,20
circle at 3,14 radius .04
"R17" ljust at 3.2,15
.G2
ParameterMeaning in this example
ljustAnchor the label at its left edge.

Render this diagram

tools/render examples/GRA-04-005.grap

Try changing: Rename R17 and move the label higher.

Actual output

Label one selected reading
GRA-04-005 · grap native output

grap · exit 0

Native compiler log

Standard output

GRA-04-005: native PDF, SVG and PNG rendered with GNU pic / groff 1.25.0; grap 1.49

Download: Source · Source + configuration ZIP · SVG · Native PDF · PNG

GRA-04-006

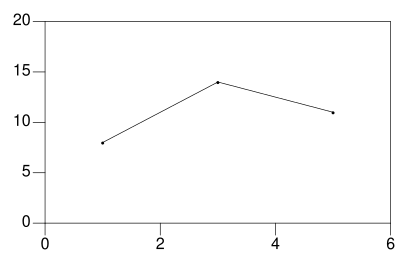
Add markers to a line

A plot string can mark every point on a connected sequence. Use this when individual sampling positions matter alongside the trend.

Back to diagram overview

Compare with GRA-04-005 · Label one selected reading.

Complete grap source

.so config/render.roff
.G1
frame ht 2.1 wid 3.6
coord x 0,6 y 0,20
draw solid bullet
1 8
3 14
5 11
.G2
ParameterMeaning in this example
bulletUse the bundled marker macro at every observation.

Render this diagram

tools/render examples/GRA-04-006.grap

Try changing: Change bullet to plus.

Actual output

Add markers to a line
GRA-04-006 · grap native output

grap · exit 0

Native compiler log

Standard output

GRA-04-006: native PDF, SVG and PNG rendered with GNU pic / groff 1.25.0; grap 1.49

Download: Source · Source + configuration ZIP · SVG · Native PDF · PNG

05 · Local data and expressions

Keep inputs close to the complete source and make transformations visible.

GRA-05-001

Read the local measurement table

Copy imports a bundled numeric table. Use it when the same observations belong in several charts without manually retyping them.

Back to diagram overview

Compare with GRA-01-005 · Read a small number list.

Complete grap source

.so config/render.roff
.G1
frame ht 2.1 wid 3.6
coord x 0,6 y 0,20
draw solid
copy "data/readings.txt"
.G2
ParameterMeaning in this example
copy "data/readings.txt"Read the bundled two-column input file.

Render this diagram

tools/render examples/GRA-05-001.grap

Try changing: Change the last value in the local table.

Actual output

Read the local measurement table
GRA-05-001 · grap native output

grap · exit 0

Native compiler log

Standard output

GRA-05-001: native PDF, SVG and PNG rendered with GNU pic / groff 1.25.0; grap 1.49

Download: Source · Source + configuration ZIP · SVG · Native PDF · PNG

GRA-05-002

Transform columns while reading

A thru body receives the fields of each input row. Use it to calculate an accepted count from total and rejected counts.

Back to diagram overview

Compare with GRA-05-001 · Read the local measurement table.

Complete grap source

.so config/render.roff
.G1
frame ht 2.1 wid 3.6
coord x 0,6 y 0,20
draw solid
copy "data/batches.txt" thru { next at $1,$2-$3; }
.G2
ParameterMeaning in this example
$1 / $2 / $3Refer to day, total and rejected fields.
thruApply the same drawing statement to every row.

Render this diagram

tools/render examples/GRA-05-002.grap

Try changing: Plot $3 instead to show rejected counts.

Actual output

Transform columns while reading
GRA-05-002 · grap native output

grap · exit 0

Native compiler log

Standard output

GRA-05-002: native PDF, SVG and PNG rendered with GNU pic / groff 1.25.0; grap 1.49

Download: Source · Source + configuration ZIP · SVG · Native PDF · PNG

GRA-05-003

Filter flagged observations

A condition inside thru can omit an invalid observation. Use an explicit flag and explain that filtering changes the plotted population.

Back to diagram overview

Compare with GRA-05-002 · Transform columns while reading.

Complete grap source

.so config/render.roff
.G1
frame ht 2.1 wid 3.6
coord x 0,6 y 0,20
copy "data/batches.txt" thru { if $4==1 then { circle at $1,$2 radius .04; }; }
.G2
ParameterMeaning in this example
$4==1Keep only rows whose supplied valid flag is one.

Render this diagram

tools/render examples/GRA-05-003.grap

Try changing: Change one valid flag from 1 to 0.

Actual output

Filter flagged observations
GRA-05-003 · grap native output

grap · exit 0

Native compiler log

Standard output

GRA-05-003: native PDF, SVG and PNG rendered with GNU pic / groff 1.25.0; grap 1.49

Download: Source · Source + configuration ZIP · SVG · Native PDF · PNG

GRA-05-004

Embed data for a standalone snippet

Copy until keeps a short dataset inside the source file. Use it when a small drawing should travel without a separate data file.

Back to diagram overview

Compare with GRA-05-003 · Filter flagged observations.

Complete grap source

.so config/render.roff
.G1
frame ht 2.1 wid 3.6
coord x 0,6 y 0,20
draw solid
copy until "END" thru { next at $1,$2; }
1 8
3 14
5 11
END
.G2
ParameterMeaning in this example
until "END"Read rows until the explicit terminator.

Render this diagram

tools/render examples/GRA-05-004.grap

Try changing: Add a new data row before END.

Actual output

Embed data for a standalone snippet
GRA-05-004 · grap native output

grap · exit 0

Native compiler log

Standard output

GRA-05-004: native PDF, SVG and PNG rendered with GNU pic / groff 1.25.0; grap 1.49

Download: Source · Source + configuration ZIP · SVG · Native PDF · PNG

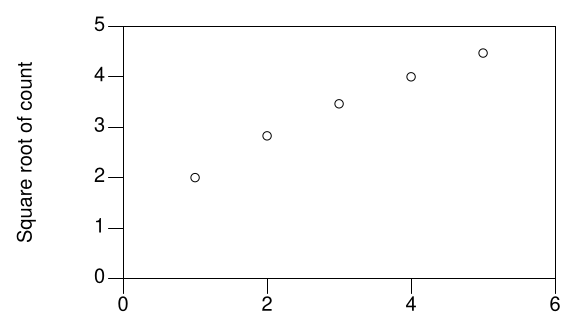
GRA-05-005

Calculate a transformed reading

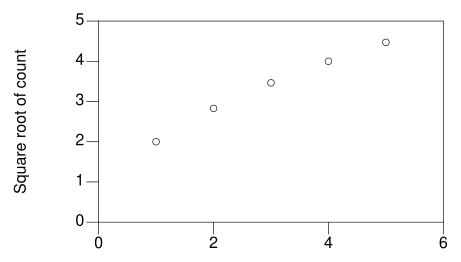
A square root makes a transformation visible in the plotting statement. Use it only when that transformation has a defined analytical purpose.

Back to diagram overview

Compare with GRA-05-004 · Embed data for a standalone snippet.

Complete grap source

.so config/render.roff
.G1
frame ht 2.1 wid 3.6
coord x 0,6 y 0,5
label left "Square root of count" left .4
for d from 1 to 5 do { circle at d,sqrt(d*4) radius .035; }
.G2
ParameterMeaning in this example
sqrtTransform the supplied count before placing the point.

Render this diagram

tools/render examples/GRA-05-005.grap

Try changing: Replace the square root with the raw d*4 count and change the axis range.

Actual output

Calculate a transformed reading
GRA-05-005 · grap native output

grap · exit 0

Native compiler log

Standard output

GRA-05-005: native PDF, SVG and PNG rendered with GNU pic / groff 1.25.0; grap 1.49

Download: Source · Source + configuration ZIP · SVG · Native PDF · PNG

GRA-05-006

Print a checked intermediate value

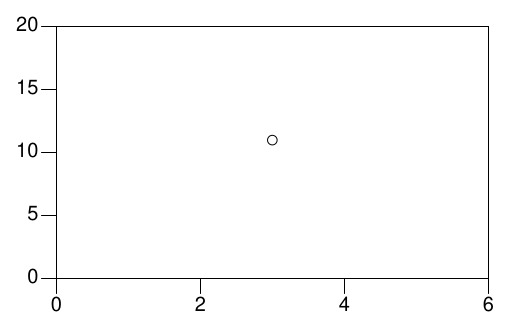
Print records a calculated value in the native diagnostics. Use it while checking a transformation, with the same expression supplying the visible point.

Back to diagram overview

Compare with GRA-05-005 · Calculate a transformed reading.

Complete grap source

.so config/render.roff
.G1
frame ht 2.1 wid 3.6
coord x 0,6 y 0,20
value=14-3
print value
circle at 3,value radius .04
.G2
ParameterMeaning in this example
printWrite the checked intermediate result to the native log.

Render this diagram

tools/render examples/GRA-05-006.grap

Try changing: Change the rejected count from 3 to 5.

Actual output

Print a checked intermediate value
GRA-05-006 · grap native output

grap · exit 0

Native compiler log

Standard output

GRA-05-006: native PDF, SVG and PNG rendered with GNU pic / groff 1.25.0; grap 1.49

Standard error

11

Download: Source · Source + configuration ZIP · SVG · Native PDF · PNG

06 · Bars and prepared distributions

Make bar baselines and distribution definitions explicit before adjusting their appearance.

GRA-06-001

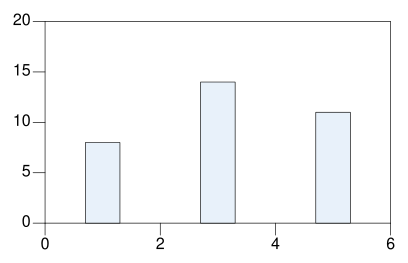
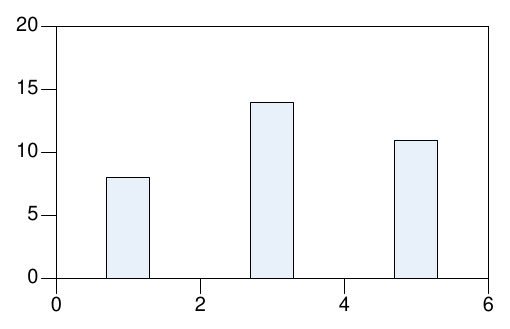
Draw vertical counts

A vertical bar starts at zero and represents a supplied count. Use the width to separate categorical values clearly.

Back to diagram overview

Compare with GRA-01-005 · Read a small number list.

Complete grap source

.so config/render.roff
.G1
frame ht 2.1 wid 3.6
coord x 0,6 y 0,20
bar up 1 ht 8 wid .6 fillcolor "wash"
bar up 3 ht 14 wid .6 fillcolor "wash"
bar up 5 ht 11 wid .6 fillcolor "wash"
.G2
ParameterMeaning in this example
bar upExtend a bar upwards from its baseline.
wid .6Use a width of 0.6 data units.

Render this diagram

tools/render examples/GRA-06-001.grap

Try changing: Increase all bar widths to .9.

Actual output

Draw vertical counts
GRA-06-001 · grap native output

grap · exit 0

Native compiler log

Standard output

GRA-06-001: native PDF, SVG and PNG rendered with GNU pic / groff 1.25.0; grap 1.49

Download: Source · Source + configuration ZIP · SVG · Native PDF · PNG

GRA-06-002

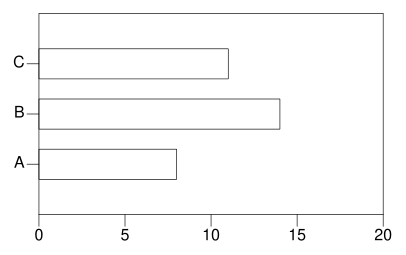
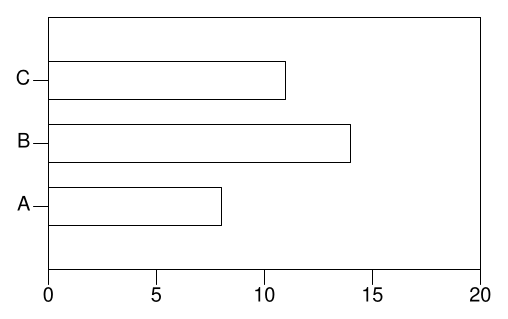
Draw horizontal counts

A rightward bar exchanges the roles of category position and value. Use it when category names need more horizontal room.

Back to diagram overview

Compare with GRA-06-001 · Draw vertical counts.

Complete grap source

.so config/render.roff
.G1
frame ht 2.1 wid 3.6
coord x 0,20 y 0,4
ticks left at 1 "A",2 "B",3 "C"
bar right 1 ht 8 wid .6
bar right 2 ht 14 wid .6
bar right 3 ht 11 wid .6
.G2
ParameterMeaning in this example
bar rightExtend a bar horizontally from zero.

Render this diagram

tools/render examples/GRA-06-002.grap

Try changing: Rename the categories to field station names.

Actual output

Draw horizontal counts
GRA-06-002 · grap native output

grap · exit 0

Native compiler log

Standard output

GRA-06-002: native PDF, SVG and PNG rendered with GNU pic / groff 1.25.0; grap 1.49

Download: Source · Source + configuration ZIP · SVG · Native PDF · PNG

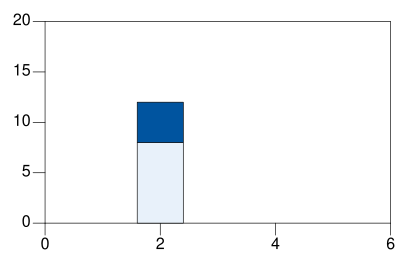
GRA-06-003

Stack a known component

A base offset places one component above another. Use it when the supplied components sum to a meaningful total.

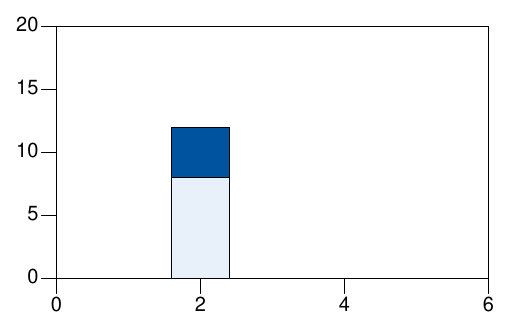
Back to diagram overview

Compare with GRA-06-002 · Draw horizontal counts.

Complete grap source

.so config/render.roff
.G1
frame ht 2.1 wid 3.6
coord x 0,6 y 0,20
bar up 2 ht 8 wid .8 fillcolor "wash"
bar up 2 ht 4 base 8 wid .8 fillcolor "blue"
.G2
ParameterMeaning in this example
base 8Start the second bar at the first component's top.

Render this diagram

tools/render examples/GRA-06-003.grap

Try changing: Change the second component to 6.

Actual output

Stack a known component
GRA-06-003 · grap native output

grap · exit 0

Native compiler log

Standard output

GRA-06-003: native PDF, SVG and PNG rendered with GNU pic / groff 1.25.0; grap 1.49

Download: Source · Source + configuration ZIP · SVG · Native PDF · PNG

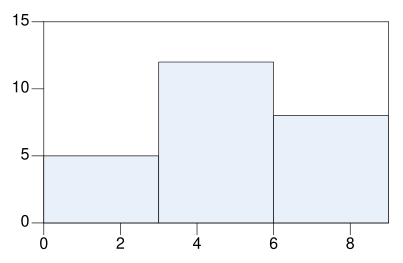
GRA-06-004

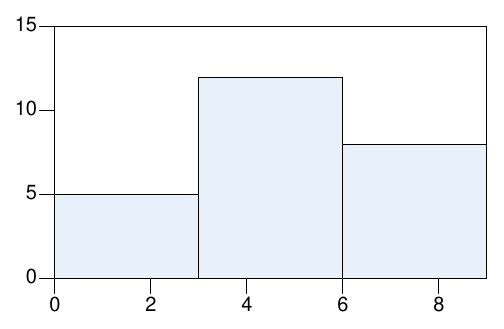
Draw prepared histogram bins

A histogram can use explicitly supplied bins and counts. Keep the widths identical and state that grap is drawing a prepared distribution rather than estimating bins.

Back to diagram overview

Compare with GRA-06-003 · Stack a known component.

Complete grap source

.so config/render.roff
.G1
frame ht 2.1 wid 3.6
coord x 0,9 y 0,15
bar up 1.5 ht 5 wid 3 fillcolor "wash"
bar up 4.5 ht 12 wid 3 fillcolor "wash"
bar up 7.5 ht 8 wid 3 fillcolor "wash"
.G2
ParameterMeaning in this example
wid 3Represent the supplied three-unit histogram bins.

Render this diagram

tools/render examples/GRA-06-004.grap

Try changing: Change the middle count to 10.

Actual output

Draw prepared histogram bins
GRA-06-004 · grap native output

grap · exit 0

Native compiler log

Standard output

GRA-06-004: native PDF, SVG and PNG rendered with GNU pic / groff 1.25.0; grap 1.49

Download: Source · Source + configuration ZIP · SVG · Native PDF · PNG

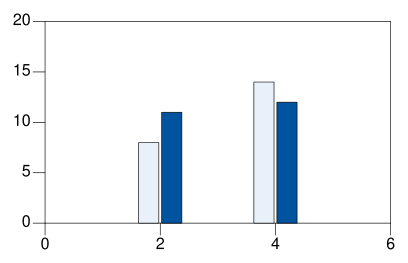
GRA-06-005

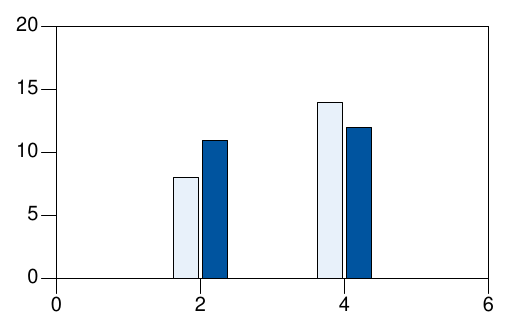
Offset grouped bars

Small x offsets keep two counts separate within one category. Use a fixed offset and width so every pair is directly comparable.

Back to diagram overview

Compare with GRA-06-004 · Draw prepared histogram bins.

Complete grap source

.so config/render.roff
.G1
frame ht 2.1 wid 3.6
coord x 0,6 y 0,20
bar up 1.8 ht 8 wid .35 fillcolor "wash"
bar up 2.2 ht 11 wid .35 fillcolor "blue"
bar up 3.8 ht 14 wid .35 fillcolor "wash"
bar up 4.2 ht 12 wid .35 fillcolor "blue"
.G2
ParameterMeaning in this example
Offset category positionsPlace paired bars beside the same category center.

Render this diagram

tools/render examples/GRA-06-005.grap

Try changing: Swap the fill colors of the two series.

Actual output

Offset grouped bars
GRA-06-005 · grap native output

grap · exit 0

Native compiler log

Standard output

GRA-06-005: native PDF, SVG and PNG rendered with GNU pic / groff 1.25.0; grap 1.49

Download: Source · Source + configuration ZIP · SVG · Native PDF · PNG

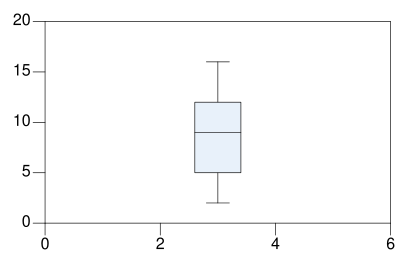
GRA-06-006

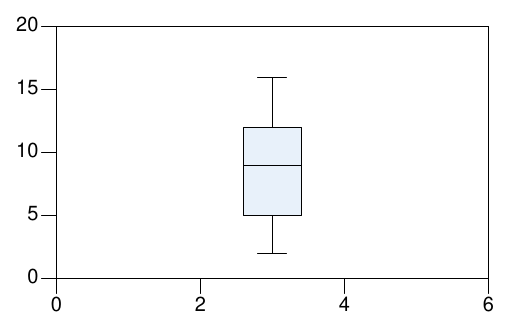
Draw a prepared box summary

A box, median and whiskers can display supplied five-number statistics. Here whiskers are the stated minimum and maximum; grap applies no automatic outlier rule.

Back to diagram overview

Compare with GRA-06-005 · Offset grouped bars.

Complete grap source

.so config/render.roff
.G1
frame ht 2.1 wid 3.6
coord x 0,6 y 0,20
line from 3,2 to 3,16
bar 2.6,5,3.4,12 fillcolor "wash"
line from 2.6,9 to 3.4,9
line from 2.8,2 to 3.2,2
line from 2.8,16 to 3.2,16
.G2
ParameterMeaning in this example
bar corner,cornerDraw the interquartile box from two corners.
Separate median lineDraw the supplied median rather than recomputing it.

Render this diagram

tools/render examples/GRA-06-006.grap

Try changing: Change the median from 9 to 10.

Actual output

Draw a prepared box summary
GRA-06-006 · grap native output

grap · exit 0

Native compiler log

Standard output

GRA-06-006: native PDF, SVG and PNG rendered with GNU pic / groff 1.25.0; grap 1.49

Download: Source · Source + configuration ZIP · SVG · Native PDF · PNG

07 · Scientific annotations

Keep supplied uncertainty, thresholds and derived geometry distinct from the observations.

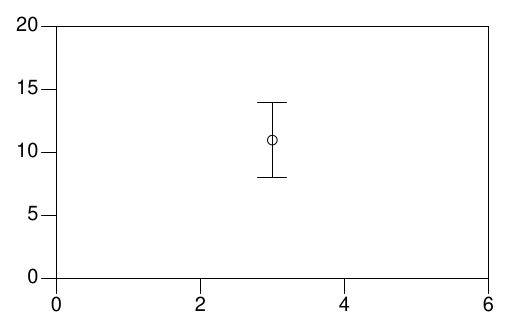
GRA-07-001

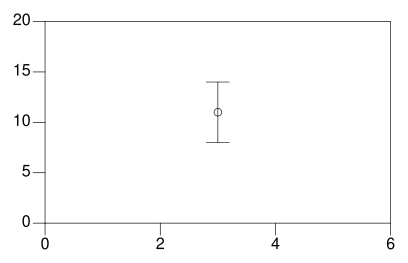
Show a supplied uncertainty interval

A vertical segment and short caps display an interval around a reading. Use the parameter table to state whether the bounds are errors, confidence limits or another supplied range.

Back to diagram overview

Compare with GRA-06-006 · Draw a prepared box summary.

Complete grap source

.so config/render.roff
.G1
frame ht 2.1 wid 3.6
coord x 0,6 y 0,20
line from 3,8 to 3,14
line from 2.8,8 to 3.2,8
line from 2.8,14 to 3.2,14
circle at 3,11 radius .04
.G2
ParameterMeaning in this example
8 to 14Use the supplied lower and upper measurement bounds.

Render this diagram

tools/render examples/GRA-07-001.grap

Try changing: Widen the interval to 7 through 15.

Actual output

Show a supplied uncertainty interval
GRA-07-001 · grap native output

grap · exit 0

Native compiler log

Standard output

GRA-07-001: native PDF, SVG and PNG rendered with GNU pic / groff 1.25.0; grap 1.49

Download: Source · Source + configuration ZIP · SVG · Native PDF · PNG

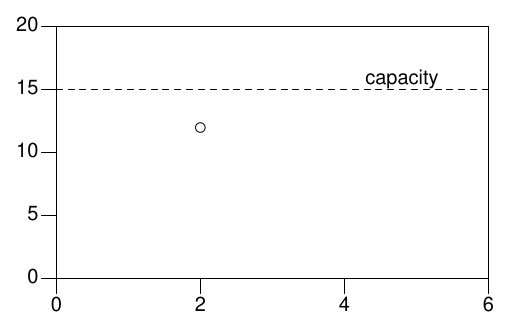
GRA-07-002

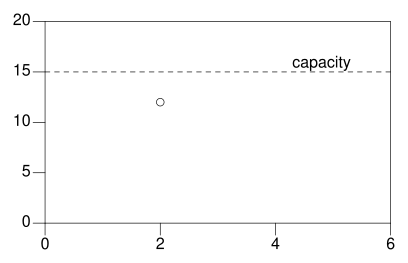
Add a capacity threshold

A horizontal reference line makes a fixed limit visible. Use a label and line style so the threshold remains identifiable without color.

Back to diagram overview

Compare with GRA-07-001 · Show a supplied uncertainty interval.

Complete grap source

.so config/render.roff
.G1
frame ht 2.1 wid 3.6
coord x 0,6 y 0,20
line dashed from 0,15 to 6,15
"capacity" above at 4.8,15
circle at 2,12 radius .04
.G2
ParameterMeaning in this example
line dashedSeparate the supplied threshold from observations.

Render this diagram

tools/render examples/GRA-07-002.grap

Try changing: Move the capacity to 17.

Actual output

Add a capacity threshold
GRA-07-002 · grap native output

grap · exit 0

Native compiler log

Standard output

GRA-07-002: native PDF, SVG and PNG rendered with GNU pic / groff 1.25.0; grap 1.49

Download: Source · Source + configuration ZIP · SVG · Native PDF · PNG

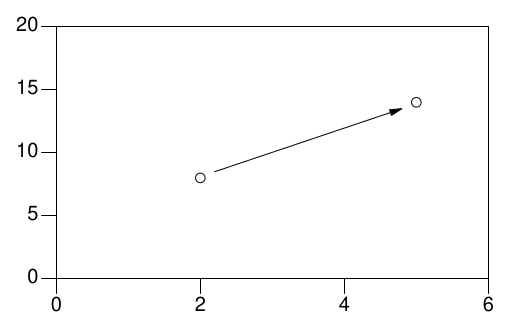
GRA-07-003

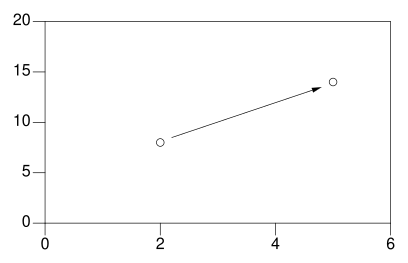
Explain a change with an arrow

A directed annotation can highlight a difference between two positions. Use it to explain the supplied comparison without implying a causal effect.

Back to diagram overview

Compare with GRA-07-002 · Add a capacity threshold.

Complete grap source

.so config/render.roff
.G1
frame ht 2.1 wid 3.6
coord x 0,6 y 0,20
circle at 2,8 radius .04
circle at 5,14 radius .04
arrow from 2.2,8.5 to 4.8,13.5
.G2
ParameterMeaning in this example
arrow from / toPoint from one supplied comparison position to another.

Render this diagram

tools/render examples/GRA-07-003.grap

Try changing: Change the second reading and the arrow endpoint together.

Actual output

Explain a change with an arrow
GRA-07-003 · grap native output

grap · exit 0

Native compiler log

Standard output

GRA-07-003: native PDF, SVG and PNG rendered with GNU pic / groff 1.25.0; grap 1.49

Download: Source · Source + configuration ZIP · SVG · Native PDF · PNG

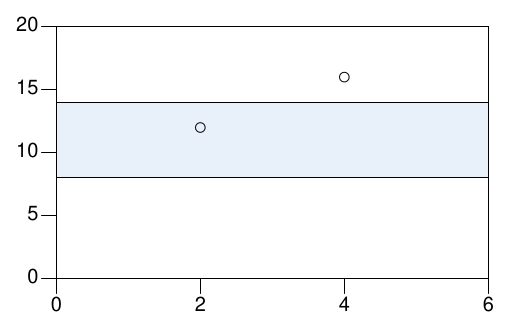
GRA-07-004

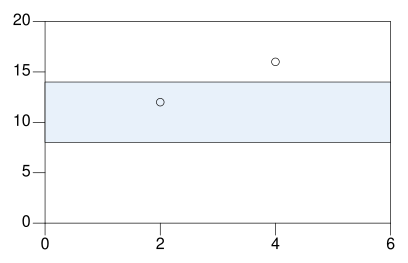
Shade a reference band

A filled rectangle can mark an acceptable range. Draw the band before observations so it does not hide the measured points.

Back to diagram overview

Compare with GRA-07-003 · Explain a change with an arrow.

Complete grap source

.so config/render.roff
.G1
frame ht 2.1 wid 3.6
coord x 0,6 y 0,20
bar 0,8,6,14 fillcolor "wash"
circle at 2,12 radius .04
circle at 4,16 radius .04
.G2
ParameterMeaning in this example
Filled corner rectangleMark the supplied acceptable interval.

Render this diagram

tools/render examples/GRA-07-004.grap

Try changing: Change the acceptable range to 9 through 15.

Actual output

Shade a reference band
GRA-07-004 · grap native output

grap · exit 0

Native compiler log

Standard output

GRA-07-004: native PDF, SVG and PNG rendered with GNU pic / groff 1.25.0; grap 1.49

Download: Source · Source + configuration ZIP · SVG · Native PDF · PNG

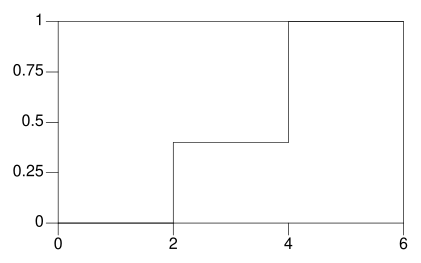
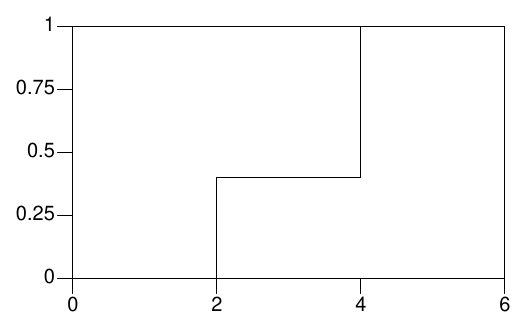
GRA-07-005

Draw a right-continuous cumulative curve

Repeated x coordinates create explicit vertical jumps. Use prepared vertices to keep ties and step conventions identical across tools.

Back to diagram overview

Compare with GRA-07-004 · Shade a reference band.

Complete grap source

.so config/render.roff
.G1
frame ht 2.1 wid 3.6
coord x 0,6 y 0,1
draw solid
0 0
2 0
2 .4
4 .4
4 1
6 1
.G2
ParameterMeaning in this example
Repeated x valuesPlace the vertical jump at its supplied observation value.

Render this diagram

tools/render examples/GRA-07-005.grap

Try changing: Move the first jump from 2 to 3.

Actual output

Draw a right-continuous cumulative curve
GRA-07-005 · grap native output

grap · exit 0

Native compiler log

Standard output

GRA-07-005: native PDF, SVG and PNG rendered with GNU pic / groff 1.25.0; grap 1.49

Download: Source · Source + configuration ZIP · SVG · Native PDF · PNG

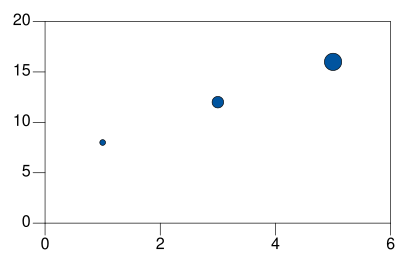
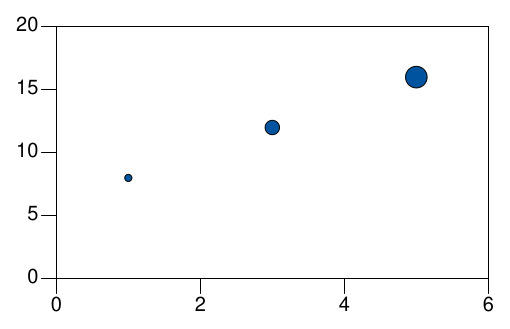
GRA-07-006

Scale marker area to count

The radius must grow with the square root of count. Use physical radii so the circle area, rather than its diameter, represents the supplied sample size.

Back to diagram overview

Compare with GRA-07-005 · Draw a right-continuous cumulative curve.

Complete grap source

.so config/render.roff
.G1
frame ht 2.1 wid 3.6
coord x 0,6 y 0,20
circle at 1,8 radius .03*sqrt(1) fillcolor "blue"
circle at 3,12 radius .03*sqrt(4) fillcolor "blue"
circle at 5,16 radius .03*sqrt(9) fillcolor "blue"
.G2
ParameterMeaning in this example
sqrt(count)Make circle area proportional to the supplied count.

Render this diagram

tools/render examples/GRA-07-006.grap

Try changing: Change the largest count from 9 to 16.

Actual output

Scale marker area to count
GRA-07-006 · grap native output

grap · exit 0

Native compiler log

Standard output

GRA-07-006: native PDF, SVG and PNG rendered with GNU pic / groff 1.25.0; grap 1.49

Download: Source · Source + configuration ZIP · SVG · Native PDF · PNG

08 · Macros and controlled repetition

Name repeated work while leaving the plotting rule visible in the complete source.

GRA-08-001

Name a marker operation

A macro packages a small repeated drawing statement. Use arguments for the data coordinates so the geometry stays explicit at each call.

Back to diagram overview

Compare with GRA-04-004 · Draw separate markers.

Complete grap source

.so config/render.roff
.G1
frame ht 2.1 wid 3.6
coord x 0,6 y 0,20
define samplemark { circle at $1,$2 radius .04; }
samplemark(1,8)
samplemark(3,14)
samplemark(5,11)
.G2
ParameterMeaning in this example
define / $1 / $2Create a marker operation with coordinate arguments.

Render this diagram

tools/render examples/GRA-08-001.grap

Try changing: Change the macro radius to .06.

Actual output

Name a marker operation
GRA-08-001 · grap native output

grap · exit 0

Native compiler log

Standard output

GRA-08-001: native PDF, SVG and PNG rendered with GNU pic / groff 1.25.0; grap 1.49

Download: Source · Source + configuration ZIP · SVG · Native PDF · PNG

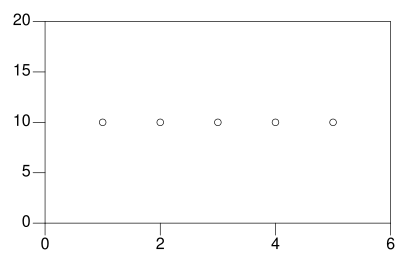
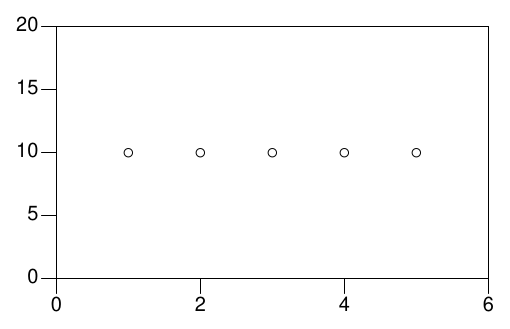
GRA-08-002

Generate a regular sampling grid

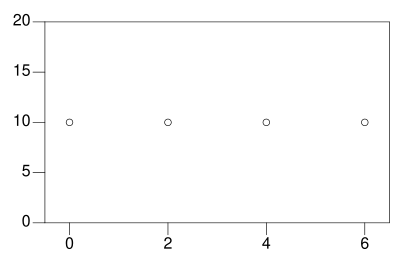
A for loop can enumerate known sample positions. Use it for deterministic construction rather than copying a row of nearly identical commands.

Back to diagram overview

Compare with GRA-08-001 · Name a marker operation.

Complete grap source

.so config/render.roff
.G1
frame ht 2.1 wid 3.6
coord x 0,6 y 0,20
for d from 1 to 5 do { circle at d,10 radius .035; }
.G2
ParameterMeaning in this example
for / from / toEnumerate the supplied sampling positions.

Render this diagram

tools/render examples/GRA-08-002.grap

Try changing: Extend the upper bound to 6.

Actual output

Generate a regular sampling grid
GRA-08-002 · grap native output

grap · exit 0

Native compiler log

Standard output

GRA-08-002: native PDF, SVG and PNG rendered with GNU pic / groff 1.25.0; grap 1.49

Download: Source · Source + configuration ZIP · SVG · Native PDF · PNG

GRA-08-003

Choose an explicit sampling step

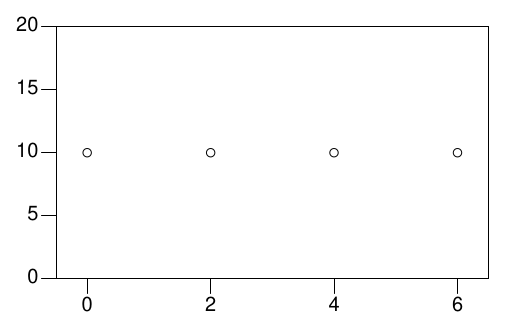
A by clause sets the interval of repeated positions. Use it when the sample spacing is part of the chart definition.

Back to diagram overview

Compare with GRA-08-002 · Generate a regular sampling grid.

Complete grap source

.so config/render.roff
.G1
frame ht 2.1 wid 3.6
coord x -.5,6.5 y 0,20
for d from 0 to 6 by 2 do { circle at d,10 radius .035; }
.G2
ParameterMeaning in this example
by 2Place samples two data units apart.

Render this diagram

tools/render examples/GRA-08-003.grap

Try changing: Change the interval to 3.

Actual output

Choose an explicit sampling step
GRA-08-003 · grap native output

grap · exit 0

Native compiler log

Standard output

GRA-08-003: native PDF, SVG and PNG rendered with GNU pic / groff 1.25.0; grap 1.49

Download: Source · Source + configuration ZIP · SVG · Native PDF · PNG

GRA-08-004

Select a flagged point inside a loop

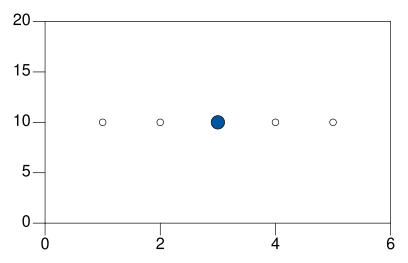
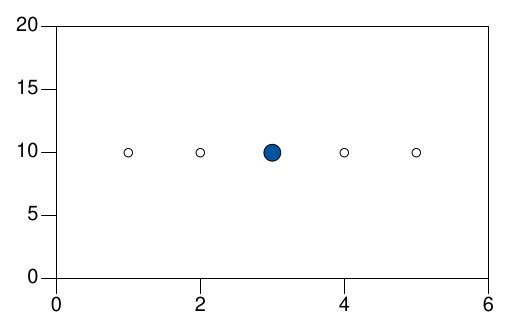
An if branch can change a marker when a known flag is set. Use a redundant radius difference alongside color to identify the selected observation.

Back to diagram overview

Compare with GRA-08-003 · Choose an explicit sampling step.

Complete grap source

.so config/render.roff
.G1
frame ht 2.1 wid 3.6
coord x 0,6 y 0,20
for d from 1 to 5 do {
 if d==3 then {
  circle at d,10 radius .07 fillcolor "blue"
 } else {
  circle at d,10 radius .035
 }
}
.G2
ParameterMeaning in this example
if / then / elseChoose the highlighted marker for a supplied condition.

Render this diagram

tools/render examples/GRA-08-004.grap

Try changing: Select d==4 instead.

Actual output

Select a flagged point inside a loop
GRA-08-004 · grap native output

grap · exit 0

Native compiler log

Standard output

GRA-08-004: native PDF, SVG and PNG rendered with GNU pic / groff 1.25.0; grap 1.49

Download: Source · Source + configuration ZIP · SVG · Native PDF · PNG

GRA-08-005

Trace an analytical function

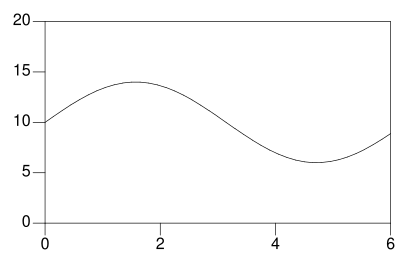
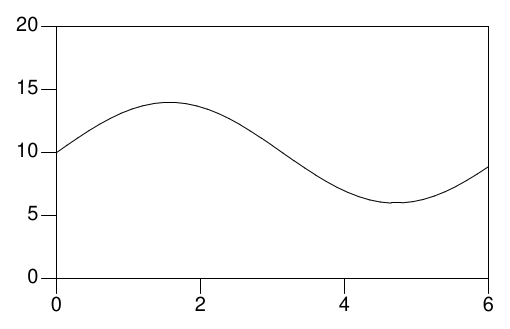
A deterministic expression can supply a complete reference curve. Use a stated sampling interval so changing it has an observable effect on smoothness.

Back to diagram overview

Compare with GRA-08-004 · Select a flagged point inside a loop.

Complete grap source

.so config/render.roff
.G1
frame ht 2.1 wid 3.6
coord x 0,6 y 0,20
draw solid
for t from 0 to 6 by .15 do { next at t,10+4*sin(t); }
.G2
ParameterMeaning in this example
sin(t)Use radians in the supplied reference function.

Render this diagram

tools/render examples/GRA-08-005.grap

Try changing: Increase the sampling interval to .6.

Actual output

Trace an analytical function
GRA-08-005 · grap native output

grap · exit 0

Native compiler log

Standard output

GRA-08-005: native PDF, SVG and PNG rendered with GNU pic / groff 1.25.0; grap 1.49

Download: Source · Source + configuration ZIP · SVG · Native PDF · PNG

GRA-08-006

Format a calculated annotation

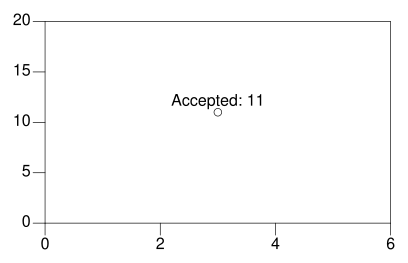
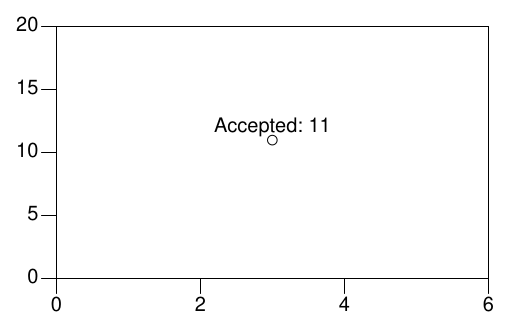
Sprintf turns an expression into readable text. Use it to show a calculated value while keeping the arithmetic in the source.

Back to diagram overview

Compare with GRA-08-005 · Trace an analytical function.

Complete grap source

.so config/render.roff
.G1
frame ht 2.1 wid 3.6
coord x 0,6 y 0,20
value=14-3
sprintf("Accepted: %.0f",value) at 3,12
circle at 3,value radius .04
.G2
ParameterMeaning in this example
sprintfFormat the calculated accepted count.

Render this diagram

tools/render examples/GRA-08-006.grap

Try changing: Change the rejected count from 3 to 4.

Actual output

Format a calculated annotation
GRA-08-006 · grap native output

grap · exit 0

Native compiler log

Standard output

GRA-08-006: native PDF, SVG and PNG rendered with GNU pic / groff 1.25.0; grap 1.49

Download: Source · Source + configuration ZIP · SVG · Native PDF · PNG

09 · Panels and pic integration

Combine charts with explicit alignment instead of letting unrelated scales appear comparable.

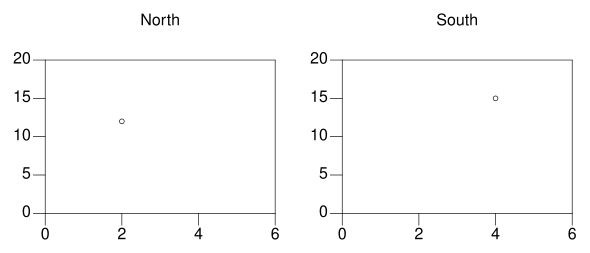
GRA-09-001

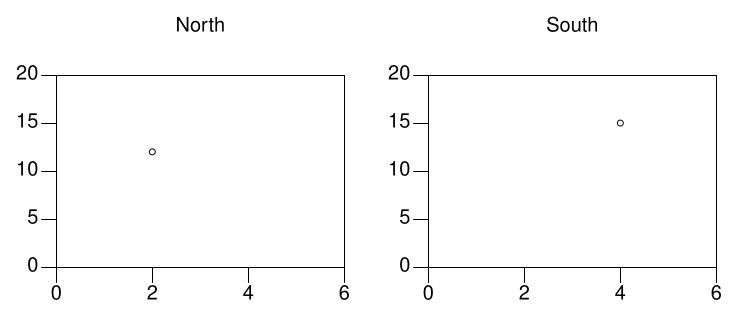
Place two charts beside each other

A named graph exposes its frame to the next graph. Use this to align two independent charts on the same physical row.

Back to diagram overview

Compare with GRA-02-003 · Name another coordinate system.

Complete grap source

.so config/render.roff
.G1
graph First
frame ht 1.6 wid 2.4
coord x 0,6 y 0,20
label top "North"
circle at 2,12
graph Second with .Frame.w at First.Frame.e + (.7,0)
frame ht 1.6 wid 2.4
coord x 0,6 y 0,20
label top "South"
circle at 4,15
.G2
ParameterMeaning in this example
graph / .Frame.wPlace the next graph relative to the previous frame.

Render this diagram

tools/render examples/GRA-09-001.grap

Try changing: Increase the gap between frames to 1.

Actual output

Place two charts beside each other
GRA-09-001 · grap native output

grap · exit 0

Native compiler log

Standard output

GRA-09-001: native PDF, SVG and PNG rendered with GNU pic / groff 1.25.0; grap 1.49

Download: Source · Source + configuration ZIP · SVG · Native PDF · PNG

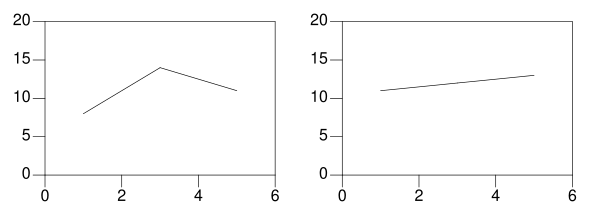
GRA-09-002

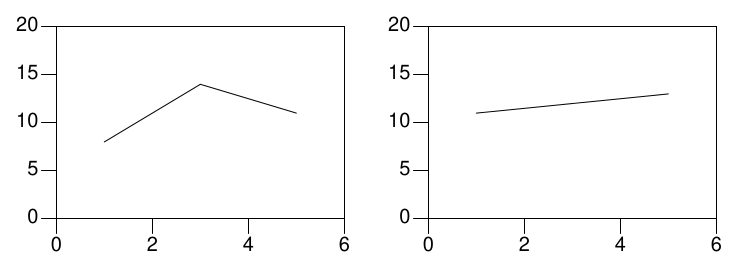
Keep panel scales identical

The same coordinate limits make a panel comparison meaningful. Use them even when one panel contains a narrower range of values.

Back to diagram overview

Compare with GRA-09-001 · Place two charts beside each other.

Complete grap source

.so config/render.roff
.G1
graph First
frame ht 1.6 wid 2.4
coord x 0,6 y 0,20
draw solid
1 8
3 14
5 11
graph Second with .Frame.w at First.Frame.e + (.7,0)
frame ht 1.6 wid 2.4
coord x 0,6 y 0,20
draw solid
1 11
3 12
5 13
.G2
ParameterMeaning in this example
Repeated coord limitsPreserve the same value-to-distance mapping in both panels.

Render this diagram

tools/render examples/GRA-09-002.grap

Try changing: Raise the second panel middle reading to 16.

Actual output

Keep panel scales identical
GRA-09-002 · grap native output

grap · exit 0

Native compiler log

Standard output

GRA-09-002: native PDF, SVG and PNG rendered with GNU pic / groff 1.25.0; grap 1.49

Download: Source · Source + configuration ZIP · SVG · Native PDF · PNG

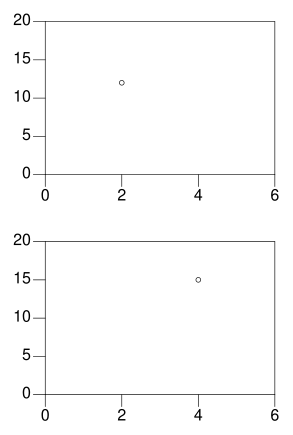
GRA-09-003

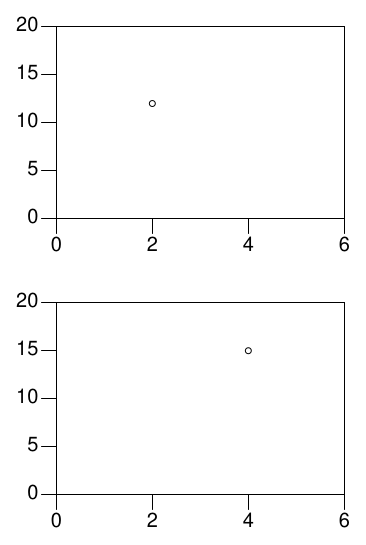
Stack panels vertically

A second frame can attach below the first one. Use a vertical arrangement when the figure must fit a report column.

Back to diagram overview

Compare with GRA-09-002 · Keep panel scales identical.

Complete grap source

.so config/render.roff
.G1
graph First
frame ht 1.6 wid 2.4
coord x 0,6 y 0,20
circle at 2,12
graph Second with .Frame.n at First.Frame.s - (0,.7)
frame ht 1.6 wid 2.4
coord x 0,6 y 0,20
circle at 4,15
.G2
ParameterMeaning in this example
.Frame.n / .Frame.sAlign the top of the second frame below the first.

Render this diagram

tools/render examples/GRA-09-003.grap

Try changing: Increase the vertical gap to 1.

Actual output

Stack panels vertically
GRA-09-003 · grap native output

grap · exit 0

Native compiler log

Standard output

GRA-09-003: native PDF, SVG and PNG rendered with GNU pic / groff 1.25.0; grap 1.49

Download: Source · Source + configuration ZIP · SVG · Native PDF · PNG

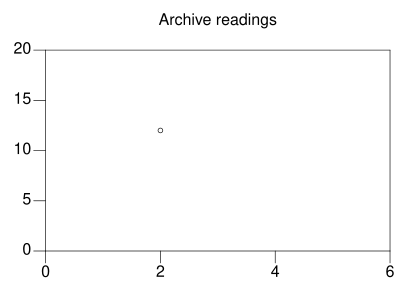
GRA-09-004

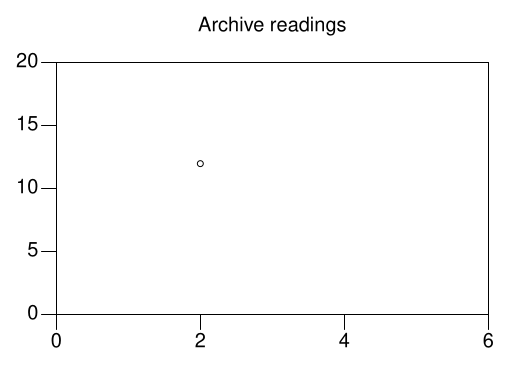
Add a caption in pic coordinates

An embedded pic statement can place a note relative to the frame. Use physical offsets for a caption whose clearance should not depend on data ranges.

Back to diagram overview

Compare with GRA-09-003 · Stack panels vertically.

Complete grap source

.so config/render.roff
.G1
frame ht 2.1 wid 3.6
coord x 0,6 y 0,20
circle at 2,12
pic "Archive readings" at Frame.n + (0,.3)
.G2
ParameterMeaning in this example
picPass a native drawing statement to the enclosing picture.

Render this diagram

tools/render examples/GRA-09-004.grap

Try changing: Move the caption up to .45.

Actual output

Add a caption in pic coordinates
GRA-09-004 · grap native output

grap · exit 0

Native compiler log

Standard output

GRA-09-004: native PDF, SVG and PNG rendered with GNU pic / groff 1.25.0; grap 1.49

Download: Source · Source + configuration ZIP · SVG · Native PDF · PNG

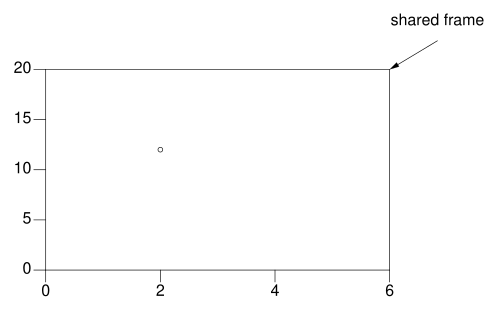
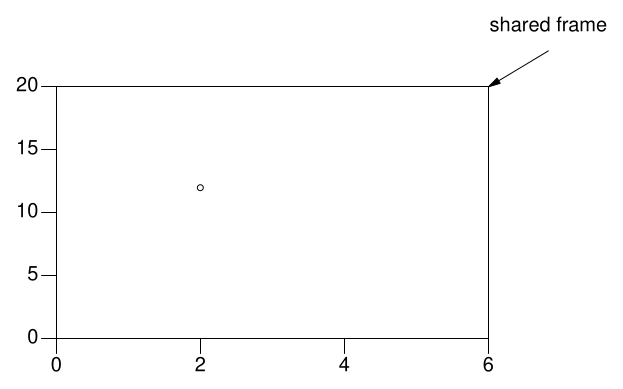
GRA-09-005

Add an external frame callout

A pic arrow can refer to a frame corner directly. Use it for a layout annotation, keeping data-coordinate measurements in grap statements.

Back to diagram overview

Compare with GRA-09-004 · Add a caption in pic coordinates.

Complete grap source

.so config/render.roff
.G1
frame ht 2.1 wid 3.6
coord x 0,6 y 0,20
circle at 2,12
pic arrow from Frame.ne + (.5,.3) to Frame.ne
pic "shared frame" at Frame.ne + (.5,.5)
.G2
ParameterMeaning in this example
Frame.neRefer to the frame's physical northeast corner.

Render this diagram

tools/render examples/GRA-09-005.grap

Try changing: Move the callout farther to the right.

Actual output

Add an external frame callout
GRA-09-005 · grap native output

grap · exit 0

Native compiler log

Standard output

GRA-09-005: native PDF, SVG and PNG rendered with GNU pic / groff 1.25.0; grap 1.49

Download: Source · Source + configuration ZIP · SVG · Native PDF · PNG

GRA-09-006

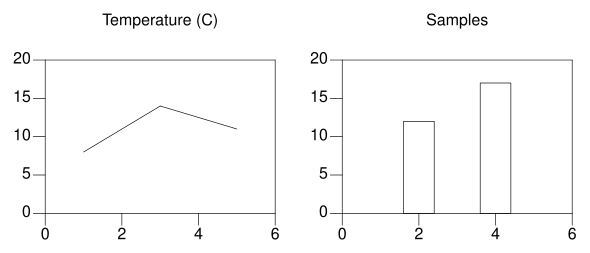
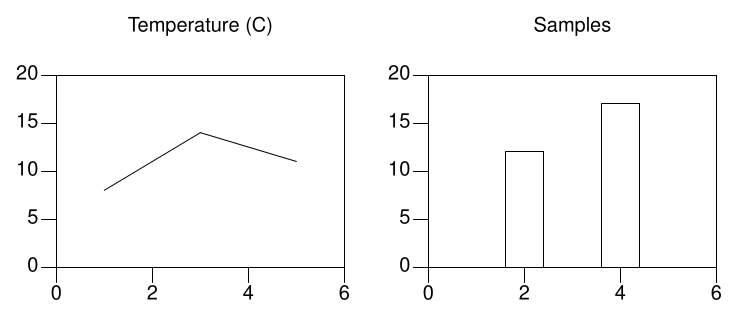
Separate a trend from a count panel

Two panels can carry distinct but related questions. Keep units and panel headings explicit so shared alignment does not imply the same measured quantity.

Back to diagram overview

Compare with GRA-09-005 · Add an external frame callout.

Complete grap source

.so config/render.roff
.G1
graph First
frame ht 1.6 wid 2.4
coord x 0,6 y 0,20
label top "Temperature (C)"
draw solid
1 8
3 14
5 11
graph Second with .Frame.w at First.Frame.e + (.7,0)
frame ht 1.6 wid 2.4
coord x 0,6 y 0,20
label top "Samples"
bar up 2 ht 12 wid .8
bar up 4 ht 17 wid .8
.G2
ParameterMeaning in this example
Panel headingsState the different measured quantity in each panel.

Render this diagram

tools/render examples/GRA-09-006.grap

Try changing: Change the sample counts without changing temperature.

Actual output

Separate a trend from a count panel
GRA-09-006 · grap native output

grap · exit 0

Native compiler log

Standard output

GRA-09-006: native PDF, SVG and PNG rendered with GNU pic / groff 1.25.0; grap 1.49

Download: Source · Source + configuration ZIP · SVG · Native PDF · PNG

10 · Finished archive charts

Combine established techniques into small figures with one stated analytical purpose.

GRA-10-001

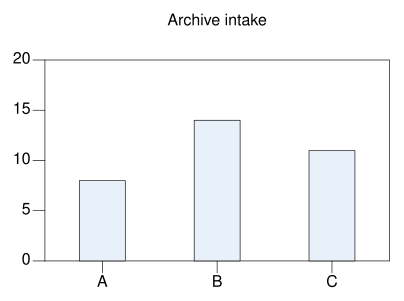
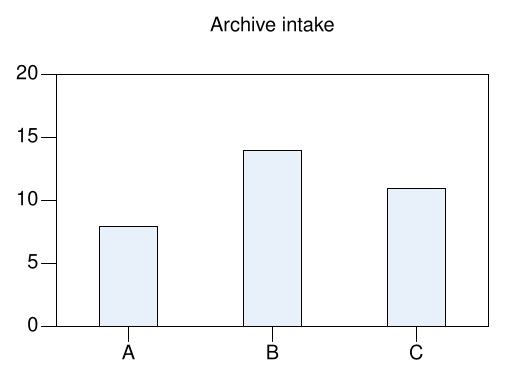
Report intake by batch

Category labels and a zero baseline make a count report readable. Use a shared bar style and keep the batch counts supplied in the complete source.

Back to diagram overview

Compare with GRA-06-001 · Draw vertical counts.

Complete grap source

.so config/render.roff
.G1
frame ht 2.1 wid 3.6
coord x 0,6 y 0,20
label top "Archive intake"
ticks bottom at 1 "A",3 "B",5 "C"
bar up 1 ht 8 wid .8 fillcolor "wash"
bar up 3 ht 14 wid .8 fillcolor "wash"
bar up 5 ht 11 wid .8 fillcolor "wash"
.G2
ParameterMeaning in this example
Zero-based categorical barsCompare the supplied intake counts directly.

Render this diagram

tools/render examples/GRA-10-001.grap

Try changing: Add a batch D at position 6.

Actual output

Report intake by batch
GRA-10-001 · grap native output

grap · exit 0

Native compiler log

Standard output

GRA-10-001: native PDF, SVG and PNG rendered with GNU pic / groff 1.25.0; grap 1.49

Download: Source · Source + configuration ZIP · SVG · Native PDF · PNG

GRA-10-002

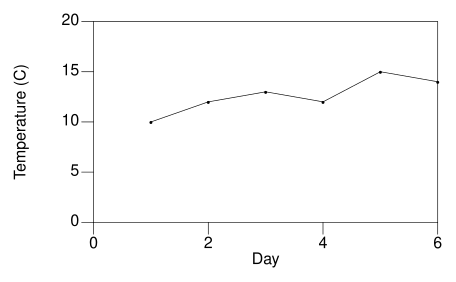
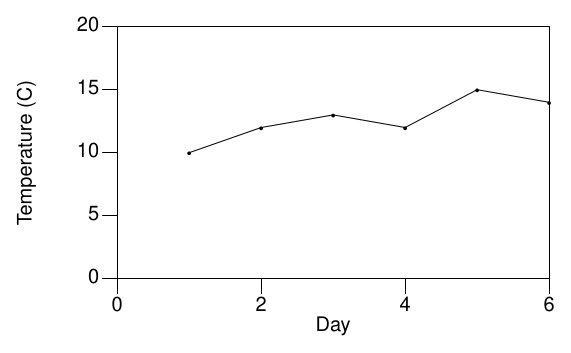
Report a temperature sequence

A labeled trend keeps units and sampling positions visible. Use local input so the reported observations can be inspected independently of the drawing.

Back to diagram overview

Compare with GRA-10-001 · Report intake by batch.

Complete grap source

.so config/render.roff
.G1
frame ht 2.1 wid 3.6
coord x 0,6 y 0,20
label bottom "Day"
label left "Temperature (C)" left .35
draw solid bullet
copy "data/readings.txt"
.G2
ParameterMeaning in this example
Local table + markersShow both the supplied values and their sampling positions.

Render this diagram

tools/render examples/GRA-10-002.grap

Try changing: Edit one local reading and render again.

Actual output

Report a temperature sequence
GRA-10-002 · grap native output

grap · exit 0

Native compiler log

Standard output

GRA-10-002: native PDF, SVG and PNG rendered with GNU pic / groff 1.25.0; grap 1.49

Download: Source · Source + configuration ZIP · SVG · Native PDF · PNG

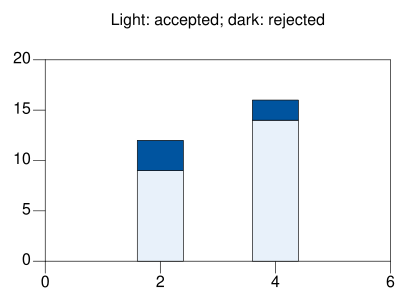
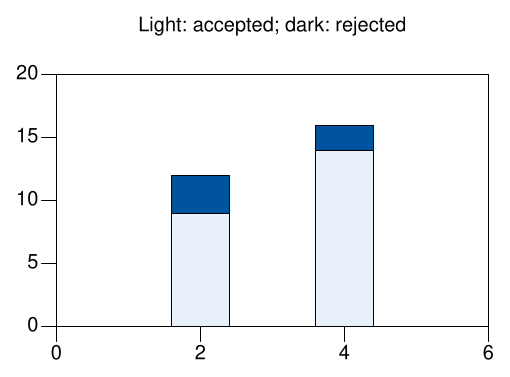
GRA-10-003

Compare accepted and rejected totals

A stacked composition keeps parts attached to their total. Use a legend in text so the two fills have an explicit meaning.

Back to diagram overview

Compare with GRA-10-002 · Report a temperature sequence.

Complete grap source

.so config/render.roff
.G1
frame ht 2.1 wid 3.6
coord x 0,6 y 0,20
label top "Light: accepted; dark: rejected"
bar up 2 ht 9 wid .8 fillcolor "wash"
bar up 2 ht 3 base 9 wid .8 fillcolor "blue"
bar up 4 ht 14 wid .8 fillcolor "wash"
bar up 4 ht 2 base 14 wid .8 fillcolor "blue"
.G2
ParameterMeaning in this example
Stacked countsKeep each rejected component on top of its accepted count.

Render this diagram

tools/render examples/GRA-10-003.grap

Try changing: Change the second rejected count to 4.

Actual output

Compare accepted and rejected totals
GRA-10-003 · grap native output

grap · exit 0

Native compiler log

Standard output

GRA-10-003: native PDF, SVG and PNG rendered with GNU pic / groff 1.25.0; grap 1.49

Download: Source · Source + configuration ZIP · SVG · Native PDF · PNG

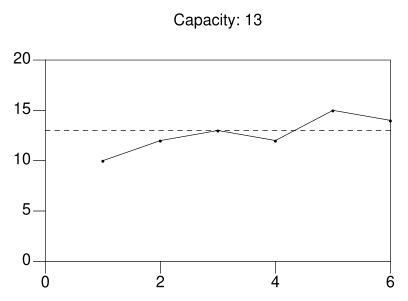
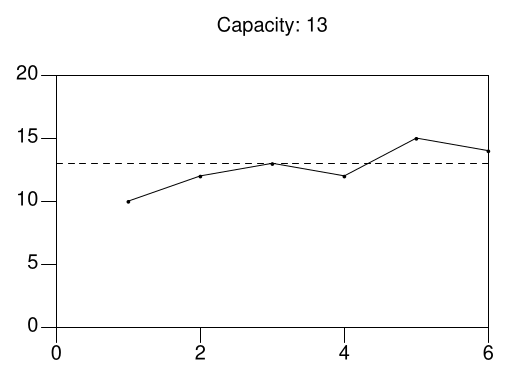
GRA-10-004

Check readings against a capacity

A threshold report should make exceedances visible without discarding ordinary observations. Use an explicit limit, a named line and the complete measurement sequence.

Back to diagram overview

Compare with GRA-10-003 · Compare accepted and rejected totals.

Complete grap source

.so config/render.roff
.G1
frame ht 2.1 wid 3.6
coord x 0,6 y 0,20
line dashed from 0,13 to 6,13
label top "Capacity: 13"
draw solid bullet
copy "data/readings.txt"
.G2
ParameterMeaning in this example
Named thresholdCompare every supplied reading with one fixed limit.

Render this diagram

tools/render examples/GRA-10-004.grap

Try changing: Move the capacity to 15.

Actual output

Check readings against a capacity
GRA-10-004 · grap native output

grap · exit 0

Native compiler log

Standard output

GRA-10-004: native PDF, SVG and PNG rendered with GNU pic / groff 1.25.0; grap 1.49

Download: Source · Source + configuration ZIP · SVG · Native PDF · PNG

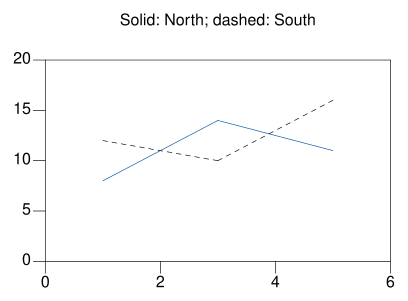
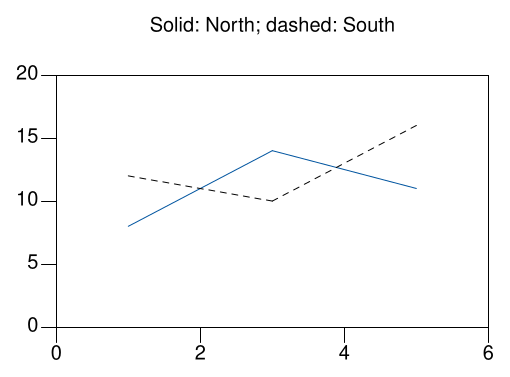
GRA-10-005

Report two independent station trends

Named streams and different line styles distinguish stations. Use a text legend so the reader does not have to infer which pattern belongs to each station.

Back to diagram overview

Compare with GRA-10-004 · Check readings against a capacity.

Complete grap source

.so config/render.roff
.G1
frame ht 2.1 wid 3.6
coord x 0,6 y 0,20
label top "Solid: North; dashed: South"
draw North solid color "blue"
draw South dashed
next North at 1,8
next North at 3,14
next North at 5,11
next South at 1,12
next South at 3,10
next South at 5,16
.G2
ParameterMeaning in this example
Named streams + legendKeep the two supplied station sequences independent.

Render this diagram

tools/render examples/GRA-10-005.grap

Try changing: Swap the station line styles.

Actual output

Report two independent station trends
GRA-10-005 · grap native output

grap · exit 0

Native compiler log

Standard output

GRA-10-005: native PDF, SVG and PNG rendered with GNU pic / groff 1.25.0; grap 1.49

Download: Source · Source + configuration ZIP · SVG · Native PDF · PNG

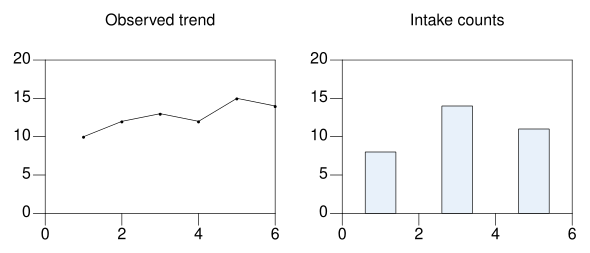
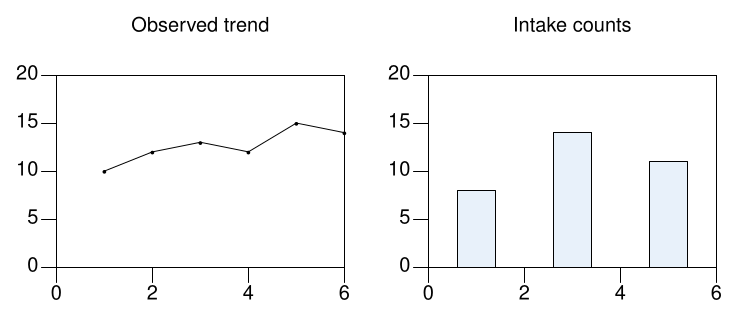
GRA-10-006

Finish a paired archive report

A paired figure can show observations beside their operational context. Use separate panel captions and preserve the common day domain while naming the different quantities.

Back to diagram overview

Compare with GRA-10-005 · Report two independent station trends.

Complete grap source

.so config/render.roff
.G1
graph First
frame ht 1.6 wid 2.4
coord x 0,6 y 0,20
label top "Observed trend"
draw solid bullet
copy "data/readings.txt"
graph Second with .Frame.w at First.Frame.e + (.7,0)
frame ht 1.6 wid 2.4
coord x 0,6 y 0,20
label top "Intake counts"
bar up 1 ht 8 wid .8 fillcolor "wash"
bar up 3 ht 14 wid .8 fillcolor "wash"
bar up 5 ht 11 wid .8 fillcolor "wash"
.G2
ParameterMeaning in this example
Paired reportCombine two established chart types with explicit panel meanings.

Render this diagram

tools/render examples/GRA-10-006.grap

Try changing: Change the second panel to accepted counts.

Actual output

Finish a paired archive report
GRA-10-006 · grap native output

grap · exit 0

Native compiler log

Standard output

GRA-10-006: native PDF, SVG and PNG rendered with GNU pic / groff 1.25.0; grap 1.49

Download: Source · Source + configuration ZIP · SVG · Native PDF · PNG

Choosing a diagram

Start with the question and the relationship to communicate. Use the smallest example that contains the needed idea, then add labels, grouping and styling only where they clarify it. Inspect the native figure at its intended reading size. The examples draw supplied process meanings and statistics; a drawing does not execute a workflow or establish a causal claim.

Goal Start here
Read a local numeric file Chapter 05
Compare counts or prepared distributions Chapter 06
Show supplied uncertainty or thresholds Chapter 07
Construct repeated drawing rules Chapter 08
Align related panels Chapter 09
Finish an archive report Chapter 10

Feature coverage

Feature family Chapter
First graphs 01
Coordinates and ranges 02
Axes, ticks and grids 03
Lines, markers and series 04
Local data and expressions 05
Bars and prepared distributions 06
Scientific annotations 07
Macros and controlled repetition 08
Panels and pic integration 09
Finished archive charts 10

References and licensing

grap project and manual and the bundled grap 1.49 manual installed with the native tool.

Compare native chart syntax in the gnuplot tour, GNU Octave tour and R / ggplot2 tour. The pic tour develops the geometric language used by grap.

Original prose, programs and synthetic datasets are CC0. Copyrightable structure and the publishing framework are CC BY 4.0, Lukas C. Bossert. Bundled fonts, package sources and other third-party material retain their own terms; consult the license scope and LICENSES/. The shared example and command index links every rendered program below.

Example and command index

Content: CC0 1.0. Structure and publishing framework: CC BY 4.0 by Lukas C. Bossert. Repository source · Publishing framework source · License scope and third-party notices.