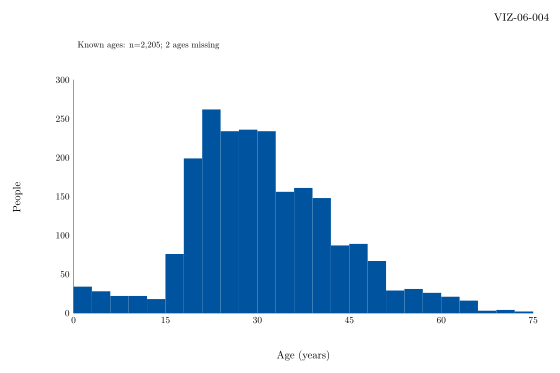
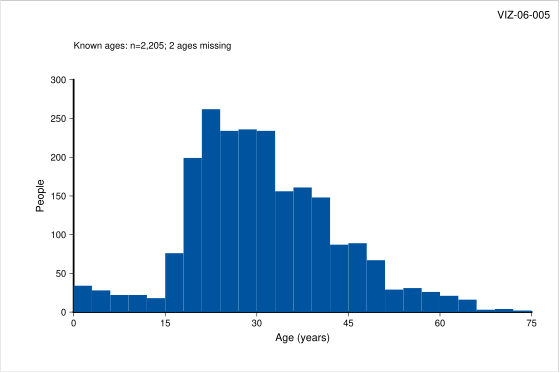
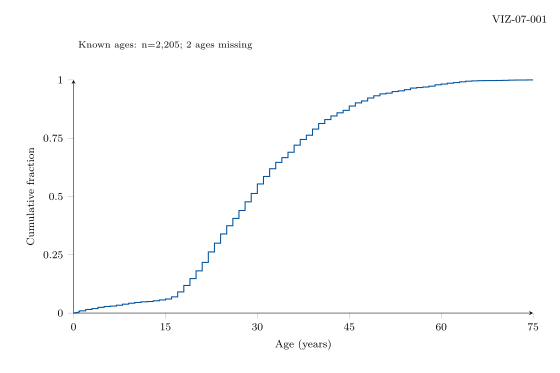
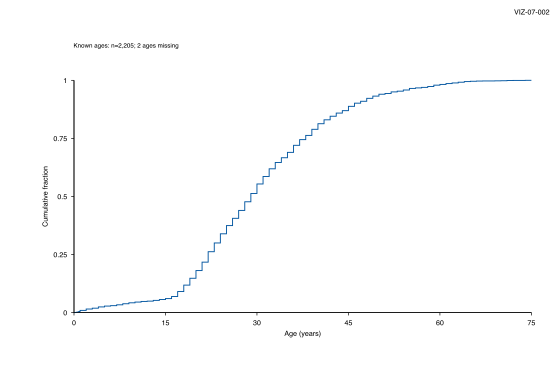
No matching examples. Try another query or clear the filters.
Copy link A visual reference · Data visualization comparison
Data visualization comparison,
Twelve visual questions. Sixty complete programs. Actual vector output from PGFplots / TikZ, gnuplot, Asymptote, MetaPost and GMT.
Follow the same people through counts, rates, distributions and age-by-group views. Every row of the comparison uses shared numeric input, fixed scales and the same statistical definition. The native tools retain their own drawing APIs and typography.
Last changes: 2026-10-31. Readable, linted source across all five tools, using the verified Titanic archive, version 1.0.1.
60 worked examples
12 topic families
1 canonical Org source
Same data · five implementations
Compare the charts Each row answers one question with common data and chart definitions. Choose an implementation to inspect its source and downloads. Download the complete data and preparation kit .
People aboard by class and crew Survival proportions within groups Survival by recorded sex and group A dumbbell comparison of survival Age distribution in three-year bins The empirical cumulative age distribution Five-number age summaries Violin densities with a shared bandwidth Survival across age bands and groups Add sample size to the survival grid Age counts as four small multiples Copy link Reading the tour
Compare a result, then reproduce it
Choose a question
Each chapter starts with five outputs. Read across the tools before opening their drawing commands.
Keep the definition fixed
Shared tables fix denominators, bins, quartiles, tied ages, smoothing and circle areas. Font metrics and native export paths can differ.
Run the native program
Download a source-and-data ZIP, unpack it and run the command in its README. Every figure PDF also embeds its complete program and plotting inputs.
The focused source shows data loading and drawing. Expand the complete program for canvas setup, imports, colours, axis helpers and output commands. PDF readers see the focused source and captured result; the HTML includes the full source and logs. The tour PDF also embeds the complete data and preparation kit, including the original CSV and all derived tables. The paired tool tours provide broader syntax references.
Copy link Data, provenance and reproducibility
The collection DOI 10.5281/zenodo.22967792 resolves to the pinned release 10.5281/zenodo.22983324 , version 1.0.1, published 26 September 2026 by Lukas C. Bossert. The archived teaching snapshot contains 2,207 people: 1,317 passengers and 890 crew, with 711 survivors and 1,496 non-survivors. Crew is a separate group alongside the three passenger classes. Recorded female and male categories include children. Two ages are missing; age plots use 2,205 people. Identical rows are retained because they can represent different people.
The person table's SHA-256 is ab8e88d421a6d1cd54f12c5660f425c21c780e2186652894d8b9c9f740d78650. All six original files are preserved under data/source/ . The preparation script checks the archive's MD5 and SHA-256 digests, recomputes summaries, checks them against all four archived summaries and writes deterministic tables. Run python3 scripts/prepare-data.py --check to verify them. recipes.json records every column, range and statistical convention. The data dictionary explains the numeric files. No plotting tool chooses its own estimator or bin edges here.
The raw data and its derivatives retain the archive's No Limit Public License; see data attribution and full NLPL text . Original tour prose and programs use CC0; the publishing framework retains its CC BY attribution. This historical teaching snapshot supports descriptive comparisons, not causal claims about survival.
Copy link Choosing a tool
PGFplots supplies table-driven axes, prepared boxplots and group plots inside TeX; TikZ fills the grid cells and circles. gnuplot supplies compact column expressions, boxes, candlesticks, filled curves and variable colour. Asymptote combines typed arrays, paths, pens and composable pictures. MetaPost expresses geometry and colour interpolation with paths, tables and TeX labels. GMT pipes selected columns into native bar, box-and-whisker, polygon and symbol modules and manages panels with subplot.
These examples compare source patterns and results. They do not rank speed or claim pixel-identical typography. Computing the statistics once makes differences in the graphics APIs visible. A separate exercise could compare the tools' native statistical defaults, which would answer a different question.
The full build requires Python 3, TeX Live with PGFplots, gnuplot, Asymptote, MetaPost, GMT, Ghostscript, Poppler and librsvg. It runs the reviewed local programs in isolated working directories without network access. A standalone bundle needs only its own engine: pdflatex, gnuplot, asy, mpost or bash plus GMT/Ghostscript. MetaPost's standalone program emits native SVG; the publisher uses librsvg to make its PDF. Other engines emit PDF; Poppler creates their SVG previews. All sixty figures have PNG, SVG and PDF downloads.
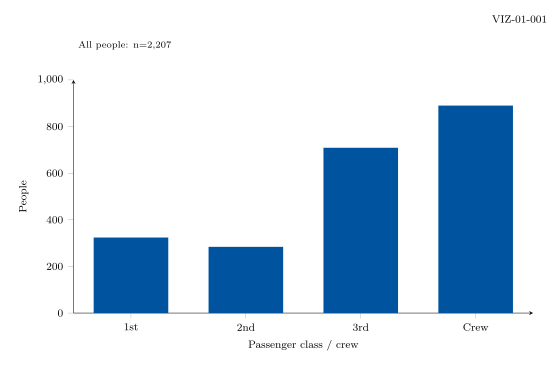
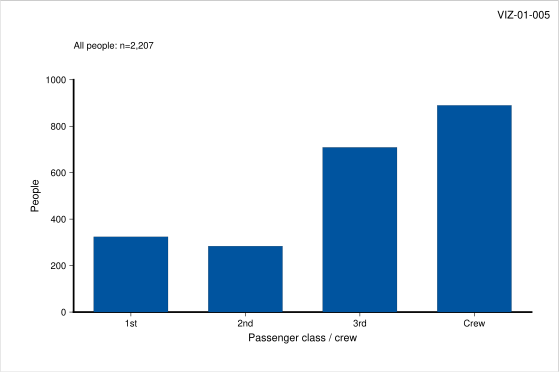
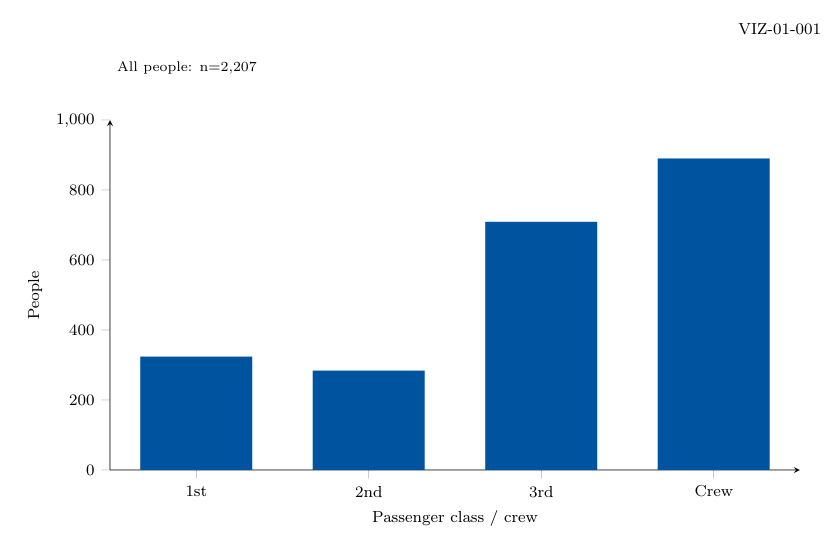
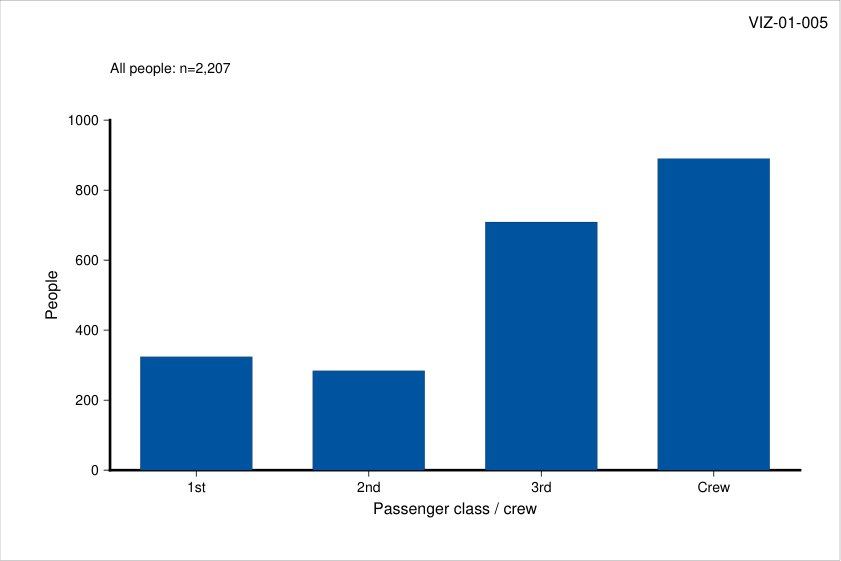
Copy link VIZ-01-001 PGFplots / TikZ: counts PGFplots reads the shared count column and draws bars on fixed axes.
Back to comparison gallery Drawing commands \pgfplotstableread { data/classes.tsv} \Data
\begin { axis} [
width=345bp, height=175bp,
scale only axis, at={ (55bp,45bp)} ,
anchor=south west, xmin=0.5,
xmax=4.5, ymin=0,
ymax=1000, xtick={ 1,2,3,4} ,
ytick={ 0,200,400,600,800,1000} , xlabel={ Passenger class / crew} ,
ylabel={ People} , axis lines=left,
tick align=outside, enlargelimits=false,
clip=false, xticklabels={ 1st,2nd,3rd,Crew}
]
\addplot [ybar,bar shift=0pt,bar width=56bp,fill=Blue,draw=none]
table[x index=0,y index=1]{ data/classes.tsv} ;
\end { axis}
Actual PGFplots / TikZ output VIZ-01-001 · native vector output PGFplots / TikZ · exit 0
Command or choice Meaning table + ybarNative drawing method used here. classes.tsvShared numeric input; column definitions are in data/recipes.json. Fixed rangesSame axis domain and statistical definition in all five implementations.
Complete standalone program \documentclass [tikz,border=0pt] { standalone}
\usepackage { pgfplots,pgfplotstable}
\usepgfplotslibrary { statistics,groupplots}
\pgfplotsset { compat=1.18}
\definecolor { Blue}{ HTML}{ 00549F}
\definecolor { Teal}{ HTML}{ 00B1B7}
\definecolor { Orange}{ HTML}{ F6A800}
\definecolor { Wash}{ HTML}{ E8F1FA}
\definecolor { Missing}{ HTML}{ ECECED}
\begin { document}
\begin { tikzpicture} [font=\fontsize { 8}{ 10} \selectfont ]
\path [use as bounding box,fill=white] (0,0) rectangle (420bp,280bp);
\node [anchor=north east] at (414bp,272bp) { VIZ-01-001} ;
\node [anchor=west,font=\fontsize{7}{9}\selectfont] at
(55bp,246bp) { All people: n=2,207} ;
% BEGIN EXAMPLE
\pgfplotstableread { data/classes.tsv} \Data
\begin { axis} [
width=345bp, height=175bp,
scale only axis, at={ (55bp,45bp)} ,
anchor=south west, xmin=0.5,
xmax=4.5, ymin=0,
ymax=1000, xtick={ 1,2,3,4} ,
ytick={ 0,200,400,600,800,1000} , xlabel={ Passenger class / crew} ,
ylabel={ People} , axis lines=left,
tick align=outside, enlargelimits=false,
clip=false, xticklabels={ 1st,2nd,3rd,Crew}
]
\addplot [ybar,bar shift=0pt,bar width=56bp,fill=Blue,draw=none]
table[x index=0,y index=1]{ data/classes.tsv} ;
\end { axis}
% END EXAMPLE
\end { tikzpicture}
\end { document}
Native build log Download: Source · Source + data ZIP · SVG · PDF · PNG
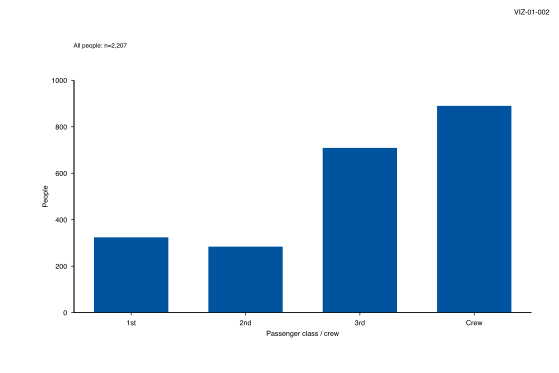
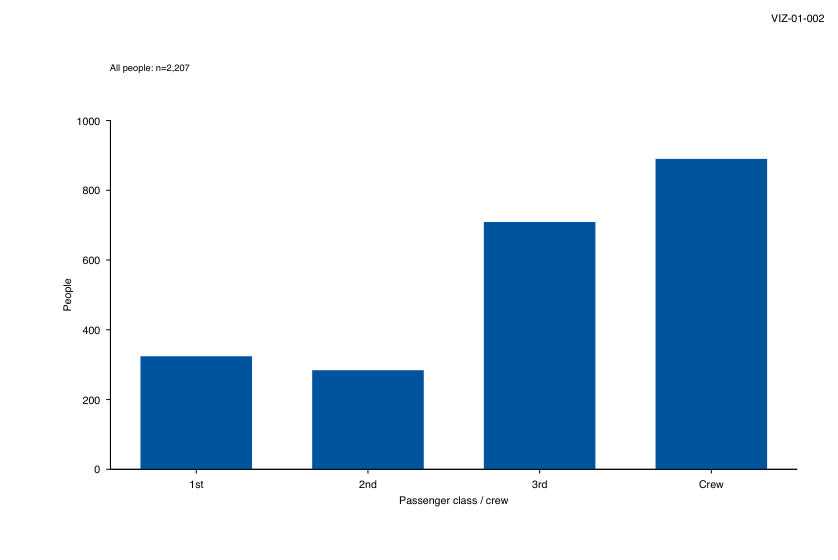
Copy link VIZ-01-002 gnuplot: counts Column selection and absolute box width produce the count chart.
Back to comparison gallery Drawing commands set boxwidth .65 absolute
plot "data/classes.tsv" using 1 : 2 with boxes lc rgb "#00549f"
Actual gnuplot output VIZ-01-002 · native vector output gnuplot · exit 0
Command or choice Meaning using 1:2 with boxesNative drawing method used here. classes.tsvShared numeric input; column definitions are in data/recipes.json. Fixed rangesSame axis domain and statistical definition in all five implementations.
Complete standalone program set terminal pdfcairo size 5.833333 in , 3.888889 in font "Helvetica,8"
set output "VIZ-01-002.pdf"
set lmargin at screen 0.13095238095238096
set rmargin at screen 0.9523809523809523
set bmargin at screen 0.16071428571428573
set tmargin at screen 0.7857142857142857
set xrange [ 0.5 : 4.5 ]
set yrange [ 0 : 1000 ]
set xtics ( "1st" 1 , "2nd" 2 , "3rd" 3 , "Crew" 4 )
set ytics ( "0" 0 , "200" 200 , "400" 400 , "600" 600 , "800" 800 , "1000" 1000 )
set xlabel "Passenger class / crew"
set ylabel "People"
set border 3
set tics out nomirror
unset key
set style fill solid 1.0 noborder
set label 1 "VIZ-01-002" at screen .985 , .97 right
set label 2 "All people: n=2,207" at screen .13 , .88 left font ",7"
set palette defined ( 0 "#e8f1fa" , 100 "#00549f" )
set cbrange [ 0 : 100 ]
unset colorbox
# BEGIN EXAMPLE
set boxwidth .65 absolute
plot "data/classes.tsv" using 1 : 2 with boxes lc rgb "#00549f"
# END EXAMPLE
unset output
Native build log
Download: Source · Source + data ZIP · SVG · PDF · PNG
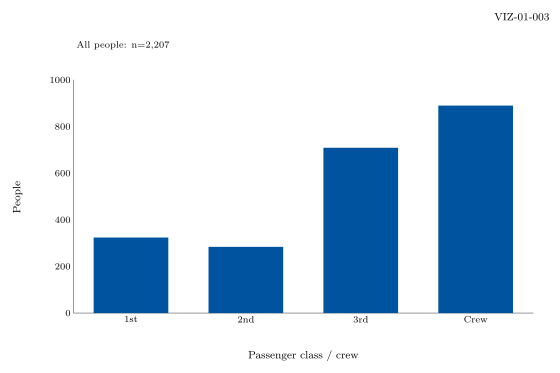
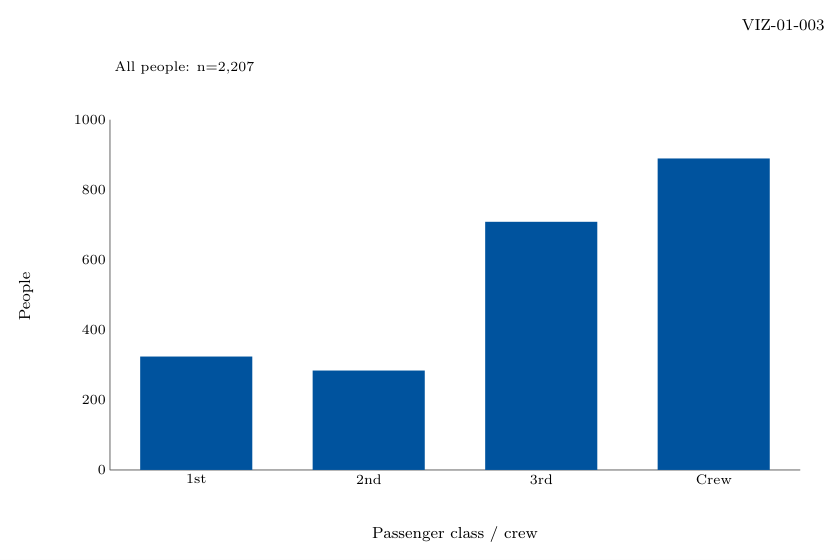
Copy link VIZ-01-003 Asymptote: counts Asymptote reads the shared numeric table into typed arrays and draws this chart with paths, pens and physical-size symbols.
Back to comparison gallery Drawing commands real [][] d = input ( "data/classes.tsv" ). line ();
for ( int i = 0 ; i < d . length ; ++ i ) {
real [] v = d [ i ];
rect ( v [ 0 ] - .325 , 0 , v [ 0 ] + .325 , v [ 1 ], Blue );
}
Actual Asymptote output VIZ-01-003 · native vector output Asymptote · exit 0
Command or choice Meaning arrays + native pathsNative drawing method used here. classes.tsvShared numeric input; column definitions are in data/recipes.json. Fixed rangesSame axis domain and statistical definition in all five implementations.
Complete standalone program import graph ;
size ( 420 bp , 280 bp , IgnoreAspect );
defaultpen ( fontsize ( 8 ));
pen Blue = rgb ( 0 , 84 / 255 , 159 / 255 ), Teal = rgb ( 0 , 177 / 255 , 183 / 255 );
pen Orange = rgb ( 246 / 255 , 168 / 255 , 0 ), Wash = rgb ( 232 / 255 , 241 / 255 , 250 / 255 );
pen Missing = rgb ( 236 / 255 , 236 / 255 , 237 / 255 );
pair P ( real x , real y ) {
return ( 55 + 345 * ( x - ( 0.5 )) / ( 4.0 ), 45 + 175 * ( y - ( 0 )) / ( 1000 ));
}
void rect ( real x , real y , real xx , real yy , pen p ) {
fill ( P ( x , y ) -- P ( xx , y ) -- P ( xx , yy ) -- P ( x , yy ) -- cycle , p );
}
fill ( box (( 0 , 0 ), ( 420 , 280 )), white );
label ( "VIZ-01-003" , ( 414 , 272 ), SW , fontsize ( 8 ));
label ( "All people: n=2,207" , ( 55 , 246 ), E , fontsize ( 7 ));
draw ( P ( 0.5 , 1000 ) -- P ( 0.5 , 0 ) -- P ( 4.5 , 0 ), gray ( .4 ));
label ( "1st" , P ( 1 , 0 ), S , fontsize ( 7 ));
label ( "2nd" , P ( 2 , 0 ), S , fontsize ( 7 ));
label ( "3rd" , P ( 3 , 0 ), S , fontsize ( 7 ));
label ( "Crew" , P ( 4 , 0 ), S , fontsize ( 7 ));
label ( "0" , P ( 0.5 , 0 ), W , fontsize ( 7 ));
label ( "200" , P ( 0.5 , 200 ), W , fontsize ( 7 ));
label ( "400" , P ( 0.5 , 400 ), W , fontsize ( 7 ));
label ( "600" , P ( 0.5 , 600 ), W , fontsize ( 7 ));
label ( "800" , P ( 0.5 , 800 ), W , fontsize ( 7 ));
label ( "1000" , P ( 0.5 , 1000 ), W , fontsize ( 7 ));
label ( "Passenger class / crew" , ( 227.5 , 13 ), fontsize ( 8 ));
label ( rotate ( 90 ) * Label ( "People" ), ( 13 , 132 ), fontsize ( 8 ));
// BEGIN EXAMPLE
real [][] d = input ( "data/classes.tsv" ). line ();
for ( int i = 0 ; i < d . length ; ++ i ) {
real [] v = d [ i ];
rect ( v [ 0 ] - .325 , 0 , v [ 0 ] + .325 , v [ 1 ], Blue );
}
// END EXAMPLE
shipout ( "VIZ-01-003" , bbox ( 0 ));
Native build log
Download: Source · Source + data ZIP · SVG · PDF · PNG
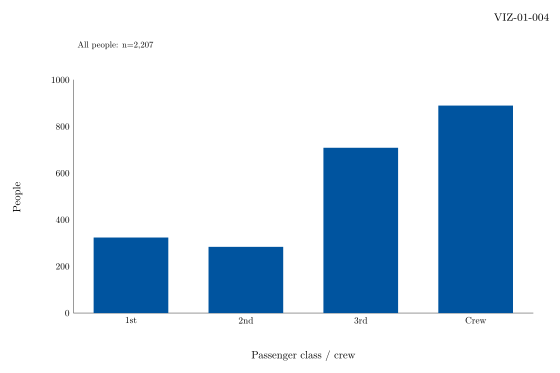
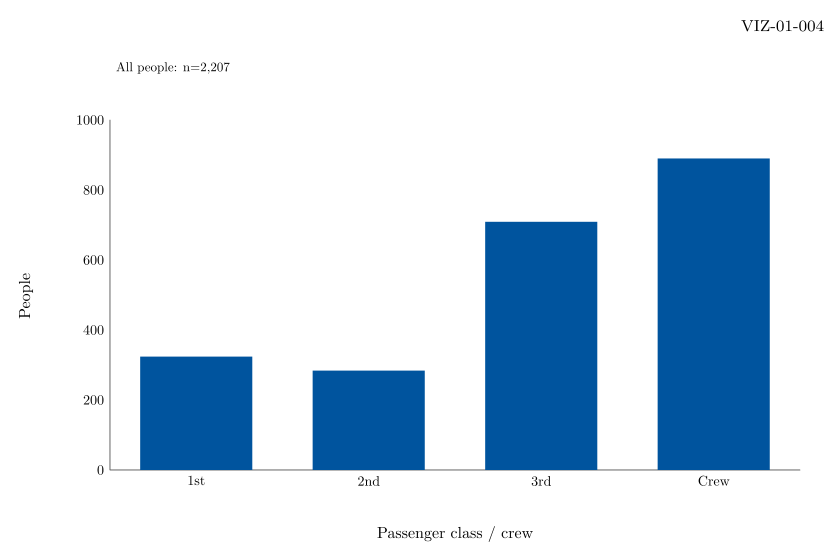
Copy link VIZ-01-004 MetaPost: counts MetaPost reads numeric fields with gdata and scantokens, then constructs the chart with paths, TeX labels and colour interpolation.
Back to comparison gallery Drawing commands numeric n , v [][];
n := 0 ;
gdata ( "data/classes.tsv" , c ,
n := n + 1 ;
for j = 1 upto 12 :
v [ n ][ j ] := scantokens c [ j ];
endfor
);
for k = 1 upto n :
rect ( v [ k ][ 1 ] - .325 , 0 , v [ k ][ 1 ] + .325 , v [ k ][ 2 ], Blue );
endfor
Actual MetaPost output VIZ-01-004 · native vector output MetaPost · exit 0
Command or choice Meaning gdata + pathsNative drawing method used here. classes.tsvShared numeric input; column definitions are in data/recipes.json. Fixed rangesSame axis domain and statistical definition in all five implementations.
Complete standalone program input graph ;
prologues := 3 ;
outputformat := "svg" ;
outputtemplate := "VIZ-01-004.svg" ;
color Blue , Teal , Orange , Wash , Missing ;
Blue := ( 0 , 84 / 255 , 159 / 255 );
Teal := ( 0 , 177 / 255 , 183 / 255 );
Orange := ( 246 / 255 , 168 / 255 , 0 );
Wash := ( 232 / 255 , 241 / 255 , 250 / 255 );
Missing := ( 236 / 255 , 236 / 255 , 237 / 255 );
vardef P ( expr x , y ) =
( 55 + 345 * ( x - ( 0.5 )) / ( 4.0 ), 45 + 175 * ( y - ( 0 )) / ( 1000 ))
enddef ;
def rect ( expr x , y , xx , yy , col ) =
fill P ( x , y ) -- P ( xx , y ) -- P ( xx , yy ) -- P ( x , yy ) -- cycle withcolor col ;
enddef ;
beginfig ( 1 );
fill unitsquare xscaled 420 yscaled 280 withcolor white ;
label .llft ( "VIZ-01-004" infont "cmr8" , ( 414 , 272 ));
label .rt ( btex All people: n=2,207 etex scaled .65 , ( 55 , 246 ));
draw P ( 0.5 , 1000 ) -- P ( 0.5 , 0 ) -- P ( 4.5 , 0 ) withcolor .4 white ;
label .bot ( btex 1st etex scaled .7 , P ( 1 , 0 ));
label .bot ( btex 2nd etex scaled .7 , P ( 2 , 0 ));
label .bot ( btex 3rd etex scaled .7 , P ( 3 , 0 ));
label .bot ( btex Crew etex scaled .7 , P ( 4 , 0 ));
label .lft ( btex 0 etex scaled .7 , P ( 0.5 , 0 ));
label .lft ( btex 200 etex scaled .7 , P ( 0.5 , 200 ));
label .lft ( btex 400 etex scaled .7 , P ( 0.5 , 400 ));
label .lft ( btex 600 etex scaled .7 , P ( 0.5 , 600 ));
label .lft ( btex 800 etex scaled .7 , P ( 0.5 , 800 ));
label .lft ( btex 1000 etex scaled .7 , P ( 0.5 , 1000 ));
label ( btex Passenger class / crew etex scaled .8 , ( 227.5 , 13 ));
label ( btex People etex scaled .8 rotated 90 , ( 13 , 132 ));
% BEGIN EXAMPLE
numeric n , v [][];
n := 0 ;
gdata ( "data/classes.tsv" , c ,
n := n + 1 ;
for j = 1 upto 12 :
v [ n ][ j ] := scantokens c [ j ];
endfor
);
for k = 1 upto n :
rect ( v [ k ][ 1 ] - .325 , 0 , v [ k ][ 1 ] + .325 , v [ k ][ 2 ], Blue );
endfor
% END EXAMPLE
setbounds currentpicture to unitsquare xscaled 420 yscaled 280 ;
endfig ;
end .
Native build log Download: Source · Source + data ZIP · SVG · PDF · PNG
Copy link VIZ-01-005 GMT: counts GMT reads selected columns through its native plotting modules; column expressions are performed by the shown local awk pipeline. The shared tables determine the statistics.
Back to comparison gallery Drawing commands plot data/classes.tsv -i0,1 -Sb56p+b0 -G#00549f -W0p
Actual GMT output VIZ-01-005 · native vector output GMT · exit 0
Command or choice Meaning plot -SbNative drawing method used here. classes.tsvShared numeric input; column definitions are in data/recipes.json. Fixed rangesSame axis domain and statistical definition in all five implementations.
Complete standalone program #!/usr/bin/env bash
set -euo pipefail
export GMT_USERDIR = " $PWD /.gmt"
mkdir -p " $GMT_USERDIR "
gmt begin VIZ-01-005 pdf
gmt set \
FONT_ANNOT_PRIMARY 7p \
FONT_LABEL 8p \
FONT_TITLE 8p \
MAP_TITLE_OFFSET 4p \
MAP_FRAME_TYPE plain \
MAP_TICK_LENGTH_PRIMARY 3p
gmt plot -R0/420/0/280 -JX420p/280p -Gwhite -W0p <<'CANVAS'
0 0
420 0
420 280
0 280
CANVAS
gmt text -F+f8p+jTR <<'ID'
414 272 VIZ-01-005
ID
gmt text -F+f7p+jML <<'LEGEND'
55 246 All people: n=2,207
LEGEND
gmt basemap -R0.5/4.5/0/1000 -JX345p/175p -X55p -Y45p \
-Bpxcdata/classes-x.txt+l"Passenger class / crew" -Bpya200+l"People" -BWS
# BEGIN EXAMPLE
gmt plot data/classes.tsv -i0,1 -Sb56p+b0 -G#00549f -W0p
# END EXAMPLE
gmt end
Native build log
Download: Source · Source + data ZIP · SVG · PDF · PNG
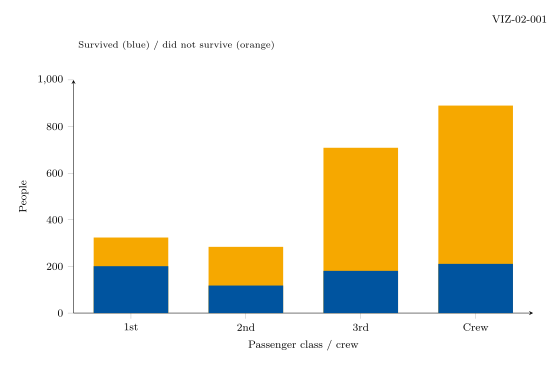
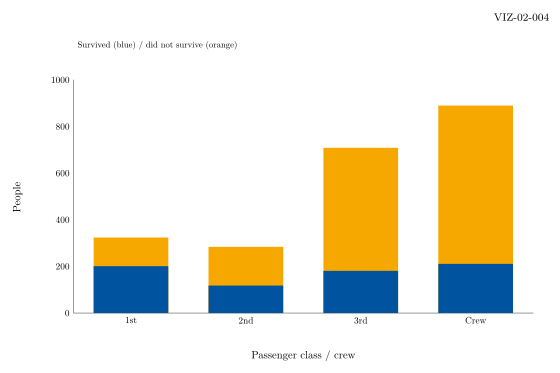
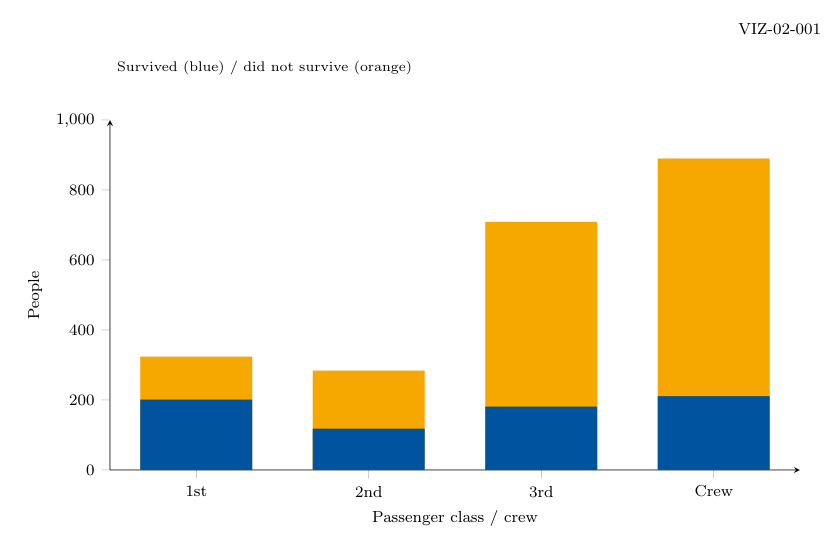
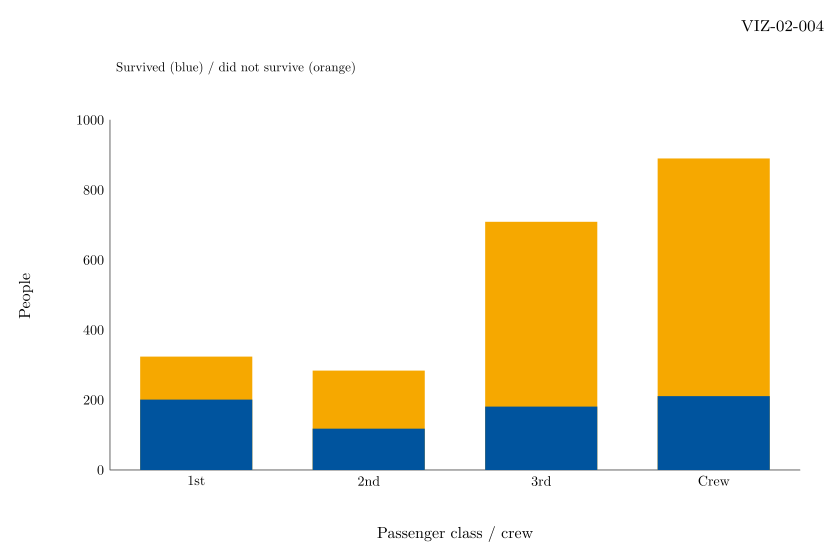
Copy link VIZ-02-001 PGFplots / TikZ: stacked The orange total forms the top and the blue survivor count forms the lower segment.
Back to comparison gallery Drawing commands \pgfplotstableread { data/classes.tsv} \Data
\begin { axis} [
width=345bp, height=175bp,
scale only axis, at={ (55bp,45bp)} ,
anchor=south west, xmin=0.5,
xmax=4.5, ymin=0,
ymax=1000, xtick={ 1,2,3,4} ,
ytick={ 0,200,400,600,800,1000} , xlabel={ Passenger class / crew} ,
ylabel={ People} , axis lines=left,
tick align=outside, enlargelimits=false,
clip=false, xticklabels={ 1st,2nd,3rd,Crew}
]
\addplot [ybar,bar shift=0pt,bar width=56bp,fill=Orange,draw=none]
table[x index=0,y index=1]{ data/classes.tsv} ;
\addplot [ybar,bar shift=0pt,bar width=56bp,fill=Blue,draw=none]
table[x index=0,y index=2]{ data/classes.tsv} ;
\end { axis}
Actual PGFplots / TikZ output VIZ-02-001 · native vector output PGFplots / TikZ · exit 0
Command or choice Meaning two ybar layersNative drawing method used here. classes.tsvShared numeric input; column definitions are in data/recipes.json. Fixed rangesSame axis domain and statistical definition in all five implementations.
Complete standalone program \documentclass [tikz,border=0pt] { standalone}
\usepackage { pgfplots,pgfplotstable}
\usepgfplotslibrary { statistics,groupplots}
\pgfplotsset { compat=1.18}
\definecolor { Blue}{ HTML}{ 00549F}
\definecolor { Teal}{ HTML}{ 00B1B7}
\definecolor { Orange}{ HTML}{ F6A800}
\definecolor { Wash}{ HTML}{ E8F1FA}
\definecolor { Missing}{ HTML}{ ECECED}
\begin { document}
\begin { tikzpicture} [font=\fontsize { 8}{ 10} \selectfont ]
\path [use as bounding box,fill=white] (0,0) rectangle (420bp,280bp);
\node [anchor=north east] at (414bp,272bp) { VIZ-02-001} ;
\node [anchor=west,font=\fontsize{7}{9}\selectfont] at
(55bp,246bp) { Survived (blue) / did not survive (orange)} ;
% BEGIN EXAMPLE
\pgfplotstableread { data/classes.tsv} \Data
\begin { axis} [
width=345bp, height=175bp,
scale only axis, at={ (55bp,45bp)} ,
anchor=south west, xmin=0.5,
xmax=4.5, ymin=0,
ymax=1000, xtick={ 1,2,3,4} ,
ytick={ 0,200,400,600,800,1000} , xlabel={ Passenger class / crew} ,
ylabel={ People} , axis lines=left,
tick align=outside, enlargelimits=false,
clip=false, xticklabels={ 1st,2nd,3rd,Crew}
]
\addplot [ybar,bar shift=0pt,bar width=56bp,fill=Orange,draw=none]
table[x index=0,y index=1]{ data/classes.tsv} ;
\addplot [ybar,bar shift=0pt,bar width=56bp,fill=Blue,draw=none]
table[x index=0,y index=2]{ data/classes.tsv} ;
\end { axis}
% END EXAMPLE
\end { tikzpicture}
\end { document}
Native build log Download: Source · Source + data ZIP · SVG · PDF · PNG
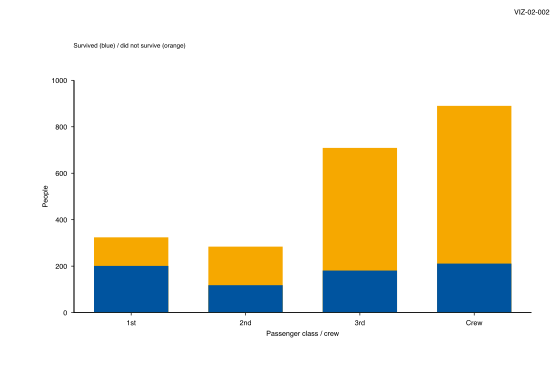
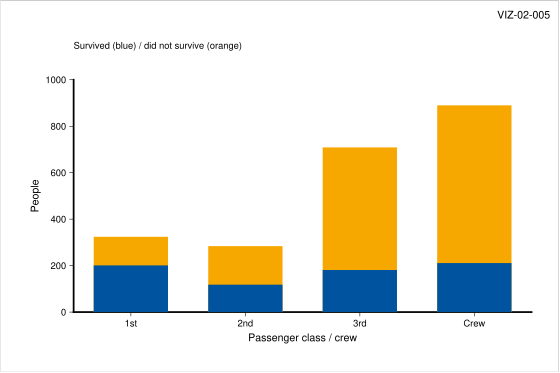
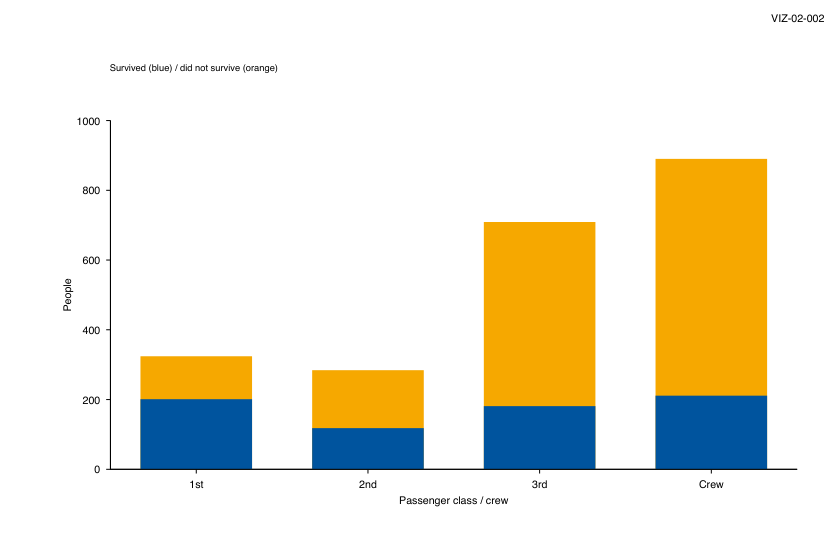
Copy link VIZ-02-002 gnuplot: stacked Draw the total in orange, then the survivor count in blue; the remaining upper segment equals non-survivors.
Back to comparison gallery Drawing commands set boxwidth .65 absolute
plot "data/classes.tsv" using 1 : 2 \
with boxes lc rgb "#f6a800" , \
"" using 1 : 3 \
with boxes lc rgb "#00549f"
Actual gnuplot output VIZ-02-002 · native vector output gnuplot · exit 0
Command or choice Meaning overlay boxesNative drawing method used here. classes.tsvShared numeric input; column definitions are in data/recipes.json. Fixed rangesSame axis domain and statistical definition in all five implementations.
Complete standalone program set terminal pdfcairo size 5.833333 in , 3.888889 in font "Helvetica,8"
set output "VIZ-02-002.pdf"
set lmargin at screen 0.13095238095238096
set rmargin at screen 0.9523809523809523
set bmargin at screen 0.16071428571428573
set tmargin at screen 0.7857142857142857
set xrange [ 0.5 : 4.5 ]
set yrange [ 0 : 1000 ]
set xtics ( "1st" 1 , "2nd" 2 , "3rd" 3 , "Crew" 4 )
set ytics ( "0" 0 , "200" 200 , "400" 400 , "600" 600 , "800" 800 , "1000" 1000 )
set xlabel "Passenger class / crew"
set ylabel "People"
set border 3
set tics out nomirror
unset key
set style fill solid 1.0 noborder
set label 1 "VIZ-02-002" at screen .985 , .97 right
set label 2 "Survived (blue) / did not survive (orange)" at screen .13 , .88 left font \
",7"
set palette defined ( 0 "#e8f1fa" , 100 "#00549f" )
set cbrange [ 0 : 100 ]
unset colorbox
# BEGIN EXAMPLE
set boxwidth .65 absolute
plot "data/classes.tsv" using 1 : 2 \
with boxes lc rgb "#f6a800" , \
"" using 1 : 3 \
with boxes lc rgb "#00549f"
# END EXAMPLE
unset output
Native build log
Download: Source · Source + data ZIP · SVG · PDF · PNG
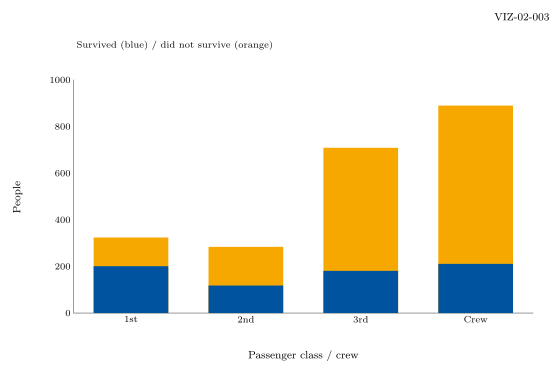
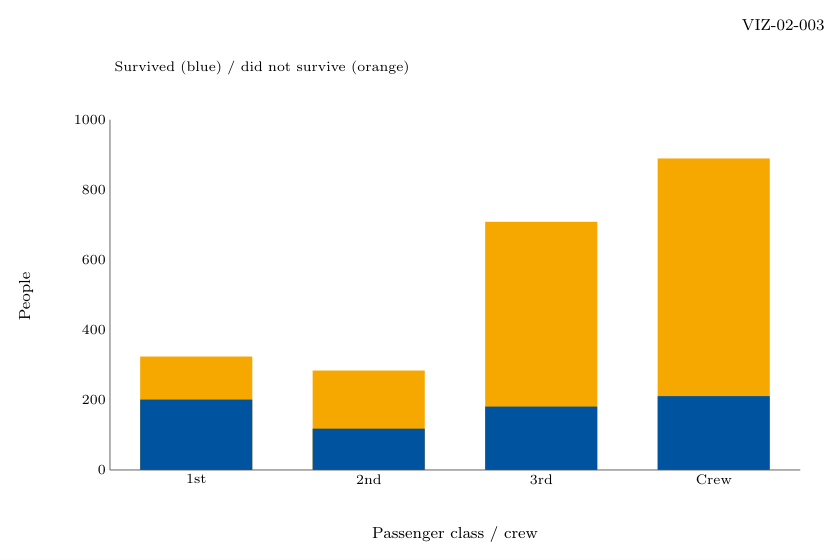
Copy link VIZ-02-003 Asymptote: stacked Asymptote reads the shared numeric table into typed arrays and draws this chart with paths, pens and physical-size symbols.
Back to comparison gallery Drawing commands real [][] d = input ( "data/classes.tsv" ). line ();
for ( int i = 0 ; i < d . length ; ++ i ) {
real [] v = d [ i ];
rect ( v [ 0 ] - .325 , 0 , v [ 0 ] + .325 , v [ 1 ], Orange );
rect ( v [ 0 ] - .325 , 0 , v [ 0 ] + .325 , v [ 2 ], Blue );
}
Actual Asymptote output VIZ-02-003 · native vector output Asymptote · exit 0
Command or choice Meaning arrays + native pathsNative drawing method used here. classes.tsvShared numeric input; column definitions are in data/recipes.json. Fixed rangesSame axis domain and statistical definition in all five implementations.
Complete standalone program import graph ;
size ( 420 bp , 280 bp , IgnoreAspect );
defaultpen ( fontsize ( 8 ));
pen Blue = rgb ( 0 , 84 / 255 , 159 / 255 ), Teal = rgb ( 0 , 177 / 255 , 183 / 255 );
pen Orange = rgb ( 246 / 255 , 168 / 255 , 0 ), Wash = rgb ( 232 / 255 , 241 / 255 , 250 / 255 );
pen Missing = rgb ( 236 / 255 , 236 / 255 , 237 / 255 );
pair P ( real x , real y ) {
return ( 55 + 345 * ( x - ( 0.5 )) / ( 4.0 ), 45 + 175 * ( y - ( 0 )) / ( 1000 ));
}
void rect ( real x , real y , real xx , real yy , pen p ) {
fill ( P ( x , y ) -- P ( xx , y ) -- P ( xx , yy ) -- P ( x , yy ) -- cycle , p );
}
fill ( box (( 0 , 0 ), ( 420 , 280 )), white );
label ( "VIZ-02-003" , ( 414 , 272 ), SW , fontsize ( 8 ));
label ( "Survived (blue) / did not survive (orange)" , ( 55 , 246 ), E , fontsize ( 7 ));
draw ( P ( 0.5 , 1000 ) -- P ( 0.5 , 0 ) -- P ( 4.5 , 0 ), gray ( .4 ));
label ( "1st" , P ( 1 , 0 ), S , fontsize ( 7 ));
label ( "2nd" , P ( 2 , 0 ), S , fontsize ( 7 ));
label ( "3rd" , P ( 3 , 0 ), S , fontsize ( 7 ));
label ( "Crew" , P ( 4 , 0 ), S , fontsize ( 7 ));
label ( "0" , P ( 0.5 , 0 ), W , fontsize ( 7 ));
label ( "200" , P ( 0.5 , 200 ), W , fontsize ( 7 ));
label ( "400" , P ( 0.5 , 400 ), W , fontsize ( 7 ));
label ( "600" , P ( 0.5 , 600 ), W , fontsize ( 7 ));
label ( "800" , P ( 0.5 , 800 ), W , fontsize ( 7 ));
label ( "1000" , P ( 0.5 , 1000 ), W , fontsize ( 7 ));
label ( "Passenger class / crew" , ( 227.5 , 13 ), fontsize ( 8 ));
label ( rotate ( 90 ) * Label ( "People" ), ( 13 , 132 ), fontsize ( 8 ));
// BEGIN EXAMPLE
real [][] d = input ( "data/classes.tsv" ). line ();
for ( int i = 0 ; i < d . length ; ++ i ) {
real [] v = d [ i ];
rect ( v [ 0 ] - .325 , 0 , v [ 0 ] + .325 , v [ 1 ], Orange );
rect ( v [ 0 ] - .325 , 0 , v [ 0 ] + .325 , v [ 2 ], Blue );
}
// END EXAMPLE
shipout ( "VIZ-02-003" , bbox ( 0 ));
Native build log
Download: Source · Source + data ZIP · SVG · PDF · PNG
Copy link VIZ-02-004 MetaPost: stacked MetaPost reads numeric fields with gdata and scantokens, then constructs the chart with paths, TeX labels and colour interpolation.
Back to comparison gallery Drawing commands numeric n , v [][];
n := 0 ;
gdata ( "data/classes.tsv" , c ,
n := n + 1 ;
for j = 1 upto 12 :
v [ n ][ j ] := scantokens c [ j ];
endfor
);
for k = 1 upto n :
rect ( v [ k ][ 1 ] - .325 , 0 , v [ k ][ 1 ] + .325 , v [ k ][ 2 ], Orange );
rect ( v [ k ][ 1 ] - .325 , 0 , v [ k ][ 1 ] + .325 , v [ k ][ 3 ], Blue );
endfor
Actual MetaPost output VIZ-02-004 · native vector output MetaPost · exit 0
Command or choice Meaning gdata + pathsNative drawing method used here. classes.tsvShared numeric input; column definitions are in data/recipes.json. Fixed rangesSame axis domain and statistical definition in all five implementations.
Complete standalone program input graph ;
prologues := 3 ;
outputformat := "svg" ;
outputtemplate := "VIZ-02-004.svg" ;
color Blue , Teal , Orange , Wash , Missing ;
Blue := ( 0 , 84 / 255 , 159 / 255 );
Teal := ( 0 , 177 / 255 , 183 / 255 );
Orange := ( 246 / 255 , 168 / 255 , 0 );
Wash := ( 232 / 255 , 241 / 255 , 250 / 255 );
Missing := ( 236 / 255 , 236 / 255 , 237 / 255 );
vardef P ( expr x , y ) =
( 55 + 345 * ( x - ( 0.5 )) / ( 4.0 ), 45 + 175 * ( y - ( 0 )) / ( 1000 ))
enddef ;
def rect ( expr x , y , xx , yy , col ) =
fill P ( x , y ) -- P ( xx , y ) -- P ( xx , yy ) -- P ( x , yy ) -- cycle withcolor col ;
enddef ;
beginfig ( 1 );
fill unitsquare xscaled 420 yscaled 280 withcolor white ;
label .llft ( "VIZ-02-004" infont "cmr8" , ( 414 , 272 ));
label .rt ( btex Survived (blue) / did not survive (orange) etex scaled .65 , ( 55 ,
246 ));
draw P ( 0.5 , 1000 ) -- P ( 0.5 , 0 ) -- P ( 4.5 , 0 ) withcolor .4 white ;
label .bot ( btex 1st etex scaled .7 , P ( 1 , 0 ));
label .bot ( btex 2nd etex scaled .7 , P ( 2 , 0 ));
label .bot ( btex 3rd etex scaled .7 , P ( 3 , 0 ));
label .bot ( btex Crew etex scaled .7 , P ( 4 , 0 ));
label .lft ( btex 0 etex scaled .7 , P ( 0.5 , 0 ));
label .lft ( btex 200 etex scaled .7 , P ( 0.5 , 200 ));
label .lft ( btex 400 etex scaled .7 , P ( 0.5 , 400 ));
label .lft ( btex 600 etex scaled .7 , P ( 0.5 , 600 ));
label .lft ( btex 800 etex scaled .7 , P ( 0.5 , 800 ));
label .lft ( btex 1000 etex scaled .7 , P ( 0.5 , 1000 ));
label ( btex Passenger class / crew etex scaled .8 , ( 227.5 , 13 ));
label ( btex People etex scaled .8 rotated 90 , ( 13 , 132 ));
% BEGIN EXAMPLE
numeric n , v [][];
n := 0 ;
gdata ( "data/classes.tsv" , c ,
n := n + 1 ;
for j = 1 upto 12 :
v [ n ][ j ] := scantokens c [ j ];
endfor
);
for k = 1 upto n :
rect ( v [ k ][ 1 ] - .325 , 0 , v [ k ][ 1 ] + .325 , v [ k ][ 2 ], Orange );
rect ( v [ k ][ 1 ] - .325 , 0 , v [ k ][ 1 ] + .325 , v [ k ][ 3 ], Blue );
endfor
% END EXAMPLE
setbounds currentpicture to unitsquare xscaled 420 yscaled 280 ;
endfig ;
end .
Native build log Download: Source · Source + data ZIP · SVG · PDF · PNG
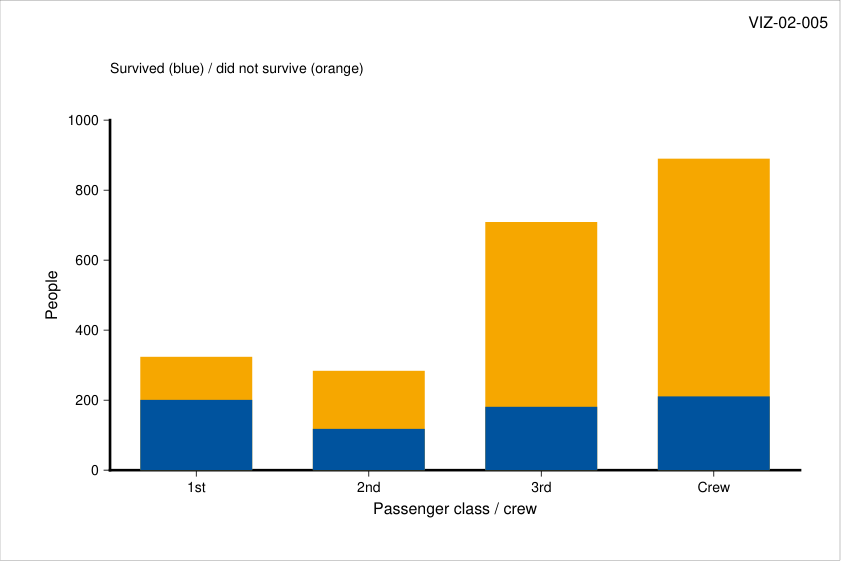
Copy link VIZ-02-005 GMT: stacked GMT reads selected columns through its native plotting modules; column expressions are performed by the shown local awk pipeline. The shared tables determine the statistics.
Back to comparison gallery Drawing commands plot data/classes.tsv -i0,1 -Sb56p+b0 -G#f6a800
gmt plot data/classes.tsv -i0,2 -Sb56p+b0 -G#00549f
Actual GMT output VIZ-02-005 · native vector output GMT · exit 0
Command or choice Meaning layered plot -SbNative drawing method used here. classes.tsvShared numeric input; column definitions are in data/recipes.json. Fixed rangesSame axis domain and statistical definition in all five implementations.
Complete standalone program #!/usr/bin/env bash
set -euo pipefail
export GMT_USERDIR = " $PWD /.gmt"
mkdir -p " $GMT_USERDIR "
gmt begin VIZ-02-005 pdf
gmt set \
FONT_ANNOT_PRIMARY 7p \
FONT_LABEL 8p \
FONT_TITLE 8p \
MAP_TITLE_OFFSET 4p \
MAP_FRAME_TYPE plain \
MAP_TICK_LENGTH_PRIMARY 3p
gmt plot -R0/420/0/280 -JX420p/280p -Gwhite -W0p <<'CANVAS'
0 0
420 0
420 280
0 280
CANVAS
gmt text -F+f8p+jTR <<'ID'
414 272 VIZ-02-005
ID
gmt text -F+f7p+jML <<'LEGEND'
55 246 Survived (blue) / did not survive (orange)
LEGEND
gmt basemap -R0.5/4.5/0/1000 -JX345p/175p -X55p -Y45p \
-Bpxcdata/classes-x.txt+l"Passenger class / crew" -Bpya200+l"People" -BWS
# BEGIN EXAMPLE
gmt plot data/classes.tsv -i0,1 -Sb56p+b0 -G#f6a800
gmt plot data/classes.tsv -i0,2 -Sb56p+b0 -G#00549f
# END EXAMPLE
gmt end
Native build log
Download: Source · Source + data ZIP · SVG · PDF · PNG
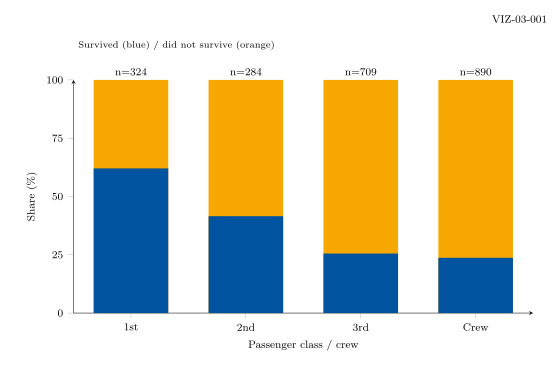
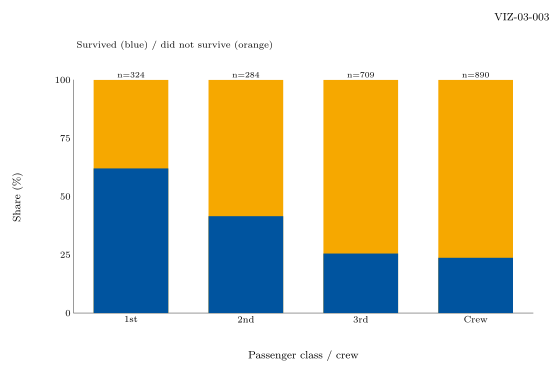
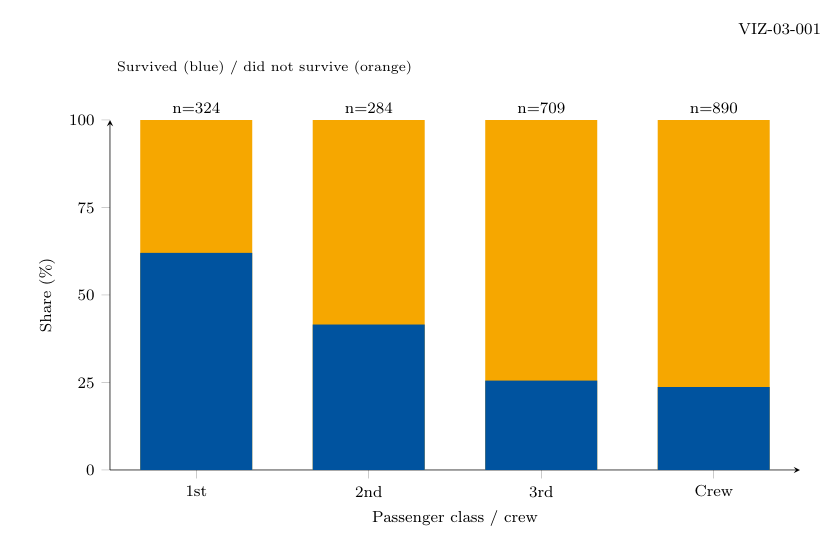
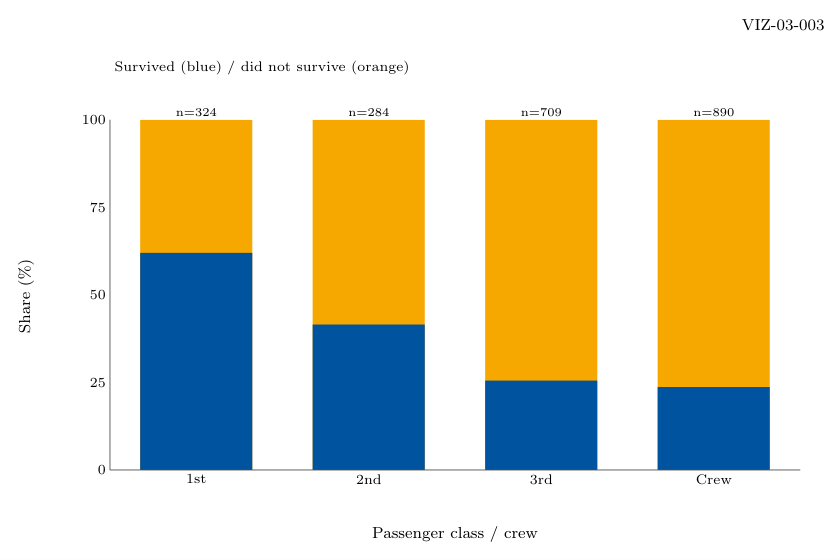
Copy link VIZ-03-001 PGFplots / TikZ: proportions A constant 100-percent background and the shared survival rates retain each denominator as a label.
Back to comparison gallery Drawing commands \pgfplotstableread { data/classes.tsv} \Data
\begin { axis} [
width=345bp, height=175bp,
scale only axis, at={ (55bp,45bp)} ,
anchor=south west, xmin=0.5,
xmax=4.5, ymin=0,
ymax=100, xtick={ 1,2,3,4} ,
ytick={ 0,25,50,75,100} , xlabel={ Passenger class / crew} ,
ylabel={ Share (\% )} , axis lines=left,
tick align=outside, enlargelimits=false,
clip=false, xticklabels={ 1st,2nd,3rd,Crew}
]
\addplot [ybar,bar shift=0pt,bar width=56bp,fill=Orange,draw=none]
table[x index=0,y expr=100]{ data/classes.tsv} ;
\addplot [ybar,bar shift=0pt,bar width=56bp,fill=Blue,draw=none]
table[x index=0,y index=4]{ data/classes.tsv} ;
\addplot [
only marks,
mark=none,
nodes near coords={
n=\pgfmathprintnumber [fixed,precision=0] { \pgfplotspointmeta }} ,
point meta=explicit
]
table[x index=0,y expr=100,meta index=1]{ data/classes.tsv} ;
\end { axis}
Actual PGFplots / TikZ output VIZ-03-001 · native vector output PGFplots / TikZ · exit 0
Command or choice Meaning y expr + nodes near coordsNative drawing method used here. classes.tsvShared numeric input; column definitions are in data/recipes.json. Fixed rangesSame axis domain and statistical definition in all five implementations.
Complete standalone program \documentclass [tikz,border=0pt] { standalone}
\usepackage { pgfplots,pgfplotstable}
\usepgfplotslibrary { statistics,groupplots}
\pgfplotsset { compat=1.18}
\definecolor { Blue}{ HTML}{ 00549F}
\definecolor { Teal}{ HTML}{ 00B1B7}
\definecolor { Orange}{ HTML}{ F6A800}
\definecolor { Wash}{ HTML}{ E8F1FA}
\definecolor { Missing}{ HTML}{ ECECED}
\begin { document}
\begin { tikzpicture} [font=\fontsize { 8}{ 10} \selectfont ]
\path [use as bounding box,fill=white] (0,0) rectangle (420bp,280bp);
\node [anchor=north east] at (414bp,272bp) { VIZ-03-001} ;
\node [anchor=west,font=\fontsize{7}{9}\selectfont] at
(55bp,246bp) { Survived (blue) / did not survive (orange)} ;
% BEGIN EXAMPLE
\pgfplotstableread { data/classes.tsv} \Data
\begin { axis} [
width=345bp, height=175bp,
scale only axis, at={ (55bp,45bp)} ,
anchor=south west, xmin=0.5,
xmax=4.5, ymin=0,
ymax=100, xtick={ 1,2,3,4} ,
ytick={ 0,25,50,75,100} , xlabel={ Passenger class / crew} ,
ylabel={ Share (\% )} , axis lines=left,
tick align=outside, enlargelimits=false,
clip=false, xticklabels={ 1st,2nd,3rd,Crew}
]
\addplot [ybar,bar shift=0pt,bar width=56bp,fill=Orange,draw=none]
table[x index=0,y expr=100]{ data/classes.tsv} ;
\addplot [ybar,bar shift=0pt,bar width=56bp,fill=Blue,draw=none]
table[x index=0,y index=4]{ data/classes.tsv} ;
\addplot [
only marks,
mark=none,
nodes near coords={
n=\pgfmathprintnumber [fixed,precision=0] { \pgfplotspointmeta }} ,
point meta=explicit
]
table[x index=0,y expr=100,meta index=1]{ data/classes.tsv} ;
\end { axis}
% END EXAMPLE
\end { tikzpicture}
\end { document}
Native build log Download: Source · Source + data ZIP · SVG · PDF · PNG
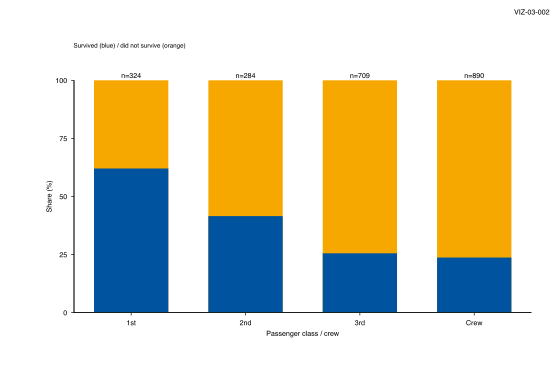
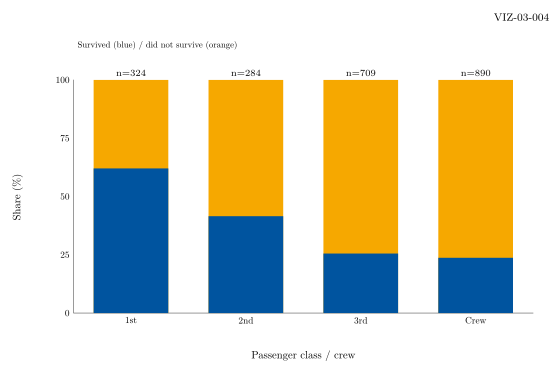
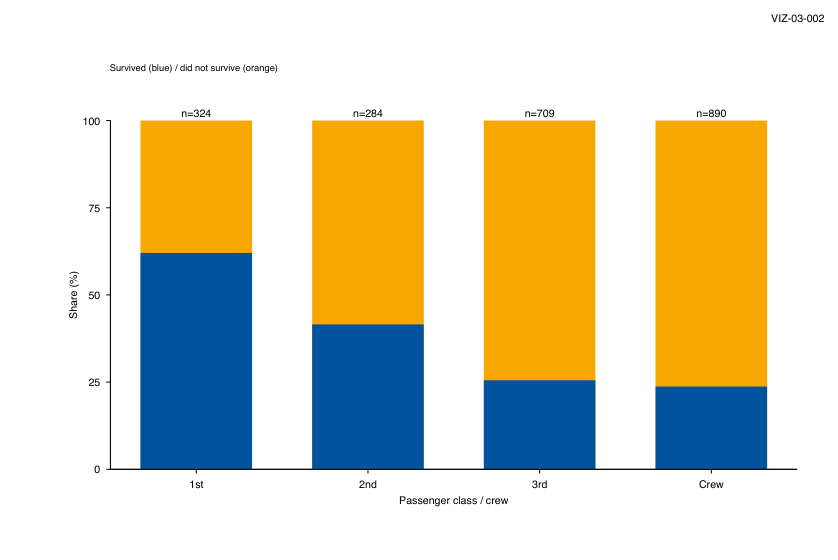
Copy link VIZ-03-002 gnuplot: proportions The 100-percent base, survival column and denominator labels create a normalized comparison.
Back to comparison gallery Drawing commands set boxwidth .65 absolute
plot "data/classes.tsv" using 1 : ( 100 ) \
with boxes lc rgb "#f6a800" , \
"" using 1 : 5 \
with boxes lc rgb "#00549f" , \
"" using 1 : ( 100 ) : ( sprintf ( "n=%d" , $ 2 )) \
with labels offset 0 , .7
Actual gnuplot output VIZ-03-002 · native vector output gnuplot · exit 0
Command or choice Meaning using expressions + labelsNative drawing method used here. classes.tsvShared numeric input; column definitions are in data/recipes.json. Fixed rangesSame axis domain and statistical definition in all five implementations.
Complete standalone program set terminal pdfcairo size 5.833333 in , 3.888889 in font "Helvetica,8"
set output "VIZ-03-002.pdf"
set lmargin at screen 0.13095238095238096
set rmargin at screen 0.9523809523809523
set bmargin at screen 0.16071428571428573
set tmargin at screen 0.7857142857142857
set xrange [ 0.5 : 4.5 ]
set yrange [ 0 : 100 ]
set xtics ( "1st" 1 , "2nd" 2 , "3rd" 3 , "Crew" 4 )
set ytics ( "0" 0 , "25" 25 , "50" 50 , "75" 75 , "100" 100 )
set xlabel "Passenger class / crew"
set ylabel "Share (%)"
set border 3
set tics out nomirror
unset key
set style fill solid 1.0 noborder
set label 1 "VIZ-03-002" at screen .985 , .97 right
set label 2 "Survived (blue) / did not survive (orange)" at screen .13 , .88 left font \
",7"
set palette defined ( 0 "#e8f1fa" , 100 "#00549f" )
set cbrange [ 0 : 100 ]
unset colorbox
# BEGIN EXAMPLE
set boxwidth .65 absolute
plot "data/classes.tsv" using 1 : ( 100 ) \
with boxes lc rgb "#f6a800" , \
"" using 1 : 5 \
with boxes lc rgb "#00549f" , \
"" using 1 : ( 100 ) : ( sprintf ( "n=%d" , $ 2 )) \
with labels offset 0 , .7
# END EXAMPLE
unset output
Native build log
Download: Source · Source + data ZIP · SVG · PDF · PNG
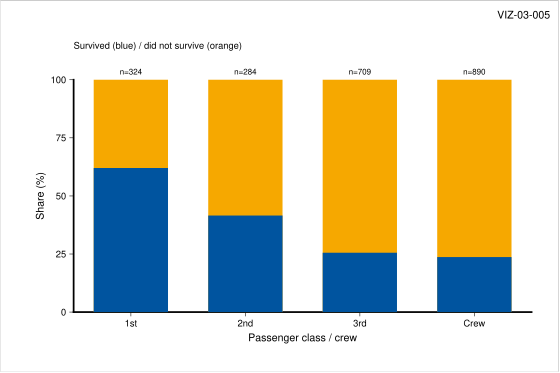
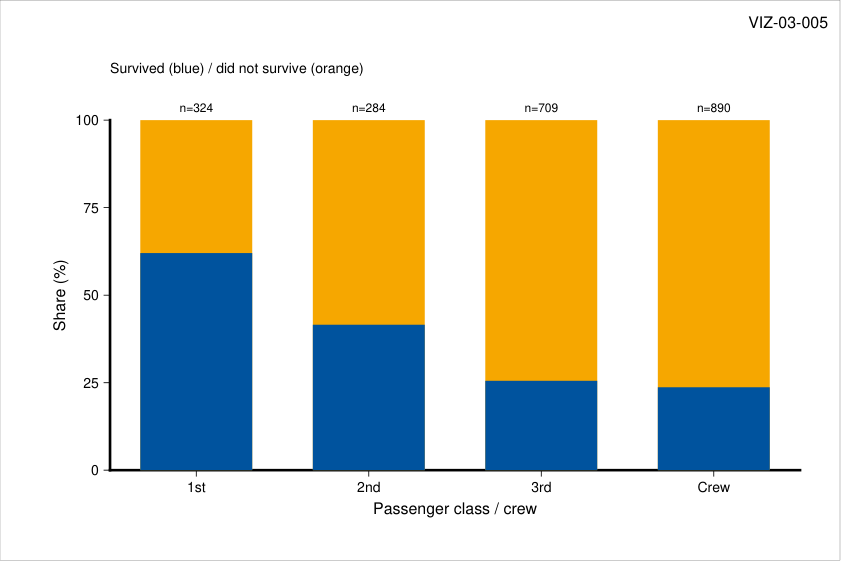
Copy link VIZ-03-003 Asymptote: proportions Asymptote reads the shared numeric table into typed arrays and draws this chart with paths, pens and physical-size symbols.
Back to comparison gallery Drawing commands real [][] d = input ( "data/classes.tsv" ). line ();
for ( int i = 0 ; i < d . length ; ++ i ) {
real [] v = d [ i ];
rect ( v [ 0 ] - .325 , 0 , v [ 0 ] + .325 , 100 , Orange );
rect ( v [ 0 ] - .325 , 0 , v [ 0 ] + .325 , v [ 4 ], Blue );
label ( "n=" + string (( int ) v [ 1 ]), P ( v [ 0 ], 100 ), N , fontsize ( 6 ));
}
Actual Asymptote output VIZ-03-003 · native vector output Asymptote · exit 0
Command or choice Meaning arrays + native pathsNative drawing method used here. classes.tsvShared numeric input; column definitions are in data/recipes.json. Fixed rangesSame axis domain and statistical definition in all five implementations.
Complete standalone program import graph ;
size ( 420 bp , 280 bp , IgnoreAspect );
defaultpen ( fontsize ( 8 ));
pen Blue = rgb ( 0 , 84 / 255 , 159 / 255 ), Teal = rgb ( 0 , 177 / 255 , 183 / 255 );
pen Orange = rgb ( 246 / 255 , 168 / 255 , 0 ), Wash = rgb ( 232 / 255 , 241 / 255 , 250 / 255 );
pen Missing = rgb ( 236 / 255 , 236 / 255 , 237 / 255 );
pair P ( real x , real y ) {
return ( 55 + 345 * ( x - ( 0.5 )) / ( 4.0 ), 45 + 175 * ( y - ( 0 )) / ( 100 ));
}
void rect ( real x , real y , real xx , real yy , pen p ) {
fill ( P ( x , y ) -- P ( xx , y ) -- P ( xx , yy ) -- P ( x , yy ) -- cycle , p );
}
fill ( box (( 0 , 0 ), ( 420 , 280 )), white );
label ( "VIZ-03-003" , ( 414 , 272 ), SW , fontsize ( 8 ));
label ( "Survived (blue) / did not survive (orange)" , ( 55 , 246 ), E , fontsize ( 7 ));
draw ( P ( 0.5 , 100 ) -- P ( 0.5 , 0 ) -- P ( 4.5 , 0 ), gray ( .4 ));
label ( "1st" , P ( 1 , 0 ), S , fontsize ( 7 ));
label ( "2nd" , P ( 2 , 0 ), S , fontsize ( 7 ));
label ( "3rd" , P ( 3 , 0 ), S , fontsize ( 7 ));
label ( "Crew" , P ( 4 , 0 ), S , fontsize ( 7 ));
label ( "0" , P ( 0.5 , 0 ), W , fontsize ( 7 ));
label ( "25" , P ( 0.5 , 25 ), W , fontsize ( 7 ));
label ( "50" , P ( 0.5 , 50 ), W , fontsize ( 7 ));
label ( "75" , P ( 0.5 , 75 ), W , fontsize ( 7 ));
label ( "100" , P ( 0.5 , 100 ), W , fontsize ( 7 ));
label ( "Passenger class / crew" , ( 227.5 , 13 ), fontsize ( 8 ));
label ( rotate ( 90 ) * Label ( "Share (\%)" ), ( 13 , 132 ), fontsize ( 8 ));
// BEGIN EXAMPLE
real [][] d = input ( "data/classes.tsv" ). line ();
for ( int i = 0 ; i < d . length ; ++ i ) {
real [] v = d [ i ];
rect ( v [ 0 ] - .325 , 0 , v [ 0 ] + .325 , 100 , Orange );
rect ( v [ 0 ] - .325 , 0 , v [ 0 ] + .325 , v [ 4 ], Blue );
label ( "n=" + string (( int ) v [ 1 ]), P ( v [ 0 ], 100 ), N , fontsize ( 6 ));
}
// END EXAMPLE
shipout ( "VIZ-03-003" , bbox ( 0 ));
Native build log
Download: Source · Source + data ZIP · SVG · PDF · PNG
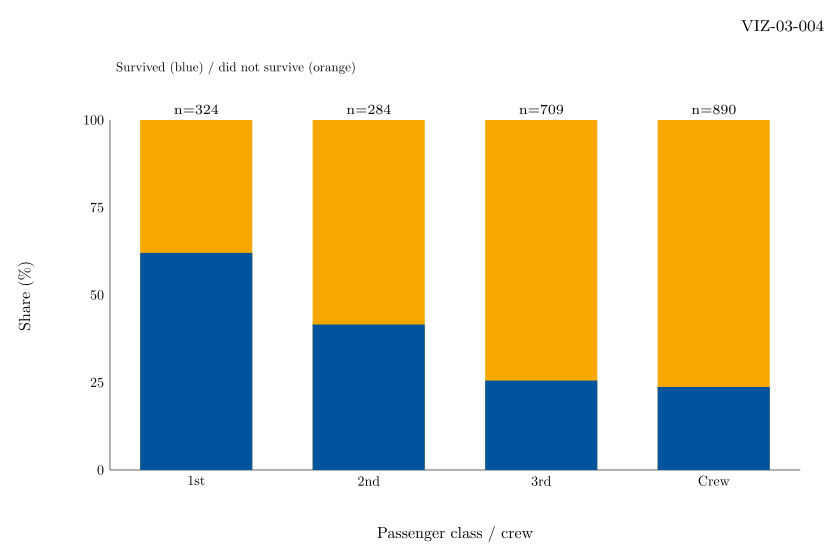
Copy link VIZ-03-004 MetaPost: proportions MetaPost reads numeric fields with gdata and scantokens, then constructs the chart with paths, TeX labels and colour interpolation.
Back to comparison gallery Drawing commands numeric n , v [][];
n := 0 ;
gdata ( "data/classes.tsv" , c ,
n := n + 1 ;
for j = 1 upto 12 :
v [ n ][ j ] := scantokens c [ j ];
endfor
);
for k = 1 upto n :
rect ( v [ k ][ 1 ] - .325 , 0 , v [ k ][ 1 ] + .325 , 100 , Orange );
rect ( v [ k ][ 1 ] - .325 , 0 , v [ k ][ 1 ] + .325 , v [ k ][ 5 ], Blue );
label .top (( "n=" & decimal v [ k ][ 2 ]) infont "cmr7" , P ( v [ k ][ 1 ], 100 ));
endfor
Actual MetaPost output VIZ-03-004 · native vector output MetaPost · exit 0
Command or choice Meaning gdata + pathsNative drawing method used here. classes.tsvShared numeric input; column definitions are in data/recipes.json. Fixed rangesSame axis domain and statistical definition in all five implementations.
Complete standalone program input graph ;
prologues := 3 ;
outputformat := "svg" ;
outputtemplate := "VIZ-03-004.svg" ;
color Blue , Teal , Orange , Wash , Missing ;
Blue := ( 0 , 84 / 255 , 159 / 255 );
Teal := ( 0 , 177 / 255 , 183 / 255 );
Orange := ( 246 / 255 , 168 / 255 , 0 );
Wash := ( 232 / 255 , 241 / 255 , 250 / 255 );
Missing := ( 236 / 255 , 236 / 255 , 237 / 255 );
vardef P ( expr x , y ) =
( 55 + 345 * ( x - ( 0.5 )) / ( 4.0 ), 45 + 175 * ( y - ( 0 )) / ( 100 ))
enddef ;
def rect ( expr x , y , xx , yy , col ) =
fill P ( x , y ) -- P ( xx , y ) -- P ( xx , yy ) -- P ( x , yy ) -- cycle withcolor col ;
enddef ;
beginfig ( 1 );
fill unitsquare xscaled 420 yscaled 280 withcolor white ;
label .llft ( "VIZ-03-004" infont "cmr8" , ( 414 , 272 ));
label .rt ( btex Survived (blue) / did not survive (orange) etex scaled .65 , ( 55 ,
246 ));
draw P ( 0.5 , 100 ) -- P ( 0.5 , 0 ) -- P ( 4.5 , 0 ) withcolor .4 white ;
label .bot ( btex 1st etex scaled .7 , P ( 1 , 0 ));
label .bot ( btex 2nd etex scaled .7 , P ( 2 , 0 ));
label .bot ( btex 3rd etex scaled .7 , P ( 3 , 0 ));
label .bot ( btex Crew etex scaled .7 , P ( 4 , 0 ));
label .lft ( btex 0 etex scaled .7 , P ( 0.5 , 0 ));
label .lft ( btex 25 etex scaled .7 , P ( 0.5 , 25 ));
label .lft ( btex 50 etex scaled .7 , P ( 0.5 , 50 ));
label .lft ( btex 75 etex scaled .7 , P ( 0.5 , 75 ));
label .lft ( btex 100 etex scaled .7 , P ( 0.5 , 100 ));
label ( btex Passenger class / crew etex scaled .8 , ( 227.5 , 13 ));
label ( btex Share (\%) etex scaled .8 rotated 90 , ( 13 , 132 ));
% BEGIN EXAMPLE
numeric n , v [][];
n := 0 ;
gdata ( "data/classes.tsv" , c ,
n := n + 1 ;
for j = 1 upto 12 :
v [ n ][ j ] := scantokens c [ j ];
endfor
);
for k = 1 upto n :
rect ( v [ k ][ 1 ] - .325 , 0 , v [ k ][ 1 ] + .325 , 100 , Orange );
rect ( v [ k ][ 1 ] - .325 , 0 , v [ k ][ 1 ] + .325 , v [ k ][ 5 ], Blue );
label .top (( "n=" & decimal v [ k ][ 2 ]) infont "cmr7" , P ( v [ k ][ 1 ], 100 ));
endfor
% END EXAMPLE
setbounds currentpicture to unitsquare xscaled 420 yscaled 280 ;
endfig ;
end .
Native build log Download: Source · Source + data ZIP · SVG · PDF · PNG
Copy link VIZ-03-005 GMT: proportions GMT reads selected columns through its native plotting modules; column expressions are performed by the shown local awk pipeline. The shared tables determine the statistics.
Back to comparison gallery Drawing commands '{print $1,100}' data/classes.tsv | gmt plot -Sb56p+b0 -G#f6a800
gmt plot data/classes.tsv -i0,4 -Sb56p+b0 -G#00549f
awk '{print $1,100,"n=" $2}' data/classes.tsv | gmt text -F+f6p+jBC -D0/4p -N
Actual GMT output VIZ-03-005 · native vector output GMT · exit 0
Command or choice Meaning awk + plot -Sb + textNative drawing method used here. classes.tsvShared numeric input; column definitions are in data/recipes.json. Fixed rangesSame axis domain and statistical definition in all five implementations.
Complete standalone program #!/usr/bin/env bash
set -euo pipefail
export GMT_USERDIR = " $PWD /.gmt"
mkdir -p " $GMT_USERDIR "
gmt begin VIZ-03-005 pdf
gmt set \
FONT_ANNOT_PRIMARY 7p \
FONT_LABEL 8p \
FONT_TITLE 8p \
MAP_TITLE_OFFSET 4p \
MAP_FRAME_TYPE plain \
MAP_TICK_LENGTH_PRIMARY 3p
gmt plot -R0/420/0/280 -JX420p/280p -Gwhite -W0p <<'CANVAS'
0 0
420 0
420 280
0 280
CANVAS
gmt text -F+f8p+jTR <<'ID'
414 272 VIZ-03-005
ID
gmt text -F+f7p+jML <<'LEGEND'
55 246 Survived (blue) / did not survive (orange)
LEGEND
gmt basemap -R0.5/4.5/0/100 -JX345p/175p -X55p -Y45p \
-Bpxcdata/classes-x.txt+l"Passenger class / crew" -Bpya25+l"Share (%)" -BWS
# BEGIN EXAMPLE
awk '{print $1,100}' data/classes.tsv | gmt plot -Sb56p+b0 -G#f6a800
gmt plot data/classes.tsv -i0,4 -Sb56p+b0 -G#00549f
awk '{print $1,100,"n=" $2}' data/classes.tsv | gmt text -F+f6p+jBC -D0/4p -N
# END EXAMPLE
gmt end
Native build log
Download: Source · Source + data ZIP · SVG · PDF · PNG
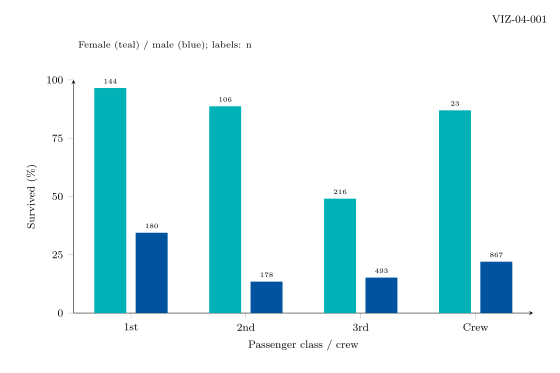
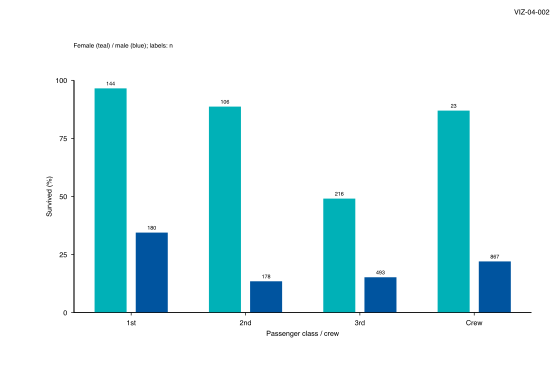
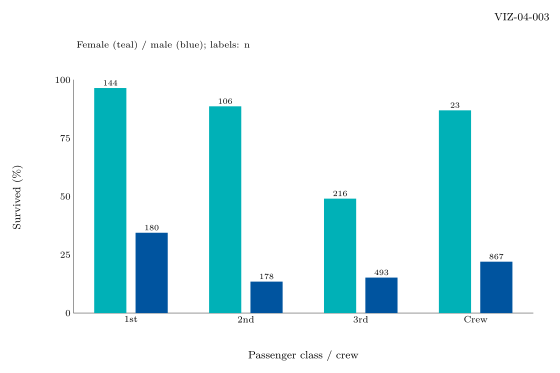
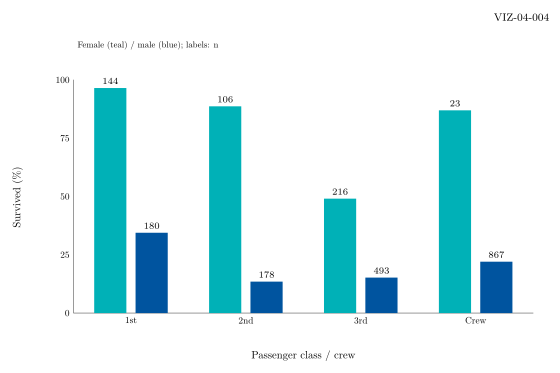
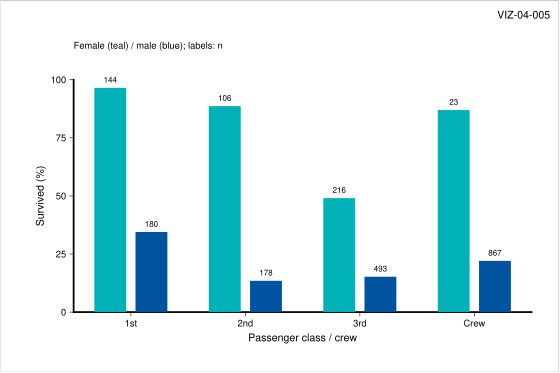
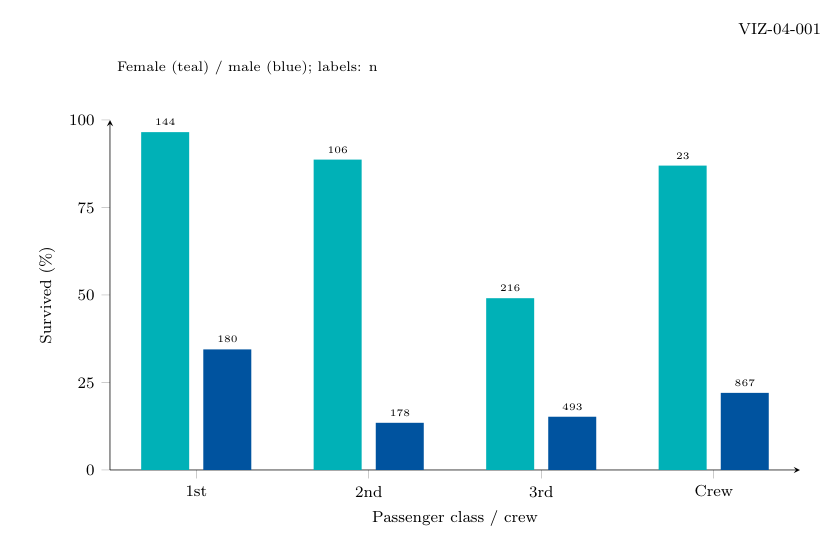
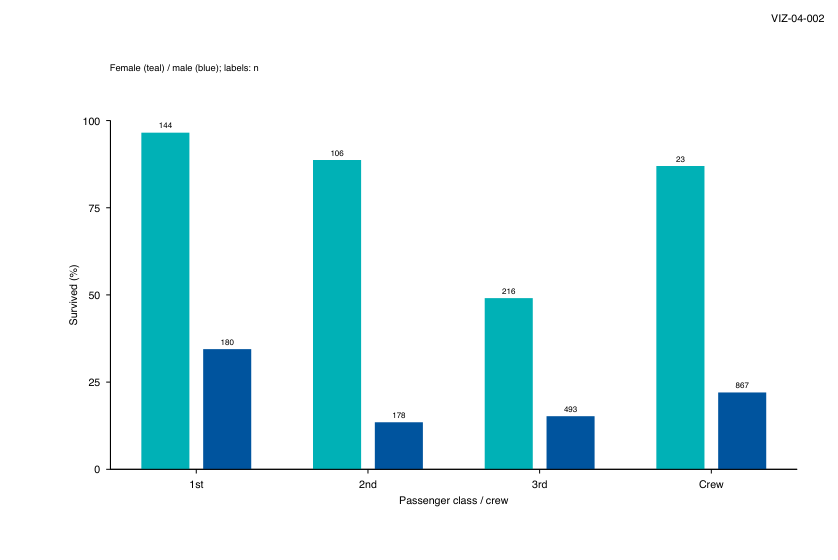
Copy link VIZ-04-001 PGFplots / TikZ: grouped Column expressions offset the two series; metadata labels show their separate denominators.
Back to comparison gallery Drawing commands \pgfplotstableread { data/classes.tsv} \Data
\begin { axis} [
width=345bp, height=175bp,
scale only axis, at={ (55bp,45bp)} ,
anchor=south west, xmin=0.5,
xmax=4.5, ymin=0,
ymax=100, xtick={ 1,2,3,4} ,
ytick={ 0,25,50,75,100} , xlabel={ Passenger class / crew} ,
ylabel={ Survived (\% )} , axis lines=left,
tick align=outside, enlargelimits=false,
clip=false, xticklabels={ 1st,2nd,3rd,Crew}
]
\addplot [
ybar,
bar shift=0pt,
bar width=24bp,
fill=Teal,
draw=none,
nodes near coords={ \pgfmathprintnumber [fixed,precision=0] { \pgfplotspointmeta }} ,
point meta=explicit,
every node near coord/.append style={ font=\tiny }
]
table[x expr=\thisrowno { 0} +(-0.18),y index=7,meta index=5]{ data/classes.tsv} ;
\addplot [
ybar,
bar shift=0pt,
bar width=24bp,
fill=Blue,
draw=none,
nodes near coords={ \pgfmathprintnumber [fixed,precision=0] { \pgfplotspointmeta }} ,
point meta=explicit,
every node near coord/.append style={ font=\tiny }
]
table[x expr=\thisrowno { 0} +(0.18),y index=10,meta index=8]{ data/classes.tsv} ;
\end { axis}
Actual PGFplots / TikZ output VIZ-04-001 · native vector output PGFplots / TikZ · exit 0
Command or choice Meaning x expr + explicit metadataNative drawing method used here. classes.tsvShared numeric input; column definitions are in data/recipes.json. Fixed rangesSame axis domain and statistical definition in all five implementations.
Complete standalone program \documentclass [tikz,border=0pt] { standalone}
\usepackage { pgfplots,pgfplotstable}
\usepgfplotslibrary { statistics,groupplots}
\pgfplotsset { compat=1.18}
\definecolor { Blue}{ HTML}{ 00549F}
\definecolor { Teal}{ HTML}{ 00B1B7}
\definecolor { Orange}{ HTML}{ F6A800}
\definecolor { Wash}{ HTML}{ E8F1FA}
\definecolor { Missing}{ HTML}{ ECECED}
\begin { document}
\begin { tikzpicture} [font=\fontsize { 8}{ 10} \selectfont ]
\path [use as bounding box,fill=white] (0,0) rectangle (420bp,280bp);
\node [anchor=north east] at (414bp,272bp) { VIZ-04-001} ;
\node [anchor=west,font=\fontsize{7}{9}\selectfont] at
(55bp,246bp) { Female (teal) / male (blue); labels: n} ;
% BEGIN EXAMPLE
\pgfplotstableread { data/classes.tsv} \Data
\begin { axis} [
width=345bp, height=175bp,
scale only axis, at={ (55bp,45bp)} ,
anchor=south west, xmin=0.5,
xmax=4.5, ymin=0,
ymax=100, xtick={ 1,2,3,4} ,
ytick={ 0,25,50,75,100} , xlabel={ Passenger class / crew} ,
ylabel={ Survived (\% )} , axis lines=left,
tick align=outside, enlargelimits=false,
clip=false, xticklabels={ 1st,2nd,3rd,Crew}
]
\addplot [
ybar,
bar shift=0pt,
bar width=24bp,
fill=Teal,
draw=none,
nodes near coords={ \pgfmathprintnumber [fixed,precision=0] { \pgfplotspointmeta }} ,
point meta=explicit,
every node near coord/.append style={ font=\tiny }
]
table[x expr=\thisrowno { 0} +(-0.18),y index=7,meta index=5]{ data/classes.tsv} ;
\addplot [
ybar,
bar shift=0pt,
bar width=24bp,
fill=Blue,
draw=none,
nodes near coords={ \pgfmathprintnumber [fixed,precision=0] { \pgfplotspointmeta }} ,
point meta=explicit,
every node near coord/.append style={ font=\tiny }
]
table[x expr=\thisrowno { 0} +(0.18),y index=10,meta index=8]{ data/classes.tsv} ;
\end { axis}
% END EXAMPLE
\end { tikzpicture}
\end { document}
Native build log Download: Source · Source + data ZIP · SVG · PDF · PNG
Copy link VIZ-04-002 gnuplot: grouped Offset female and male rates to either side of the class centre; keep n visible.
Back to comparison gallery Drawing commands set boxwidth .28 absolute
plot "data/classes.tsv" using ( $ 1 - .18 ) : 8 \
with boxes lc rgb "#00b1b7" , \
"" using ( $ 1 + .18 ) : 11 \
with boxes lc rgb "#00549f" , \
"" using ( $ 1 - .18 ) : 8 : ( sprintf ( "%d" , $ 6 )) \
with labels offset 0 , .7 font ",6" , \
"" using ( $ 1 + .18 ) : 11 : ( sprintf ( "%d" , $ 9 )) \
with labels offset 0 , .7 font ",6"
Actual gnuplot output VIZ-04-002 · native vector output gnuplot · exit 0
Command or choice Meaning using shifted columnsNative drawing method used here. classes.tsvShared numeric input; column definitions are in data/recipes.json. Fixed rangesSame axis domain and statistical definition in all five implementations.
Complete standalone program set terminal pdfcairo size 5.833333 in , 3.888889 in font "Helvetica,8"
set output "VIZ-04-002.pdf"
set lmargin at screen 0.13095238095238096
set rmargin at screen 0.9523809523809523
set bmargin at screen 0.16071428571428573
set tmargin at screen 0.7857142857142857
set xrange [ 0.5 : 4.5 ]
set yrange [ 0 : 100 ]
set xtics ( "1st" 1 , "2nd" 2 , "3rd" 3 , "Crew" 4 )
set ytics ( "0" 0 , "25" 25 , "50" 50 , "75" 75 , "100" 100 )
set xlabel "Passenger class / crew"
set ylabel "Survived (%)"
set border 3
set tics out nomirror
unset key
set style fill solid 1.0 noborder
set label 1 "VIZ-04-002" at screen .985 , .97 right
set label 2 "Female (teal) / male (blue); labels: n" at screen .13 , .88 left font ",7"
set palette defined ( 0 "#e8f1fa" , 100 "#00549f" )
set cbrange [ 0 : 100 ]
unset colorbox
# BEGIN EXAMPLE
set boxwidth .28 absolute
plot "data/classes.tsv" using ( $ 1 - .18 ) : 8 \
with boxes lc rgb "#00b1b7" , \
"" using ( $ 1 + .18 ) : 11 \
with boxes lc rgb "#00549f" , \
"" using ( $ 1 - .18 ) : 8 : ( sprintf ( "%d" , $ 6 )) \
with labels offset 0 , .7 font ",6" , \
"" using ( $ 1 + .18 ) : 11 : ( sprintf ( "%d" , $ 9 )) \
with labels offset 0 , .7 font ",6"
# END EXAMPLE
unset output
Native build log
Download: Source · Source + data ZIP · SVG · PDF · PNG
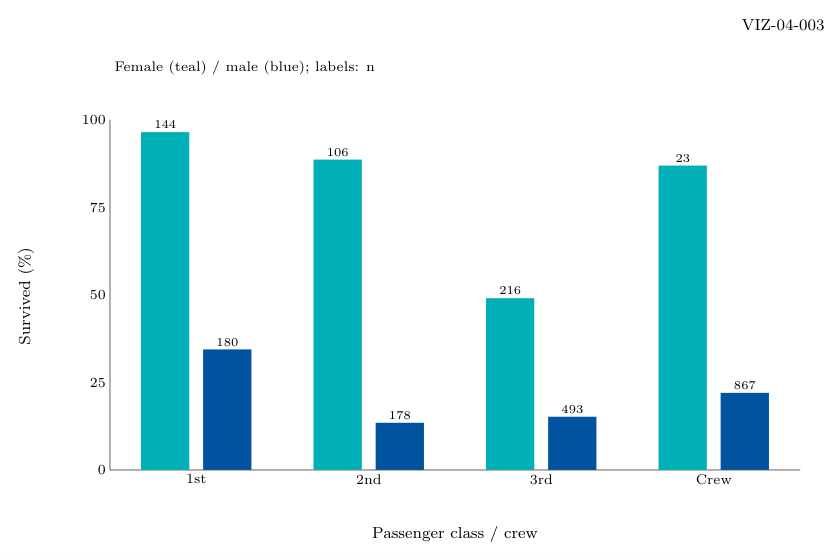
Copy link VIZ-04-003 Asymptote: grouped Asymptote reads the shared numeric table into typed arrays and draws this chart with paths, pens and physical-size symbols.
Back to comparison gallery Drawing commands real [][] d = input ( "data/classes.tsv" ). line ();
for ( int i = 0 ; i < d . length ; ++ i ) {
real [] v = d [ i ];
rect ( v [ 0 ] - .32 , 0 , v [ 0 ] - .04 , v [ 7 ], Teal );
rect ( v [ 0 ] + .04 , 0 , v [ 0 ] + .32 , v [ 10 ], Blue );
label ( string (( int ) v [ 5 ]), P ( v [ 0 ] - .18 , v [ 7 ]), N , fontsize ( 6 ));
label ( string (( int ) v [ 8 ]), P ( v [ 0 ] + .18 , v [ 10 ]), N , fontsize ( 6 ));
}
Actual Asymptote output VIZ-04-003 · native vector output Asymptote · exit 0
Command or choice Meaning arrays + native pathsNative drawing method used here. classes.tsvShared numeric input; column definitions are in data/recipes.json. Fixed rangesSame axis domain and statistical definition in all five implementations.
Complete standalone program import graph ;
size ( 420 bp , 280 bp , IgnoreAspect );
defaultpen ( fontsize ( 8 ));
pen Blue = rgb ( 0 , 84 / 255 , 159 / 255 ), Teal = rgb ( 0 , 177 / 255 , 183 / 255 );
pen Orange = rgb ( 246 / 255 , 168 / 255 , 0 ), Wash = rgb ( 232 / 255 , 241 / 255 , 250 / 255 );
pen Missing = rgb ( 236 / 255 , 236 / 255 , 237 / 255 );
pair P ( real x , real y ) {
return ( 55 + 345 * ( x - ( 0.5 )) / ( 4.0 ), 45 + 175 * ( y - ( 0 )) / ( 100 ));
}
void rect ( real x , real y , real xx , real yy , pen p ) {
fill ( P ( x , y ) -- P ( xx , y ) -- P ( xx , yy ) -- P ( x , yy ) -- cycle , p );
}
fill ( box (( 0 , 0 ), ( 420 , 280 )), white );
label ( "VIZ-04-003" , ( 414 , 272 ), SW , fontsize ( 8 ));
label ( "Female (teal) / male (blue); labels: n" , ( 55 , 246 ), E , fontsize ( 7 ));
draw ( P ( 0.5 , 100 ) -- P ( 0.5 , 0 ) -- P ( 4.5 , 0 ), gray ( .4 ));
label ( "1st" , P ( 1 , 0 ), S , fontsize ( 7 ));
label ( "2nd" , P ( 2 , 0 ), S , fontsize ( 7 ));
label ( "3rd" , P ( 3 , 0 ), S , fontsize ( 7 ));
label ( "Crew" , P ( 4 , 0 ), S , fontsize ( 7 ));
label ( "0" , P ( 0.5 , 0 ), W , fontsize ( 7 ));
label ( "25" , P ( 0.5 , 25 ), W , fontsize ( 7 ));
label ( "50" , P ( 0.5 , 50 ), W , fontsize ( 7 ));
label ( "75" , P ( 0.5 , 75 ), W , fontsize ( 7 ));
label ( "100" , P ( 0.5 , 100 ), W , fontsize ( 7 ));
label ( "Passenger class / crew" , ( 227.5 , 13 ), fontsize ( 8 ));
label ( rotate ( 90 ) * Label ( "Survived (\%)" ), ( 13 , 132 ), fontsize ( 8 ));
// BEGIN EXAMPLE
real [][] d = input ( "data/classes.tsv" ). line ();
for ( int i = 0 ; i < d . length ; ++ i ) {
real [] v = d [ i ];
rect ( v [ 0 ] - .32 , 0 , v [ 0 ] - .04 , v [ 7 ], Teal );
rect ( v [ 0 ] + .04 , 0 , v [ 0 ] + .32 , v [ 10 ], Blue );
label ( string (( int ) v [ 5 ]), P ( v [ 0 ] - .18 , v [ 7 ]), N , fontsize ( 6 ));
label ( string (( int ) v [ 8 ]), P ( v [ 0 ] + .18 , v [ 10 ]), N , fontsize ( 6 ));
}
// END EXAMPLE
shipout ( "VIZ-04-003" , bbox ( 0 ));
Native build log
Download: Source · Source + data ZIP · SVG · PDF · PNG
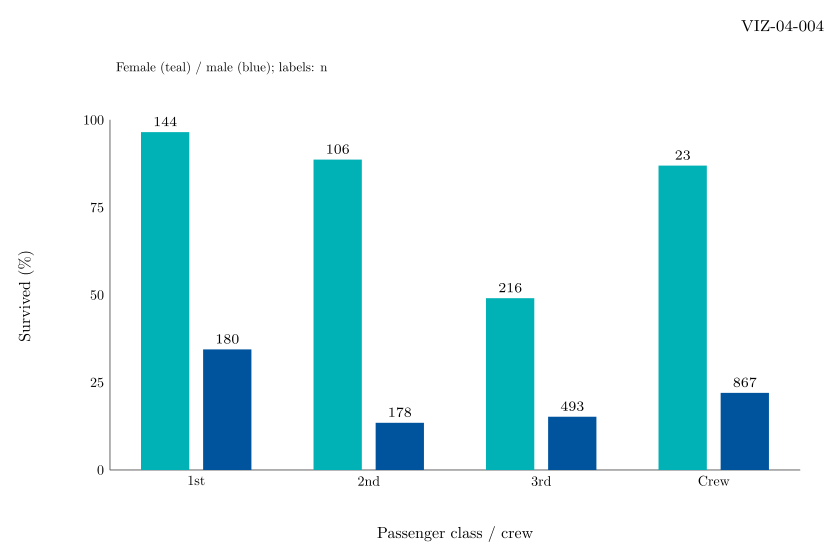
Copy link VIZ-04-004 MetaPost: grouped MetaPost reads numeric fields with gdata and scantokens, then constructs the chart with paths, TeX labels and colour interpolation.
Back to comparison gallery Drawing commands numeric n , v [][];
n := 0 ;
gdata ( "data/classes.tsv" , c ,
n := n + 1 ;
for j = 1 upto 12 :
v [ n ][ j ] := scantokens c [ j ];
endfor
);
for k = 1 upto n :
rect ( v [ k ][ 1 ] - .32 , 0 , v [ k ][ 1 ] - .04 , v [ k ][ 8 ], Teal );
rect ( v [ k ][ 1 ] + .04 , 0 , v [ k ][ 1 ] + .32 , v [ k ][ 11 ], Blue );
label .top ( decimal v [ k ][ 6 ] infont "cmr7" , P ( v [ k ][ 1 ] - .18 , v [ k ][ 8 ]));
label .top ( decimal v [ k ][ 9 ] infont "cmr7" , P ( v [ k ][ 1 ] + .18 , v [ k ][ 11 ]));
endfor
Actual MetaPost output VIZ-04-004 · native vector output MetaPost · exit 0
Command or choice Meaning gdata + pathsNative drawing method used here. classes.tsvShared numeric input; column definitions are in data/recipes.json. Fixed rangesSame axis domain and statistical definition in all five implementations.
Complete standalone program input graph ;
prologues := 3 ;
outputformat := "svg" ;
outputtemplate := "VIZ-04-004.svg" ;
color Blue , Teal , Orange , Wash , Missing ;
Blue := ( 0 , 84 / 255 , 159 / 255 );
Teal := ( 0 , 177 / 255 , 183 / 255 );
Orange := ( 246 / 255 , 168 / 255 , 0 );
Wash := ( 232 / 255 , 241 / 255 , 250 / 255 );
Missing := ( 236 / 255 , 236 / 255 , 237 / 255 );
vardef P ( expr x , y ) =
( 55 + 345 * ( x - ( 0.5 )) / ( 4.0 ), 45 + 175 * ( y - ( 0 )) / ( 100 ))
enddef ;
def rect ( expr x , y , xx , yy , col ) =
fill P ( x , y ) -- P ( xx , y ) -- P ( xx , yy ) -- P ( x , yy ) -- cycle withcolor col ;
enddef ;
beginfig ( 1 );
fill unitsquare xscaled 420 yscaled 280 withcolor white ;
label .llft ( "VIZ-04-004" infont "cmr8" , ( 414 , 272 ));
label .rt ( btex Female (teal) / male (blue); labels: n etex scaled .65 , ( 55 , 246 ));
draw P ( 0.5 , 100 ) -- P ( 0.5 , 0 ) -- P ( 4.5 , 0 ) withcolor .4 white ;
label .bot ( btex 1st etex scaled .7 , P ( 1 , 0 ));
label .bot ( btex 2nd etex scaled .7 , P ( 2 , 0 ));
label .bot ( btex 3rd etex scaled .7 , P ( 3 , 0 ));
label .bot ( btex Crew etex scaled .7 , P ( 4 , 0 ));
label .lft ( btex 0 etex scaled .7 , P ( 0.5 , 0 ));
label .lft ( btex 25 etex scaled .7 , P ( 0.5 , 25 ));
label .lft ( btex 50 etex scaled .7 , P ( 0.5 , 50 ));
label .lft ( btex 75 etex scaled .7 , P ( 0.5 , 75 ));
label .lft ( btex 100 etex scaled .7 , P ( 0.5 , 100 ));
label ( btex Passenger class / crew etex scaled .8 , ( 227.5 , 13 ));
label ( btex Survived (\%) etex scaled .8 rotated 90 , ( 13 , 132 ));
% BEGIN EXAMPLE
numeric n , v [][];
n := 0 ;
gdata ( "data/classes.tsv" , c ,
n := n + 1 ;
for j = 1 upto 12 :
v [ n ][ j ] := scantokens c [ j ];
endfor
);
for k = 1 upto n :
rect ( v [ k ][ 1 ] - .32 , 0 , v [ k ][ 1 ] - .04 , v [ k ][ 8 ], Teal );
rect ( v [ k ][ 1 ] + .04 , 0 , v [ k ][ 1 ] + .32 , v [ k ][ 11 ], Blue );
label .top ( decimal v [ k ][ 6 ] infont "cmr7" , P ( v [ k ][ 1 ] - .18 , v [ k ][ 8 ]));
label .top ( decimal v [ k ][ 9 ] infont "cmr7" , P ( v [ k ][ 1 ] + .18 , v [ k ][ 11 ]));
endfor
% END EXAMPLE
setbounds currentpicture to unitsquare xscaled 420 yscaled 280 ;
endfig ;
end .
Native build log Download: Source · Source + data ZIP · SVG · PDF · PNG
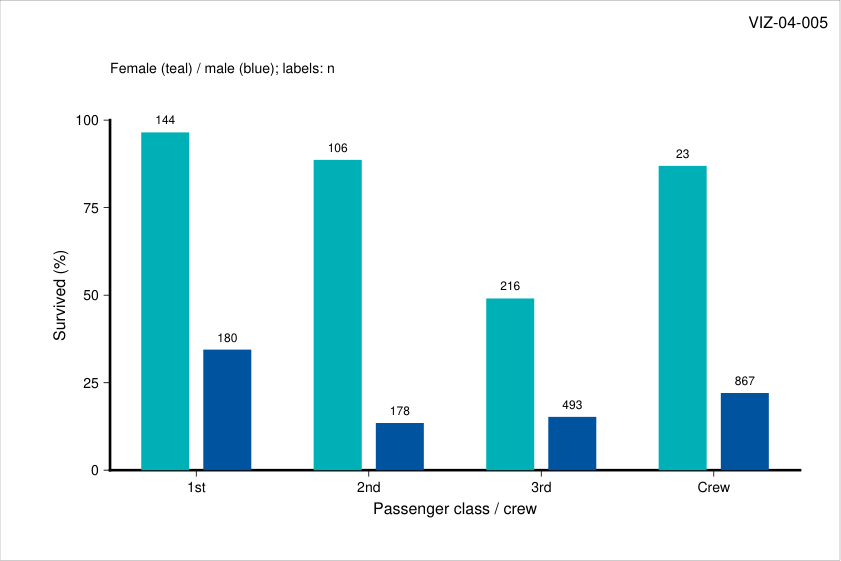
Copy link VIZ-04-005 GMT: grouped GMT reads selected columns through its native plotting modules; column expressions are performed by the shown local awk pipeline. The shared tables determine the statistics.
Back to comparison gallery Drawing commands '{print $1-.18,$8}' data/classes.tsv | gmt plot -Sb24p+b0 -G#00b1b7
awk '{print $1+.18,$11}' data/classes.tsv | gmt plot -Sb24p+b0 -G#00549f
awk '{print $1-.18,$8,$6}' data/classes.tsv | gmt text -F+f6p+jBC -D0/4p -N
awk '{print $1+.18,$11,$9}' data/classes.tsv | gmt text -F+f6p+jBC -D0/4p -N
Actual GMT output VIZ-04-005 · native vector output GMT · exit 0
Command or choice Meaning offset bars + textNative drawing method used here. classes.tsvShared numeric input; column definitions are in data/recipes.json. Fixed rangesSame axis domain and statistical definition in all five implementations.
Complete standalone program #!/usr/bin/env bash
set -euo pipefail
export GMT_USERDIR = " $PWD /.gmt"
mkdir -p " $GMT_USERDIR "
gmt begin VIZ-04-005 pdf
gmt set \
FONT_ANNOT_PRIMARY 7p \
FONT_LABEL 8p \
FONT_TITLE 8p \
MAP_TITLE_OFFSET 4p \
MAP_FRAME_TYPE plain \
MAP_TICK_LENGTH_PRIMARY 3p
gmt plot -R0/420/0/280 -JX420p/280p -Gwhite -W0p <<'CANVAS'
0 0
420 0
420 280
0 280
CANVAS
gmt text -F+f8p+jTR <<'ID'
414 272 VIZ-04-005
ID
gmt text -F+f7p+jML <<'LEGEND'
55 246 Female (teal) / male (blue); labels: n
LEGEND
gmt basemap -R0.5/4.5/0/100 -JX345p/175p -X55p -Y45p \
-Bpxcdata/classes-x.txt+l"Passenger class / crew" -Bpya25+l"Survived (%)" -BWS
# BEGIN EXAMPLE
awk '{print $1-.18,$8}' data/classes.tsv | gmt plot -Sb24p+b0 -G#00b1b7
awk '{print $1+.18,$11}' data/classes.tsv | gmt plot -Sb24p+b0 -G#00549f
awk '{print $1-.18,$8,$6}' data/classes.tsv | gmt text -F+f6p+jBC -D0/4p -N
awk '{print $1+.18,$11,$9}' data/classes.tsv | gmt text -F+f6p+jBC -D0/4p -N
# END EXAMPLE
gmt end
Native build log
Download: Source · Source + data ZIP · SVG · PDF · PNG
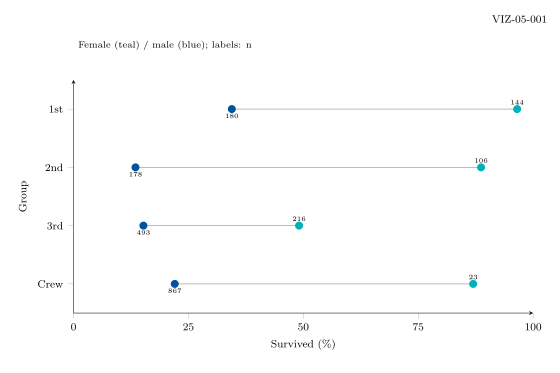
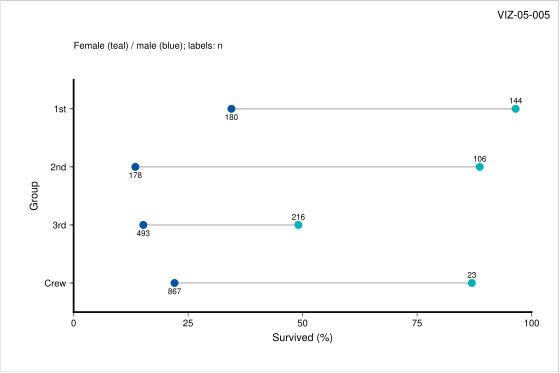
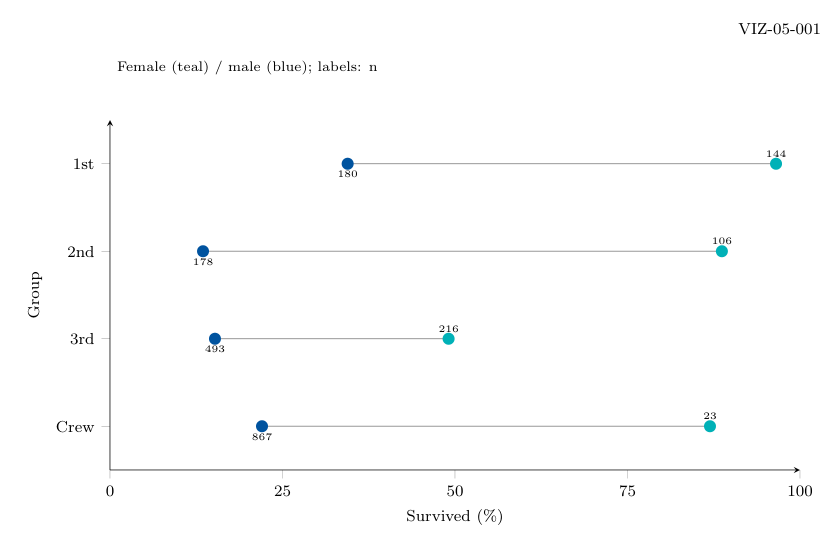
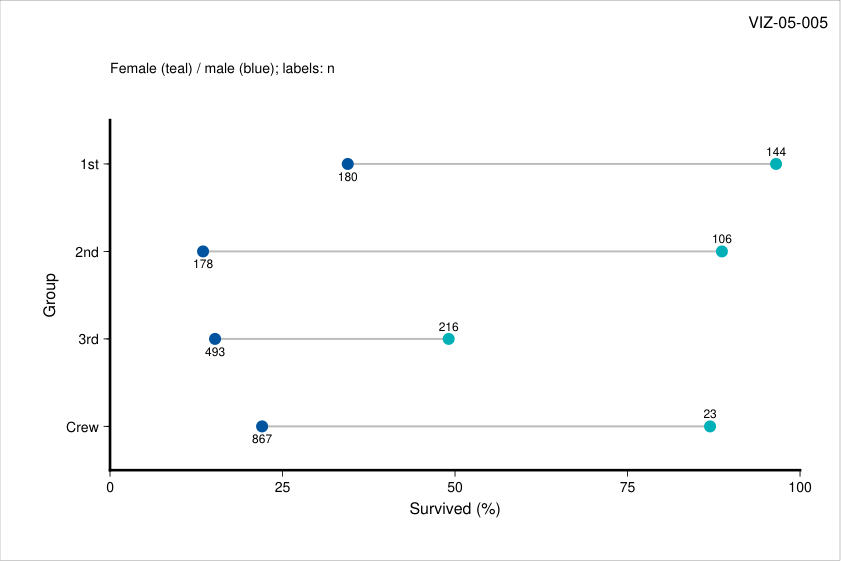
Copy link VIZ-05-001 PGFplots / TikZ: dumbbell Read each row and connect the two rates in axis coordinates; circles stay a constant physical size.
Back to comparison gallery Drawing commands \pgfplotstableread { data/classes.tsv} \Data
\begin { axis} [
width=345bp, height=175bp,
scale only axis, at={ (55bp,45bp)} ,
anchor=south west, xmin=0,
xmax=100, ymin=0.5,
ymax=4.5, xtick={ 0,25,50,75,100} ,
ytick={ 1,2,3,4} , xlabel={ Survived (\% )} ,
ylabel={ Group} , axis lines=left,
tick align=outside, enlargelimits=false,
clip=false, yticklabels={ Crew,3rd,2nd,1st}
]
\pgfplotsextra {
\foreach \i in { 0,...,3}{
\pgfplotstablegetelem { \i }{ [index]0} \of\Data\let\va\pgfplotsretval
\pgfplotstablegetelem { \i }{ [index]1} \of\Data\let\vb\pgfplotsretval
\pgfplotstablegetelem { \i }{ [index]2} \of\Data\let\vc\pgfplotsretval
\pgfplotstablegetelem { \i }{ [index]3} \of\Data\let\vd\pgfplotsretval
\pgfplotstablegetelem { \i }{ [index]4} \of\Data\let\ve\pgfplotsretval
\pgfplotstablegetelem { \i }{ [index]5} \of\Data\let\vf\pgfplotsretval
\pgfplotstablegetelem { \i }{ [index]6} \of\Data\let\vg\pgfplotsretval
\pgfplotstablegetelem { \i }{ [index]7} \of\Data\let\vh\pgfplotsretval
\pgfplotstablegetelem { \i }{ [index]8} \of\Data\let\vi\pgfplotsretval
\pgfplotstablegetelem { \i }{ [index]9} \of\Data\let\vj\pgfplotsretval
\pgfplotstablegetelem { \i }{ [index]10} \of\Data\let\vk\pgfplotsretval
\pgfplotstablegetelem { \i }{ [index]11} \of\Data\let\vl\pgfplotsretval
\pgfmathsetmacro { \yy }{ 5-\va }
\draw [gray] (axis cs:\vh ,\yy )--(axis cs:\vk ,\yy );
\fill [Teal] (axis cs:\vh ,\yy ) circle[radius=3bp];
\fill [Blue] (axis cs:\vk ,\yy ) circle[radius=3bp];
\node [above,font=\tiny] at (axis cs:\vh ,\yy ) { \vf } ;
\node [below,font=\tiny] at (axis cs:\vk ,\yy ) { \vi } ;
}
}
\end { axis}
Actual PGFplots / TikZ output VIZ-05-001 · native vector output PGFplots / TikZ · exit 0
Command or choice Meaning pgfplotstable + TikZ pathsNative drawing method used here. classes.tsvShared numeric input; column definitions are in data/recipes.json. Fixed rangesSame axis domain and statistical definition in all five implementations.
Complete standalone program \documentclass [tikz,border=0pt] { standalone}
\usepackage { pgfplots,pgfplotstable}
\usepgfplotslibrary { statistics,groupplots}
\pgfplotsset { compat=1.18}
\definecolor { Blue}{ HTML}{ 00549F}
\definecolor { Teal}{ HTML}{ 00B1B7}
\definecolor { Orange}{ HTML}{ F6A800}
\definecolor { Wash}{ HTML}{ E8F1FA}
\definecolor { Missing}{ HTML}{ ECECED}
\begin { document}
\begin { tikzpicture} [font=\fontsize { 8}{ 10} \selectfont ]
\path [use as bounding box,fill=white] (0,0) rectangle (420bp,280bp);
\node [anchor=north east] at (414bp,272bp) { VIZ-05-001} ;
\node [anchor=west,font=\fontsize{7}{9}\selectfont] at
(55bp,246bp) { Female (teal) / male (blue); labels: n} ;
% BEGIN EXAMPLE
\pgfplotstableread { data/classes.tsv} \Data
\begin { axis} [
width=345bp, height=175bp,
scale only axis, at={ (55bp,45bp)} ,
anchor=south west, xmin=0,
xmax=100, ymin=0.5,
ymax=4.5, xtick={ 0,25,50,75,100} ,
ytick={ 1,2,3,4} , xlabel={ Survived (\% )} ,
ylabel={ Group} , axis lines=left,
tick align=outside, enlargelimits=false,
clip=false, yticklabels={ Crew,3rd,2nd,1st}
]
\pgfplotsextra {
\foreach \i in { 0,...,3}{
\pgfplotstablegetelem { \i }{ [index]0} \of\Data\let\va\pgfplotsretval
\pgfplotstablegetelem { \i }{ [index]1} \of\Data\let\vb\pgfplotsretval
\pgfplotstablegetelem { \i }{ [index]2} \of\Data\let\vc\pgfplotsretval
\pgfplotstablegetelem { \i }{ [index]3} \of\Data\let\vd\pgfplotsretval
\pgfplotstablegetelem { \i }{ [index]4} \of\Data\let\ve\pgfplotsretval
\pgfplotstablegetelem { \i }{ [index]5} \of\Data\let\vf\pgfplotsretval
\pgfplotstablegetelem { \i }{ [index]6} \of\Data\let\vg\pgfplotsretval
\pgfplotstablegetelem { \i }{ [index]7} \of\Data\let\vh\pgfplotsretval
\pgfplotstablegetelem { \i }{ [index]8} \of\Data\let\vi\pgfplotsretval
\pgfplotstablegetelem { \i }{ [index]9} \of\Data\let\vj\pgfplotsretval
\pgfplotstablegetelem { \i }{ [index]10} \of\Data\let\vk\pgfplotsretval
\pgfplotstablegetelem { \i }{ [index]11} \of\Data\let\vl\pgfplotsretval
\pgfmathsetmacro { \yy }{ 5-\va }
\draw [gray] (axis cs:\vh ,\yy )--(axis cs:\vk ,\yy );
\fill [Teal] (axis cs:\vh ,\yy ) circle[radius=3bp];
\fill [Blue] (axis cs:\vk ,\yy ) circle[radius=3bp];
\node [above,font=\tiny] at (axis cs:\vh ,\yy ) { \vf } ;
\node [below,font=\tiny] at (axis cs:\vk ,\yy ) { \vi } ;
}
}
\end { axis}
% END EXAMPLE
\end { tikzpicture}
\end { document}
Native build log Download: Source · Source + data ZIP · SVG · PDF · PNG
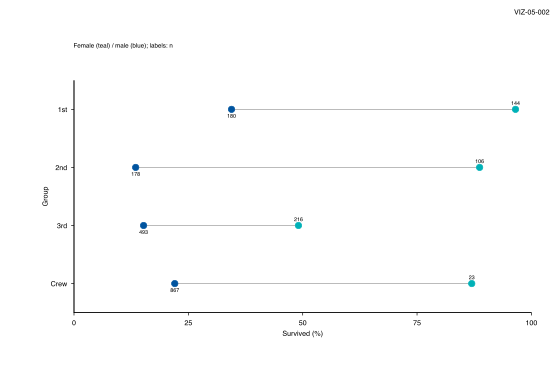
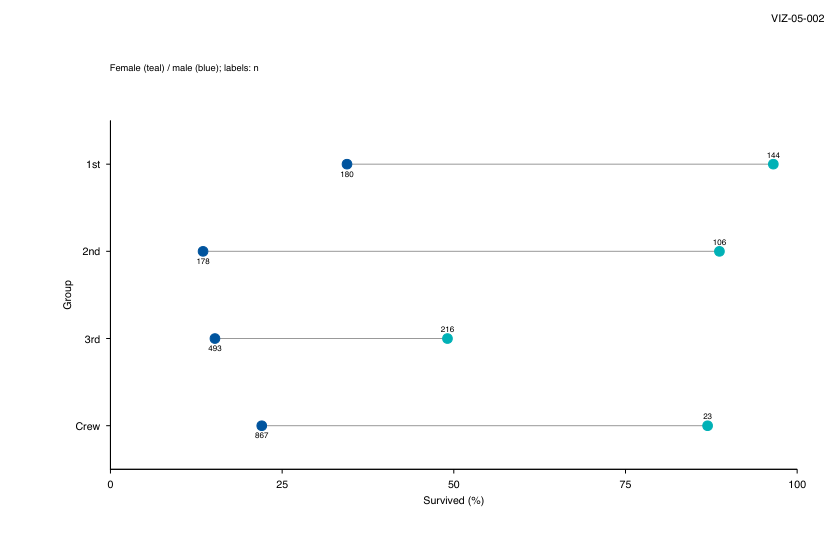
Copy link VIZ-05-002 gnuplot: dumbbell A horizontal vector joins each pair; separate point series retain the sex colours and denominator labels.
Back to comparison gallery Drawing commands plot "data/classes.tsv" using 11 : ( 5 - $ 1 ) : ( $ 8 - $ 11 ) : ( 0 ) \
with vectors nohead lc rgb "#999999" , \
"" using 8 : ( 5 - $ 1 ) \
with points pt 7 ps .8 lc rgb "#00b1b7" , \
"" using 11 : ( 5 - $ 1 ) \
with points pt 7 ps .8 lc rgb "#00549f" , \
"" using 8 : ( 5 - $ 1 ) : ( sprintf ( "%d" , $ 6 )) \
with labels offset 0 , .9 font ",6" , \
"" using 11 : ( 5 - $ 1 ) : ( sprintf ( "%d" , $ 9 )) \
with labels offset 0 , - .9 font ",6"
Actual gnuplot output VIZ-05-002 · native vector output gnuplot · exit 0
Command or choice Meaning vectors nohead + pointsNative drawing method used here. classes.tsvShared numeric input; column definitions are in data/recipes.json. Fixed rangesSame axis domain and statistical definition in all five implementations.
Complete standalone program set terminal pdfcairo size 5.833333 in , 3.888889 in font "Helvetica,8"
set output "VIZ-05-002.pdf"
set lmargin at screen 0.13095238095238096
set rmargin at screen 0.9523809523809523
set bmargin at screen 0.16071428571428573
set tmargin at screen 0.7857142857142857
set xrange [ 0 : 100 ]
set yrange [ 0.5 : 4.5 ]
set xtics ( "0" 0 , "25" 25 , "50" 50 , "75" 75 , "100" 100 )
set ytics ( "Crew" 1 , "3rd" 2 , "2nd" 3 , "1st" 4 )
set xlabel "Survived (%)"
set ylabel "Group"
set border 3
set tics out nomirror
unset key
set style fill solid 1.0 noborder
set label 1 "VIZ-05-002" at screen .985 , .97 right
set label 2 "Female (teal) / male (blue); labels: n" at screen .13 , .88 left font ",7"
set palette defined ( 0 "#e8f1fa" , 100 "#00549f" )
set cbrange [ 0 : 100 ]
unset colorbox
# BEGIN EXAMPLE
plot "data/classes.tsv" using 11 : ( 5 - $ 1 ) : ( $ 8 - $ 11 ) : ( 0 ) \
with vectors nohead lc rgb "#999999" , \
"" using 8 : ( 5 - $ 1 ) \
with points pt 7 ps .8 lc rgb "#00b1b7" , \
"" using 11 : ( 5 - $ 1 ) \
with points pt 7 ps .8 lc rgb "#00549f" , \
"" using 8 : ( 5 - $ 1 ) : ( sprintf ( "%d" , $ 6 )) \
with labels offset 0 , .9 font ",6" , \
"" using 11 : ( 5 - $ 1 ) : ( sprintf ( "%d" , $ 9 )) \
with labels offset 0 , - .9 font ",6"
# END EXAMPLE
unset output
Native build log
Download: Source · Source + data ZIP · SVG · PDF · PNG
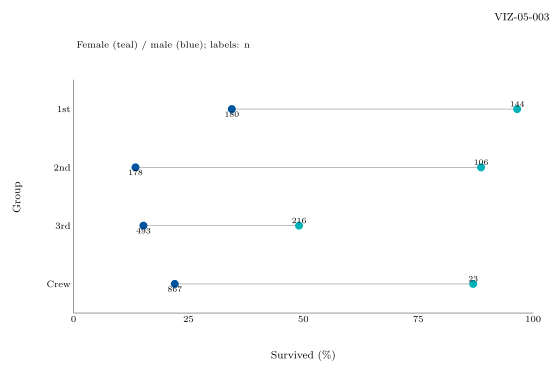
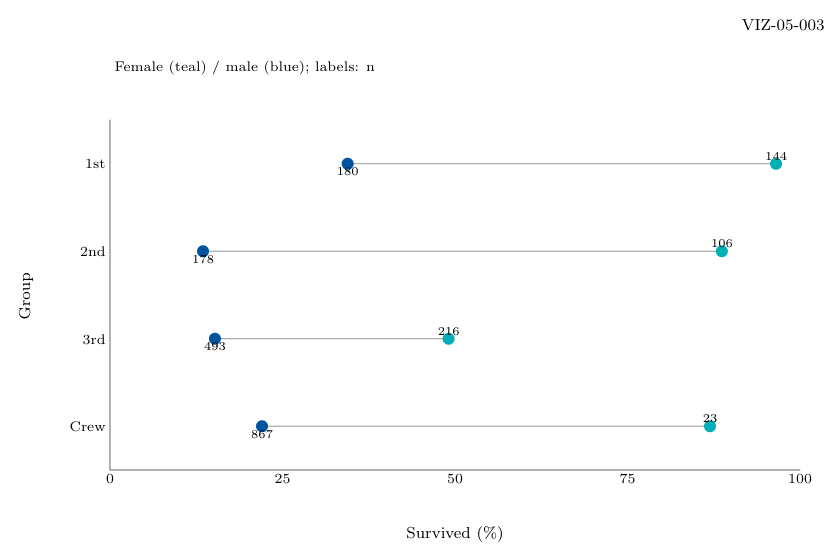
Copy link VIZ-05-003 Asymptote: dumbbell Asymptote reads the shared numeric table into typed arrays and draws this chart with paths, pens and physical-size symbols.
Back to comparison gallery Drawing commands real [][] d = input ( "data/classes.tsv" ). line ();
for ( int i = 0 ; i < d . length ; ++ i ) {
real [] v = d [ i ];
draw ( P ( v [ 7 ], 5 - v [ 0 ]) -- P ( v [ 10 ], 5 - v [ 0 ]), gray ( .6 ));
fill ( circle ( P ( v [ 7 ], 5 - v [ 0 ]), 3 ), Teal );
fill ( circle ( P ( v [ 10 ], 5 - v [ 0 ]), 3 ), Blue );
label ( string (( int ) v [ 5 ]), P ( v [ 7 ], 5 - v [ 0 ]), N , fontsize ( 6 ));
label ( string (( int ) v [ 8 ]), P ( v [ 10 ], 5 - v [ 0 ]), S , fontsize ( 6 ));
}
Actual Asymptote output VIZ-05-003 · native vector output Asymptote · exit 0
Command or choice Meaning arrays + native pathsNative drawing method used here. classes.tsvShared numeric input; column definitions are in data/recipes.json. Fixed rangesSame axis domain and statistical definition in all five implementations.
Complete standalone program import graph ;
size ( 420 bp , 280 bp , IgnoreAspect );
defaultpen ( fontsize ( 8 ));
pen Blue = rgb ( 0 , 84 / 255 , 159 / 255 ), Teal = rgb ( 0 , 177 / 255 , 183 / 255 );
pen Orange = rgb ( 246 / 255 , 168 / 255 , 0 ), Wash = rgb ( 232 / 255 , 241 / 255 , 250 / 255 );
pen Missing = rgb ( 236 / 255 , 236 / 255 , 237 / 255 );
pair P ( real x , real y ) {
return ( 55 + 345 * ( x - ( 0 )) / ( 100 ), 45 + 175 * ( y - ( 0.5 )) / ( 4.0 ));
}
void rect ( real x , real y , real xx , real yy , pen p ) {
fill ( P ( x , y ) -- P ( xx , y ) -- P ( xx , yy ) -- P ( x , yy ) -- cycle , p );
}
fill ( box (( 0 , 0 ), ( 420 , 280 )), white );
label ( "VIZ-05-003" , ( 414 , 272 ), SW , fontsize ( 8 ));
label ( "Female (teal) / male (blue); labels: n" , ( 55 , 246 ), E , fontsize ( 7 ));
draw ( P ( 0 , 4.5 ) -- P ( 0 , 0.5 ) -- P ( 100 , 0.5 ), gray ( .4 ));
label ( "0" , P ( 0 , 0.5 ), S , fontsize ( 7 ));
label ( "25" , P ( 25 , 0.5 ), S , fontsize ( 7 ));
label ( "50" , P ( 50 , 0.5 ), S , fontsize ( 7 ));
label ( "75" , P ( 75 , 0.5 ), S , fontsize ( 7 ));
label ( "100" , P ( 100 , 0.5 ), S , fontsize ( 7 ));
label ( "Crew" , P ( 0 , 1 ), W , fontsize ( 7 ));
label ( "3rd" , P ( 0 , 2 ), W , fontsize ( 7 ));
label ( "2nd" , P ( 0 , 3 ), W , fontsize ( 7 ));
label ( "1st" , P ( 0 , 4 ), W , fontsize ( 7 ));
label ( "Survived (\%)" , ( 227.5 , 13 ), fontsize ( 8 ));
label ( rotate ( 90 ) * Label ( "Group" ), ( 13 , 132 ), fontsize ( 8 ));
// BEGIN EXAMPLE
real [][] d = input ( "data/classes.tsv" ). line ();
for ( int i = 0 ; i < d . length ; ++ i ) {
real [] v = d [ i ];
draw ( P ( v [ 7 ], 5 - v [ 0 ]) -- P ( v [ 10 ], 5 - v [ 0 ]), gray ( .6 ));
fill ( circle ( P ( v [ 7 ], 5 - v [ 0 ]), 3 ), Teal );
fill ( circle ( P ( v [ 10 ], 5 - v [ 0 ]), 3 ), Blue );
label ( string (( int ) v [ 5 ]), P ( v [ 7 ], 5 - v [ 0 ]), N , fontsize ( 6 ));
label ( string (( int ) v [ 8 ]), P ( v [ 10 ], 5 - v [ 0 ]), S , fontsize ( 6 ));
}
// END EXAMPLE
shipout ( "VIZ-05-003" , bbox ( 0 ));
Native build log
Download: Source · Source + data ZIP · SVG · PDF · PNG
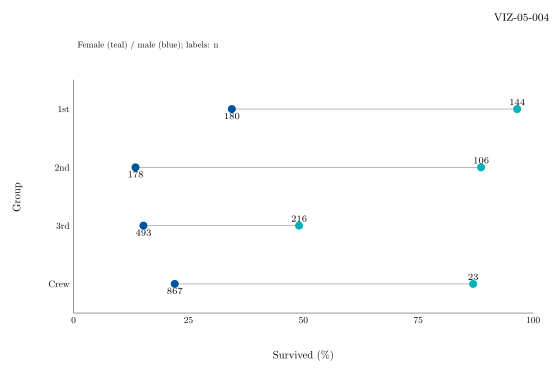
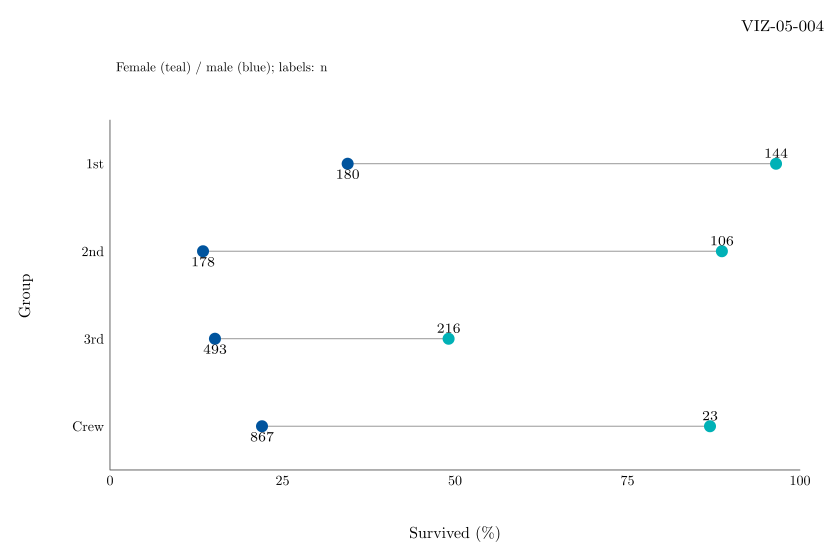
Copy link VIZ-05-004 MetaPost: dumbbell MetaPost reads numeric fields with gdata and scantokens, then constructs the chart with paths, TeX labels and colour interpolation.
Back to comparison gallery Drawing commands numeric n , v [][];
n := 0 ;
gdata ( "data/classes.tsv" , c ,
n := n + 1 ;
for j = 1 upto 12 :
v [ n ][ j ] := scantokens c [ j ];
endfor
);
for k = 1 upto n :
draw P ( v [ k ][ 8 ], 5 - v [ k ][ 1 ]) -- P ( v [ k ][ 11 ], 5 - v [ k ][ 1 ]) withcolor .6 white ;
fill fullcircle scaled 6 shifted P ( v [ k ][ 8 ], 5 - v [ k ][ 1 ]) withcolor Teal ;
fill fullcircle scaled 6 shifted P ( v [ k ][ 11 ], 5 - v [ k ][ 1 ]) withcolor Blue ;
label .top ( decimal v [ k ][ 6 ] infont "cmr7" , P ( v [ k ][ 8 ], 5 - v [ k ][ 1 ]));
label .bot ( decimal v [ k ][ 9 ] infont "cmr7" , P ( v [ k ][ 11 ], 5 - v [ k ][ 1 ]));
endfor
Actual MetaPost output VIZ-05-004 · native vector output MetaPost · exit 0
Command or choice Meaning gdata + pathsNative drawing method used here. classes.tsvShared numeric input; column definitions are in data/recipes.json. Fixed rangesSame axis domain and statistical definition in all five implementations.
Complete standalone program input graph ;
prologues := 3 ;
outputformat := "svg" ;
outputtemplate := "VIZ-05-004.svg" ;
color Blue , Teal , Orange , Wash , Missing ;
Blue := ( 0 , 84 / 255 , 159 / 255 );
Teal := ( 0 , 177 / 255 , 183 / 255 );
Orange := ( 246 / 255 , 168 / 255 , 0 );
Wash := ( 232 / 255 , 241 / 255 , 250 / 255 );
Missing := ( 236 / 255 , 236 / 255 , 237 / 255 );
vardef P ( expr x , y ) =
( 55 + 345 * ( x - ( 0 )) / ( 100 ), 45 + 175 * ( y - ( 0.5 )) / ( 4.0 ))
enddef ;
def rect ( expr x , y , xx , yy , col ) =
fill P ( x , y ) -- P ( xx , y ) -- P ( xx , yy ) -- P ( x , yy ) -- cycle withcolor col ;
enddef ;
beginfig ( 1 );
fill unitsquare xscaled 420 yscaled 280 withcolor white ;
label .llft ( "VIZ-05-004" infont "cmr8" , ( 414 , 272 ));
label .rt ( btex Female (teal) / male (blue); labels: n etex scaled .65 , ( 55 , 246 ));
draw P ( 0 , 4.5 ) -- P ( 0 , 0.5 ) -- P ( 100 , 0.5 ) withcolor .4 white ;
label .bot ( btex 0 etex scaled .7 , P ( 0 , 0.5 ));
label .bot ( btex 25 etex scaled .7 , P ( 25 , 0.5 ));
label .bot ( btex 50 etex scaled .7 , P ( 50 , 0.5 ));
label .bot ( btex 75 etex scaled .7 , P ( 75 , 0.5 ));
label .bot ( btex 100 etex scaled .7 , P ( 100 , 0.5 ));
label .lft ( btex Crew etex scaled .7 , P ( 0 , 1 ));
label .lft ( btex 3rd etex scaled .7 , P ( 0 , 2 ));
label .lft ( btex 2nd etex scaled .7 , P ( 0 , 3 ));
label .lft ( btex 1st etex scaled .7 , P ( 0 , 4 ));
label ( btex Survived (\%) etex scaled .8 , ( 227.5 , 13 ));
label ( btex Group etex scaled .8 rotated 90 , ( 13 , 132 ));
% BEGIN EXAMPLE
numeric n , v [][];
n := 0 ;
gdata ( "data/classes.tsv" , c ,
n := n + 1 ;
for j = 1 upto 12 :
v [ n ][ j ] := scantokens c [ j ];
endfor
);
for k = 1 upto n :
draw P ( v [ k ][ 8 ], 5 - v [ k ][ 1 ]) -- P ( v [ k ][ 11 ], 5 - v [ k ][ 1 ]) withcolor .6 white ;
fill fullcircle scaled 6 shifted P ( v [ k ][ 8 ], 5 - v [ k ][ 1 ]) withcolor Teal ;
fill fullcircle scaled 6 shifted P ( v [ k ][ 11 ], 5 - v [ k ][ 1 ]) withcolor Blue ;
label .top ( decimal v [ k ][ 6 ] infont "cmr7" , P ( v [ k ][ 8 ], 5 - v [ k ][ 1 ]));
label .bot ( decimal v [ k ][ 9 ] infont "cmr7" , P ( v [ k ][ 11 ], 5 - v [ k ][ 1 ]));
endfor
% END EXAMPLE
setbounds currentpicture to unitsquare xscaled 420 yscaled 280 ;
endfig ;
end .
Native build log Download: Source · Source + data ZIP · SVG · PDF · PNG
Copy link VIZ-05-005 GMT: dumbbell GMT reads selected columns through its native plotting modules; column expressions are performed by the shown local awk pipeline. The shared tables determine the statistics.
Back to comparison gallery Drawing commands '{print ">";print $8,5-$1;print $11,5-$1}' data/classes.tsv | gmt plot -W1p,gray
awk '{print $8,5-$1}' data/classes.tsv | gmt plot -Sc6p -G#00b1b7
awk '{print $11,5-$1}' data/classes.tsv | gmt plot -Sc6p -G#00549f
awk '{print $8,5-$1,$6}' data/classes.tsv | gmt text -F+f6p+jBC -D0/4p
awk '{print $11,5-$1,$9}' data/classes.tsv | gmt text -F+f6p+jTC -D0/-4p
Actual GMT output VIZ-05-005 · native vector output GMT · exit 0
Command or choice Meaning segments + -Sc symbolsNative drawing method used here. classes.tsvShared numeric input; column definitions are in data/recipes.json. Fixed rangesSame axis domain and statistical definition in all five implementations.
Complete standalone program #!/usr/bin/env bash
set -euo pipefail
export GMT_USERDIR = " $PWD /.gmt"
mkdir -p " $GMT_USERDIR "
gmt begin VIZ-05-005 pdf
gmt set \
FONT_ANNOT_PRIMARY 7p \
FONT_LABEL 8p \
FONT_TITLE 8p \
MAP_TITLE_OFFSET 4p \
MAP_FRAME_TYPE plain \
MAP_TICK_LENGTH_PRIMARY 3p
gmt plot -R0/420/0/280 -JX420p/280p -Gwhite -W0p <<'CANVAS'
0 0
420 0
420 280
0 280
CANVAS
gmt text -F+f8p+jTR <<'ID'
414 272 VIZ-05-005
ID
gmt text -F+f7p+jML <<'LEGEND'
55 246 Female (teal) / male (blue); labels: n
LEGEND
gmt basemap -R0/100/0.5/4.5 -JX345p/175p -X55p -Y45p -Bpxa25+l"Survived (%)" \
-Bpycdata/classes-y.txt+l"Group" -BWS
# BEGIN EXAMPLE
awk '{print ">";print $8,5-$1;print $11,5-$1}' data/classes.tsv | gmt plot -W1p,gray
awk '{print $8,5-$1}' data/classes.tsv | gmt plot -Sc6p -G#00b1b7
awk '{print $11,5-$1}' data/classes.tsv | gmt plot -Sc6p -G#00549f
awk '{print $8,5-$1,$6}' data/classes.tsv | gmt text -F+f6p+jBC -D0/4p
awk '{print $11,5-$1,$9}' data/classes.tsv | gmt text -F+f6p+jTC -D0/-4p
# END EXAMPLE
gmt end
Native build log
Download: Source · Source + data ZIP · SVG · PDF · PNG
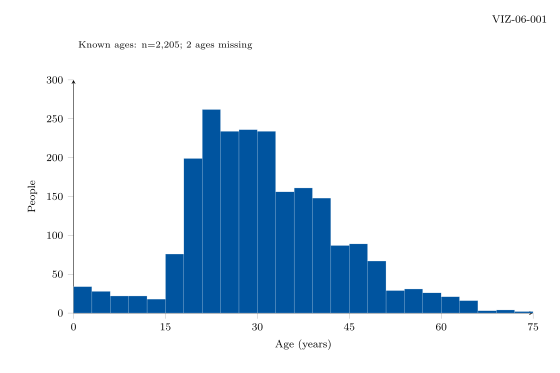
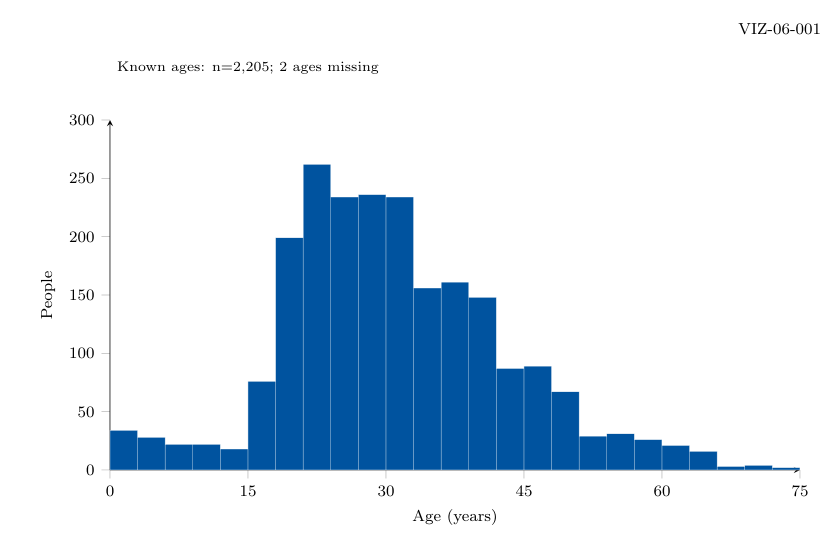
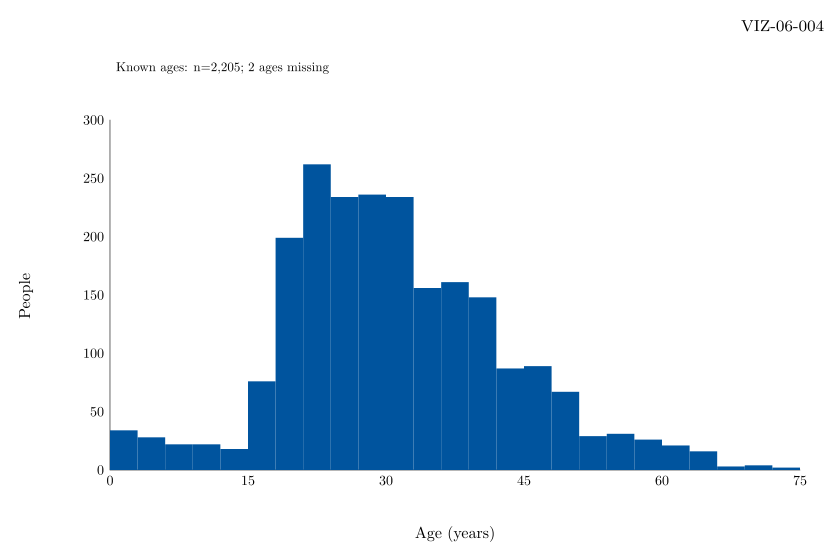
Copy link VIZ-06-001 PGFplots / TikZ: histogram The shared three-year bins become bars of width 13.8 bp on a 75-year axis.
Back to comparison gallery Drawing commands \begin { axis} [
width=345bp, height=175bp,
scale only axis, at={ (55bp,45bp)} ,
anchor=south west, xmin=0,
xmax=75, ymin=0,
ymax=300, xtick={ 0,15,30,45,60,75} ,
ytick={ 0,50,100,150,200,250,300} , xlabel={ Age (years)} ,
ylabel={ People} , axis lines=left,
tick align=outside, enlargelimits=false,
clip=false
]
\addplot [ybar,bar shift=0pt,bar width=13.8bp,fill=Blue,draw=white,line width=.2bp]
table[x index=0,y index=3]{ data/ages.tsv} ;
\end { axis}
Actual PGFplots / TikZ output VIZ-06-001 · native vector output PGFplots / TikZ · exit 0
Command or choice Meaning table + fixed bar widthNative drawing method used here. ages.tsvShared numeric input; column definitions are in data/recipes.json. Fixed rangesSame axis domain and statistical definition in all five implementations.
Complete standalone program \documentclass [tikz,border=0pt] { standalone}
\usepackage { pgfplots,pgfplotstable}
\usepgfplotslibrary { statistics,groupplots}
\pgfplotsset { compat=1.18}
\definecolor { Blue}{ HTML}{ 00549F}
\definecolor { Teal}{ HTML}{ 00B1B7}
\definecolor { Orange}{ HTML}{ F6A800}
\definecolor { Wash}{ HTML}{ E8F1FA}
\definecolor { Missing}{ HTML}{ ECECED}
\begin { document}
\begin { tikzpicture} [font=\fontsize { 8}{ 10} \selectfont ]
\path [use as bounding box,fill=white] (0,0) rectangle (420bp,280bp);
\node [anchor=north east] at (414bp,272bp) { VIZ-06-001} ;
\node [anchor=west,font=\fontsize{7}{9}\selectfont] at
(55bp,246bp) { Known ages: n=2,205; 2 ages missing} ;
% BEGIN EXAMPLE
\begin { axis} [
width=345bp, height=175bp,
scale only axis, at={ (55bp,45bp)} ,
anchor=south west, xmin=0,
xmax=75, ymin=0,
ymax=300, xtick={ 0,15,30,45,60,75} ,
ytick={ 0,50,100,150,200,250,300} , xlabel={ Age (years)} ,
ylabel={ People} , axis lines=left,
tick align=outside, enlargelimits=false,
clip=false
]
\addplot [ybar,bar shift=0pt,bar width=13.8bp,fill=Blue,draw=white,line width=.2bp]
table[x index=0,y index=3]{ data/ages.tsv} ;
\end { axis}
% END EXAMPLE
\end { tikzpicture}
\end { document}
Native build log Download: Source · Source + data ZIP · SVG · PDF · PNG
Copy link VIZ-06-002 gnuplot: histogram Draw pre-binned counts at the shared bin centres; no engine-specific histogram binning occurs.
Back to comparison gallery Drawing commands set boxwidth 3 absolute
plot "data/ages.tsv" using 1 : 4 with boxes lc rgb "#00549f"
Actual gnuplot output VIZ-06-002 · native vector output gnuplot · exit 0
Command or choice Meaning boxwidth 3 absoluteNative drawing method used here. ages.tsvShared numeric input; column definitions are in data/recipes.json. Fixed rangesSame axis domain and statistical definition in all five implementations.
Complete standalone program set terminal pdfcairo size 5.833333 in , 3.888889 in font "Helvetica,8"
set output "VIZ-06-002.pdf"
set lmargin at screen 0.13095238095238096
set rmargin at screen 0.9523809523809523
set bmargin at screen 0.16071428571428573
set tmargin at screen 0.7857142857142857
set xrange [ 0 : 75 ]
set yrange [ 0 : 300 ]
set xtics ( "0" 0 , "15" 15 , "30" 30 , "45" 45 , "60" 60 , "75" 75 )
set ytics ( "0" 0 , "50" 50 , "100" 100 , "150" 150 , "200" 200 , "250" 250 , "300" 300 )
set xlabel "Age (years)"
set ylabel "People"
set border 3
set tics out nomirror
unset key
set style fill solid 1.0 noborder
set label 1 "VIZ-06-002" at screen .985 , .97 right
set label 2 "Known ages: n=2,205; 2 ages missing" at screen .13 , .88 left font ",7"
set palette defined ( 0 "#e8f1fa" , 100 "#00549f" )
set cbrange [ 0 : 100 ]
unset colorbox
# BEGIN EXAMPLE
set boxwidth 3 absolute
plot "data/ages.tsv" using 1 : 4 with boxes lc rgb "#00549f"
# END EXAMPLE
unset output
Native build log
Download: Source · Source + data ZIP · SVG · PDF · PNG
Copy link VIZ-06-003 Asymptote: histogram Asymptote reads the shared numeric table into typed arrays and draws this chart with paths, pens and physical-size symbols.
Back to comparison gallery Drawing commands real [][] d = input ( "data/ages.tsv" ). line ();
for ( int i = 0 ; i < d . length ; ++ i ) {
real [] v = d [ i ];
rect ( v [ 1 ], 0 , v [ 2 ], v [ 3 ], Blue );
}
Actual Asymptote output VIZ-06-003 · native vector output Asymptote · exit 0
Command or choice Meaning arrays + native pathsNative drawing method used here. ages.tsvShared numeric input; column definitions are in data/recipes.json. Fixed rangesSame axis domain and statistical definition in all five implementations.
Complete standalone program import graph ;
size ( 420 bp , 280 bp , IgnoreAspect );
defaultpen ( fontsize ( 8 ));
pen Blue = rgb ( 0 , 84 / 255 , 159 / 255 ), Teal = rgb ( 0 , 177 / 255 , 183 / 255 );
pen Orange = rgb ( 246 / 255 , 168 / 255 , 0 ), Wash = rgb ( 232 / 255 , 241 / 255 , 250 / 255 );
pen Missing = rgb ( 236 / 255 , 236 / 255 , 237 / 255 );
pair P ( real x , real y ) {
return ( 55 + 345 * ( x - ( 0 )) / ( 75 ), 45 + 175 * ( y - ( 0 )) / ( 300 ));
}
void rect ( real x , real y , real xx , real yy , pen p ) {
fill ( P ( x , y ) -- P ( xx , y ) -- P ( xx , yy ) -- P ( x , yy ) -- cycle , p );
}
fill ( box (( 0 , 0 ), ( 420 , 280 )), white );
label ( "VIZ-06-003" , ( 414 , 272 ), SW , fontsize ( 8 ));
label ( "Known ages: n=2,205; 2 ages missing" , ( 55 , 246 ), E , fontsize ( 7 ));
draw ( P ( 0 , 300 ) -- P ( 0 , 0 ) -- P ( 75 , 0 ), gray ( .4 ));
label ( "0" , P ( 0 , 0 ), S , fontsize ( 7 ));
label ( "15" , P ( 15 , 0 ), S , fontsize ( 7 ));
label ( "30" , P ( 30 , 0 ), S , fontsize ( 7 ));
label ( "45" , P ( 45 , 0 ), S , fontsize ( 7 ));
label ( "60" , P ( 60 , 0 ), S , fontsize ( 7 ));
label ( "75" , P ( 75 , 0 ), S , fontsize ( 7 ));
label ( "0" , P ( 0 , 0 ), W , fontsize ( 7 ));
label ( "50" , P ( 0 , 50 ), W , fontsize ( 7 ));
label ( "100" , P ( 0 , 100 ), W , fontsize ( 7 ));
label ( "150" , P ( 0 , 150 ), W , fontsize ( 7 ));
label ( "200" , P ( 0 , 200 ), W , fontsize ( 7 ));
label ( "250" , P ( 0 , 250 ), W , fontsize ( 7 ));
label ( "300" , P ( 0 , 300 ), W , fontsize ( 7 ));
label ( "Age (years)" , ( 227.5 , 13 ), fontsize ( 8 ));
label ( rotate ( 90 ) * Label ( "People" ), ( 13 , 132 ), fontsize ( 8 ));
// BEGIN EXAMPLE
real [][] d = input ( "data/ages.tsv" ). line ();
for ( int i = 0 ; i < d . length ; ++ i ) {
real [] v = d [ i ];
rect ( v [ 1 ], 0 , v [ 2 ], v [ 3 ], Blue );
}
// END EXAMPLE
shipout ( "VIZ-06-003" , bbox ( 0 ));
Native build log
Download: Source · Source + data ZIP · SVG · PDF · PNG
Copy link VIZ-06-004 MetaPost: histogram MetaPost reads numeric fields with gdata and scantokens, then constructs the chart with paths, TeX labels and colour interpolation.
Back to comparison gallery Drawing commands numeric n , v [][];
n := 0 ;
gdata ( "data/ages.tsv" , c ,
n := n + 1 ;
for j = 1 upto 10 :
v [ n ][ j ] := scantokens c [ j ];
endfor
);
for k = 1 upto n :
rect ( v [ k ][ 2 ], 0 , v [ k ][ 3 ], v [ k ][ 4 ], Blue );
endfor
Actual MetaPost output VIZ-06-004 · native vector output MetaPost · exit 0
Command or choice Meaning gdata + pathsNative drawing method used here. ages.tsvShared numeric input; column definitions are in data/recipes.json. Fixed rangesSame axis domain and statistical definition in all five implementations.
Complete standalone program input graph ;
prologues := 3 ;
outputformat := "svg" ;
outputtemplate := "VIZ-06-004.svg" ;
color Blue , Teal , Orange , Wash , Missing ;
Blue := ( 0 , 84 / 255 , 159 / 255 );
Teal := ( 0 , 177 / 255 , 183 / 255 );
Orange := ( 246 / 255 , 168 / 255 , 0 );
Wash := ( 232 / 255 , 241 / 255 , 250 / 255 );
Missing := ( 236 / 255 , 236 / 255 , 237 / 255 );
vardef P ( expr x , y ) =
( 55 + 345 * ( x - ( 0 )) / ( 75 ), 45 + 175 * ( y - ( 0 )) / ( 300 ))
enddef ;
def rect ( expr x , y , xx , yy , col ) =
fill P ( x , y ) -- P ( xx , y ) -- P ( xx , yy ) -- P ( x , yy ) -- cycle withcolor col ;
enddef ;
beginfig ( 1 );
fill unitsquare xscaled 420 yscaled 280 withcolor white ;
label .llft ( "VIZ-06-004" infont "cmr8" , ( 414 , 272 ));
label .rt ( btex Known ages: n=2,205; 2 ages missing etex scaled .65 , ( 55 , 246 ));
draw P ( 0 , 300 ) -- P ( 0 , 0 ) -- P ( 75 , 0 ) withcolor .4 white ;
label .bot ( btex 0 etex scaled .7 , P ( 0 , 0 ));
label .bot ( btex 15 etex scaled .7 , P ( 15 , 0 ));
label .bot ( btex 30 etex scaled .7 , P ( 30 , 0 ));
label .bot ( btex 45 etex scaled .7 , P ( 45 , 0 ));
label .bot ( btex 60 etex scaled .7 , P ( 60 , 0 ));
label .bot ( btex 75 etex scaled .7 , P ( 75 , 0 ));
label .lft ( btex 0 etex scaled .7 , P ( 0 , 0 ));
label .lft ( btex 50 etex scaled .7 , P ( 0 , 50 ));
label .lft ( btex 100 etex scaled .7 , P ( 0 , 100 ));
label .lft ( btex 150 etex scaled .7 , P ( 0 , 150 ));
label .lft ( btex 200 etex scaled .7 , P ( 0 , 200 ));
label .lft ( btex 250 etex scaled .7 , P ( 0 , 250 ));
label .lft ( btex 300 etex scaled .7 , P ( 0 , 300 ));
label ( btex Age (years) etex scaled .8 , ( 227.5 , 13 ));
label ( btex People etex scaled .8 rotated 90 , ( 13 , 132 ));
% BEGIN EXAMPLE
numeric n , v [][];
n := 0 ;
gdata ( "data/ages.tsv" , c ,
n := n + 1 ;
for j = 1 upto 10 :
v [ n ][ j ] := scantokens c [ j ];
endfor
);
for k = 1 upto n :
rect ( v [ k ][ 2 ], 0 , v [ k ][ 3 ], v [ k ][ 4 ], Blue );
endfor
% END EXAMPLE
setbounds currentpicture to unitsquare xscaled 420 yscaled 280 ;
endfig ;
end .
Native build log Download: Source · Source + data ZIP · SVG · PDF · PNG
Copy link VIZ-06-005 GMT: histogram GMT reads selected columns through its native plotting modules; column expressions are performed by the shown local awk pipeline. The shared tables determine the statistics.
Back to comparison gallery Drawing commands plot data/ages.tsv -i0,3 -Sb13.8p+b0 -G#00549f
Actual GMT output VIZ-06-005 · native vector output GMT · exit 0
Command or choice Meaning plot -SbNative drawing method used here. ages.tsvShared numeric input; column definitions are in data/recipes.json. Fixed rangesSame axis domain and statistical definition in all five implementations.
Complete standalone program #!/usr/bin/env bash
set -euo pipefail
export GMT_USERDIR = " $PWD /.gmt"
mkdir -p " $GMT_USERDIR "
gmt begin VIZ-06-005 pdf
gmt set \
FONT_ANNOT_PRIMARY 7p \
FONT_LABEL 8p \
FONT_TITLE 8p \
MAP_TITLE_OFFSET 4p \
MAP_FRAME_TYPE plain \
MAP_TICK_LENGTH_PRIMARY 3p
gmt plot -R0/420/0/280 -JX420p/280p -Gwhite -W0p <<'CANVAS'
0 0
420 0
420 280
0 280
CANVAS
gmt text -F+f8p+jTR <<'ID'
414 272 VIZ-06-005
ID
gmt text -F+f7p+jML <<'LEGEND'
55 246 Known ages: n=2,205; 2 ages missing
LEGEND
gmt basemap -R0/75/0/300 -JX345p/175p -X55p -Y45p -Bpxa15+l"Age (years)" \
-Bpya50+l"People" -BWS
# BEGIN EXAMPLE
gmt plot data/ages.tsv -i0,3 -Sb13.8p+b0 -G#00549f
# END EXAMPLE
gmt end
Native build log
Download: Source · Source + data ZIP · SVG · PDF · PNG
Copy link VIZ-07-001 PGFplots / TikZ: ecdf Plot the precomputed vertical-and-horizontal vertices directly, preserving ties and right continuity.
Back to comparison gallery Drawing commands \begin { axis} [
width=345bp, height=175bp,
scale only axis, at={ (55bp,45bp)} ,
anchor=south west, xmin=0,
xmax=75, ymin=0,
ymax=1, xtick={ 0,15,30,45,60,75} ,
ytick={ 0,0.25,0.5,0.75,1} , xlabel={ Age (years)} ,
ylabel={ Cumulative fraction} , axis lines=left,
tick align=outside, enlargelimits=false,
clip=false
]
\addplot [Blue,thick,no marks]
table[x index=0,y index=1]{ data/ecdf.tsv} ;
\end { axis}
Actual PGFplots / TikZ output VIZ-07-001 · native vector output PGFplots / TikZ · exit 0
Command or choice Meaning table + line pathNative drawing method used here. ecdf.tsvShared numeric input; column definitions are in data/recipes.json. Fixed rangesSame axis domain and statistical definition in all five implementations.
Complete standalone program \documentclass [tikz,border=0pt] { standalone}
\usepackage { pgfplots,pgfplotstable}
\usepgfplotslibrary { statistics,groupplots}
\pgfplotsset { compat=1.18}
\definecolor { Blue}{ HTML}{ 00549F}
\definecolor { Teal}{ HTML}{ 00B1B7}
\definecolor { Orange}{ HTML}{ F6A800}
\definecolor { Wash}{ HTML}{ E8F1FA}
\definecolor { Missing}{ HTML}{ ECECED}
\begin { document}
\begin { tikzpicture} [font=\fontsize { 8}{ 10} \selectfont ]
\path [use as bounding box,fill=white] (0,0) rectangle (420bp,280bp);
\node [anchor=north east] at (414bp,272bp) { VIZ-07-001} ;
\node [anchor=west,font=\fontsize{7}{9}\selectfont] at
(55bp,246bp) { Known ages: n=2,205; 2 ages missing} ;
% BEGIN EXAMPLE
\begin { axis} [
width=345bp, height=175bp,
scale only axis, at={ (55bp,45bp)} ,
anchor=south west, xmin=0,
xmax=75, ymin=0,
ymax=1, xtick={ 0,15,30,45,60,75} ,
ytick={ 0,0.25,0.5,0.75,1} , xlabel={ Age (years)} ,
ylabel={ Cumulative fraction} , axis lines=left,
tick align=outside, enlargelimits=false,
clip=false
]
\addplot [Blue,thick,no marks]
table[x index=0,y index=1]{ data/ecdf.tsv} ;
\end { axis}
% END EXAMPLE
\end { tikzpicture}
\end { document}
Native build log Download: Source · Source + data ZIP · SVG · PDF · PNG
Copy link VIZ-07-002 gnuplot: ecdf The shared explicit step vertices make an ordinary line plot an exact empirical CDF.
Back to comparison gallery Drawing commands plot "data/ecdf.tsv" using 1 : 2 with lines lw 1.4 lc rgb "#00549f"
Actual gnuplot output VIZ-07-002 · native vector output gnuplot · exit 0
Command or choice Meaning with linesNative drawing method used here. ecdf.tsvShared numeric input; column definitions are in data/recipes.json. Fixed rangesSame axis domain and statistical definition in all five implementations.
Complete standalone program set terminal pdfcairo size 5.833333 in , 3.888889 in font "Helvetica,8"
set output "VIZ-07-002.pdf"
set lmargin at screen 0.13095238095238096
set rmargin at screen 0.9523809523809523
set bmargin at screen 0.16071428571428573
set tmargin at screen 0.7857142857142857
set xrange [ 0 : 75 ]
set yrange [ 0 : 1 ]
set xtics ( "0" 0 , "15" 15 , "30" 30 , "45" 45 , "60" 60 , "75" 75 )
set ytics ( "0" 0 , "0.25" 0.25 , "0.5" 0.5 , "0.75" 0.75 , "1" 1 )
set xlabel "Age (years)"
set ylabel "Cumulative fraction"
set border 3
set tics out nomirror
unset key
set style fill solid 1.0 noborder
set label 1 "VIZ-07-002" at screen .985 , .97 right
set label 2 "Known ages: n=2,205; 2 ages missing" at screen .13 , .88 left font ",7"
set palette defined ( 0 "#e8f1fa" , 100 "#00549f" )
set cbrange [ 0 : 100 ]
unset colorbox
# BEGIN EXAMPLE
plot "data/ecdf.tsv" using 1 : 2 with lines lw 1.4 lc rgb "#00549f"
# END EXAMPLE
unset output
Native build log
Download: Source · Source + data ZIP · SVG · PDF · PNG
Copy link VIZ-07-003 Asymptote: ecdf Asymptote reads the shared numeric table into typed arrays and draws this chart with paths, pens and physical-size symbols.
Back to comparison gallery Drawing commands real [][] d = input ( "data/ecdf.tsv" ). line ();
path curve = P ( d [ 0 ][ 0 ], d [ 0 ][ 1 ]);
for ( int i = 1 ; i < d . length ; ++ i )
curve = curve -- P ( d [ i ][ 0 ], d [ i ][ 1 ]);
draw ( curve , Blue + linewidth ( 1 ));
Actual Asymptote output VIZ-07-003 · native vector output Asymptote · exit 0
Command or choice Meaning arrays + native pathsNative drawing method used here. ecdf.tsvShared numeric input; column definitions are in data/recipes.json. Fixed rangesSame axis domain and statistical definition in all five implementations.
Complete standalone program import graph ;
size ( 420 bp , 280 bp , IgnoreAspect );
defaultpen ( fontsize ( 8 ));
pen Blue = rgb ( 0 , 84 / 255 , 159 / 255 ), Teal = rgb ( 0 , 177 / 255 , 183 / 255 );
pen Orange = rgb ( 246 / 255 , 168 / 255 , 0 ), Wash = rgb ( 232 / 255 , 241 / 255 , 250 / 255 );
pen Missing = rgb ( 236 / 255 , 236 / 255 , 237 / 255 );
pair P ( real x , real y ) {
return ( 55 + 345 * ( x - ( 0 )) / ( 75 ), 45 + 175 * ( y - ( 0 )) / ( 1 ));
}
void rect ( real x , real y , real xx , real yy , pen p ) {
fill ( P ( x , y ) -- P ( xx , y ) -- P ( xx , yy ) -- P ( x , yy ) -- cycle , p );
}
fill ( box (( 0 , 0 ), ( 420 , 280 )), white );
label ( "VIZ-07-003" , ( 414 , 272 ), SW , fontsize ( 8 ));
label ( "Known ages: n=2,205; 2 ages missing" , ( 55 , 246 ), E , fontsize ( 7 ));
draw ( P ( 0 , 1 ) -- P ( 0 , 0 ) -- P ( 75 , 0 ), gray ( .4 ));
label ( "0" , P ( 0 , 0 ), S , fontsize ( 7 ));
label ( "15" , P ( 15 , 0 ), S , fontsize ( 7 ));
label ( "30" , P ( 30 , 0 ), S , fontsize ( 7 ));
label ( "45" , P ( 45 , 0 ), S , fontsize ( 7 ));
label ( "60" , P ( 60 , 0 ), S , fontsize ( 7 ));
label ( "75" , P ( 75 , 0 ), S , fontsize ( 7 ));
label ( "0" , P ( 0 , 0 ), W , fontsize ( 7 ));
label ( "0.25" , P ( 0 , 0.25 ), W , fontsize ( 7 ));
label ( "0.5" , P ( 0 , 0.5 ), W , fontsize ( 7 ));
label ( "0.75" , P ( 0 , 0.75 ), W , fontsize ( 7 ));
label ( "1" , P ( 0 , 1 ), W , fontsize ( 7 ));
label ( "Age (years)" , ( 227.5 , 13 ), fontsize ( 8 ));
label ( rotate ( 90 ) * Label ( "Cumulative fraction" ), ( 13 , 132 ), fontsize ( 8 ));
// BEGIN EXAMPLE
real [][] d = input ( "data/ecdf.tsv" ). line ();
path curve = P ( d [ 0 ][ 0 ], d [ 0 ][ 1 ]);
for ( int i = 1 ; i < d . length ; ++ i )
curve = curve -- P ( d [ i ][ 0 ], d [ i ][ 1 ]);
draw ( curve , Blue + linewidth ( 1 ));
// END EXAMPLE
shipout ( "VIZ-07-003" , bbox ( 0 ));
Native build log
Download: Source · Source + data ZIP · SVG · PDF · PNG
Copy link VIZ-07-004 MetaPost: ecdf MetaPost reads numeric fields with gdata and scantokens, then constructs the chart with paths, TeX labels and colour interpolation.
Back to comparison gallery Drawing commands numeric n , v [][];
n := 0 ;
gdata ( "data/ecdf.tsv" , c ,
n := n + 1 ;
for j = 1 upto 2 :
v [ n ][ j ] := scantokens c [ j ];
endfor
);
path curve ;
curve := P ( v [ 1 ][ 1 ], v [ 1 ][ 2 ]);
for k = 2 upto n :
curve := curve -- P ( v [ k ][ 1 ], v [ k ][ 2 ]);
endfor
draw curve withpen pencircle scaled 1 withcolor Blue ;
Actual MetaPost output VIZ-07-004 · native vector output MetaPost · exit 0
Command or choice Meaning gdata + pathsNative drawing method used here. ecdf.tsvShared numeric input; column definitions are in data/recipes.json. Fixed rangesSame axis domain and statistical definition in all five implementations.
Complete standalone program input graph ;
prologues := 3 ;
outputformat := "svg" ;
outputtemplate := "VIZ-07-004.svg" ;
color Blue , Teal , Orange , Wash , Missing ;
Blue := ( 0 , 84 / 255 , 159 / 255 );
Teal := ( 0 , 177 / 255 , 183 / 255 );
Orange := ( 246 / 255 , 168 / 255 , 0 );
Wash := ( 232 / 255 , 241 / 255 , 250 / 255 );
Missing := ( 236 / 255 , 236 / 255 , 237 / 255 );
vardef P ( expr x , y ) =
( 55 + 345 * ( x - ( 0 )) / ( 75 ), 45 + 175 * ( y - ( 0 )) / ( 1 ))
enddef ;
def rect ( expr x , y , xx , yy , col ) =
fill P ( x , y ) -- P ( xx , y ) -- P ( xx , yy ) -- P ( x , yy ) -- cycle withcolor col ;
enddef ;
beginfig ( 1 );
fill unitsquare xscaled 420 yscaled 280 withcolor white ;
label .llft ( "VIZ-07-004" infont "cmr8" , ( 414 , 272 ));
label .rt ( btex Known ages: n=2,205; 2 ages missing etex scaled .65 , ( 55 , 246 ));
draw P ( 0 , 1 ) -- P ( 0 , 0 ) -- P ( 75 , 0 ) withcolor .4 white ;
label .bot ( btex 0 etex scaled .7 , P ( 0 , 0 ));
label .bot ( btex 15 etex scaled .7 , P ( 15 , 0 ));
label .bot ( btex 30 etex scaled .7 , P ( 30 , 0 ));
label .bot ( btex 45 etex scaled .7 , P ( 45 , 0 ));
label .bot ( btex 60 etex scaled .7 , P ( 60 , 0 ));
label .bot ( btex 75 etex scaled .7 , P ( 75 , 0 ));
label .lft ( btex 0 etex scaled .7 , P ( 0 , 0 ));
label .lft ( btex 0.25 etex scaled .7 , P ( 0 , 0.25 ));
label .lft ( btex 0.5 etex scaled .7 , P ( 0 , 0.5 ));
label .lft ( btex 0.75 etex scaled .7 , P ( 0 , 0.75 ));
label .lft ( btex 1 etex scaled .7 , P ( 0 , 1 ));
label ( btex Age (years) etex scaled .8 , ( 227.5 , 13 ));
label ( btex Cumulative fraction etex scaled .8 rotated 90 , ( 13 , 132 ));
% BEGIN EXAMPLE
numeric n , v [][];
n := 0 ;
gdata ( "data/ecdf.tsv" , c ,
n := n + 1 ;
for j = 1 upto 2 :
v [ n ][ j ] := scantokens c [ j ];
endfor
);
path curve ;
curve := P ( v [ 1 ][ 1 ], v [ 1 ][ 2 ]);
for k = 2 upto n :
curve := curve -- P ( v [ k ][ 1 ], v [ k ][ 2 ]);
endfor
draw curve withpen pencircle scaled 1 withcolor Blue ;
% END EXAMPLE
setbounds currentpicture to unitsquare xscaled 420 yscaled 280 ;
endfig ;
end .
Native build log Download: Source · Source + data ZIP · SVG · PDF · PNG
Copy link VIZ-07-005 GMT: ecdf GMT reads selected columns through its native plotting modules; column expressions are performed by the shown local awk pipeline. The shared tables determine the statistics.
Back to comparison gallery Drawing commands plot data/ecdf.tsv -i0,1 -W1p,#00549f
Actual GMT output VIZ-07-005 · native vector output GMT · exit 0
Command or choice Meaning plot -WNative drawing method used here. ecdf.tsvShared numeric input; column definitions are in data/recipes.json. Fixed rangesSame axis domain and statistical definition in all five implementations.
Complete standalone program #!/usr/bin/env bash
set -euo pipefail
export GMT_USERDIR = " $PWD /.gmt"
mkdir -p " $GMT_USERDIR "
gmt begin VIZ-07-005 pdf
gmt set \
FONT_ANNOT_PRIMARY 7p \
FONT_LABEL 8p \
FONT_TITLE 8p \
MAP_TITLE_OFFSET 4p \
MAP_FRAME_TYPE plain \
MAP_TICK_LENGTH_PRIMARY 3p
gmt plot -R0/420/0/280 -JX420p/280p -Gwhite -W0p <<'CANVAS'
0 0
420 0
420 280
0 280
CANVAS
gmt text -F+f8p+jTR <<'ID'
414 272 VIZ-07-005
ID
gmt text -F+f7p+jML <<'LEGEND'
55 246 Known ages: n=2,205; 2 ages missing
LEGEND
gmt basemap -R0/75/0/1 -JX345p/175p -X55p -Y45p -Bpxa15+l"Age (years)" \
-Bpya0.25+l"Cumulative fraction" -BWS
# BEGIN EXAMPLE
gmt plot data/ecdf.tsv -i0,1 -W1p,#00549f
# END EXAMPLE
gmt end
Native build log
Download: Source · Source + data ZIP · SVG · PDF · PNG
Copy link VIZ-08-001 PGFplots / TikZ: box PGFplots consumes shared minimum, quartiles, median and maximum without recalculating them.
Back to comparison gallery Drawing commands \pgfplotstableread { data/boxes.tsv} \Data
\begin { axis} [
width=345bp, height=175bp,
scale only axis, at={ (55bp,45bp)} ,
anchor=south west, xmin=0.5,
xmax=4.5, ymin=0,
ymax=75, xtick={ 1,2,3,4} ,
ytick={ 0,15,30,45,60,75} , xlabel={ Passenger class / crew} ,
ylabel={ Age (years)} , axis lines=left,
tick align=outside, enlargelimits=false,
clip=false, xticklabels={ 1st,2nd,3rd,Crew}
]
\pgfplotsinvokeforeach { 0,...,3}{ \def\i { #1}
\pgfplotstablegetelem { \i }{ [index]0} \of\Data\let\va\pgfplotsretval
\pgfplotstablegetelem { \i }{ [index]1} \of\Data\let\vb\pgfplotsretval
\pgfplotstablegetelem { \i }{ [index]2} \of\Data\let\vc\pgfplotsretval
\pgfplotstablegetelem { \i }{ [index]3} \of\Data\let\vd\pgfplotsretval
\pgfplotstablegetelem { \i }{ [index]4} \of\Data\let\ve\pgfplotsretval
\pgfplotstablegetelem { \i }{ [index]5} \of\Data\let\vf\pgfplotsretval
\pgfplotstablegetelem { \i }{ [index]6} \of\Data\let\vg\pgfplotsretval
\edef\boxcommand { \noexpand\addplot +[
boxplot prepared={
draw position=\va ,
lower whisker=\vb ,
lower quartile=\vc ,
median=\vd ,
upper quartile=\ve ,
upper whisker=\vf
} ,
boxplot/draw direction=y,
boxplot/box extend=.5,
fill=Wash,
draw=Blue
]
coordinates {} ;}
\boxcommand
}
\end { axis}
Actual PGFplots / TikZ output VIZ-08-001 · native vector output PGFplots / TikZ · exit 0
Command or choice Meaning boxplot preparedNative drawing method used here. boxes.tsvShared numeric input; column definitions are in data/recipes.json. Fixed rangesSame axis domain and statistical definition in all five implementations.
Complete standalone program \documentclass [tikz,border=0pt] { standalone}
\usepackage { pgfplots,pgfplotstable}
\usepgfplotslibrary { statistics,groupplots}
\pgfplotsset { compat=1.18}
\definecolor { Blue}{ HTML}{ 00549F}
\definecolor { Teal}{ HTML}{ 00B1B7}
\definecolor { Orange}{ HTML}{ F6A800}
\definecolor { Wash}{ HTML}{ E8F1FA}
\definecolor { Missing}{ HTML}{ ECECED}
\begin { document}
\begin { tikzpicture} [font=\fontsize { 8}{ 10} \selectfont ]
\path [use as bounding box,fill=white] (0,0) rectangle (420bp,280bp);
\node [anchor=north east] at (414bp,272bp) { VIZ-08-001} ;
\node [anchor=west,font=\fontsize{7}{9}\selectfont] at
(55bp,246bp) { Whiskers: min/max; box: Q1/median/Q3} ;
% BEGIN EXAMPLE
\pgfplotstableread { data/boxes.tsv} \Data
\begin { axis} [
width=345bp, height=175bp,
scale only axis, at={ (55bp,45bp)} ,
anchor=south west, xmin=0.5,
xmax=4.5, ymin=0,
ymax=75, xtick={ 1,2,3,4} ,
ytick={ 0,15,30,45,60,75} , xlabel={ Passenger class / crew} ,
ylabel={ Age (years)} , axis lines=left,
tick align=outside, enlargelimits=false,
clip=false, xticklabels={ 1st,2nd,3rd,Crew}
]
\pgfplotsinvokeforeach { 0,...,3}{ \def\i { #1}
\pgfplotstablegetelem { \i }{ [index]0} \of\Data\let\va\pgfplotsretval
\pgfplotstablegetelem { \i }{ [index]1} \of\Data\let\vb\pgfplotsretval
\pgfplotstablegetelem { \i }{ [index]2} \of\Data\let\vc\pgfplotsretval
\pgfplotstablegetelem { \i }{ [index]3} \of\Data\let\vd\pgfplotsretval
\pgfplotstablegetelem { \i }{ [index]4} \of\Data\let\ve\pgfplotsretval
\pgfplotstablegetelem { \i }{ [index]5} \of\Data\let\vf\pgfplotsretval
\pgfplotstablegetelem { \i }{ [index]6} \of\Data\let\vg\pgfplotsretval
\edef\boxcommand { \noexpand\addplot +[
boxplot prepared={
draw position=\va ,
lower whisker=\vb ,
lower quartile=\vc ,
median=\vd ,
upper quartile=\ve ,
upper whisker=\vf
} ,
boxplot/draw direction=y,
boxplot/box extend=.5,
fill=Wash,
draw=Blue
]
coordinates {} ;}
\boxcommand
}
\end { axis}
% END EXAMPLE
\end { tikzpicture}
\end { document}
Native build log Download: Source · Source + data ZIP · SVG · PDF · PNG
Copy link VIZ-08-002 gnuplot: box Map shared quartiles and extrema to candlestick geometry; a second layer draws the median.
Back to comparison gallery Drawing commands set boxwidth .5 absolute
set style fill solid 1 border lc rgb "#00549f"
plot "data/boxes.tsv" using 1 : 3 : 2 : 6 : 5 \
with candlesticks whiskerbars .5 lw 1 lc rgb "#00549f" fc rgb "#e8f1fa" , \
"" using 1 : 4 : 4 : 4 : 4 \
with candlesticks lw 1.4 lc rgb "#00549f"
Actual gnuplot output VIZ-08-002 · native vector output gnuplot · exit 0
Command or choice Meaning candlesticks + whiskerbarsNative drawing method used here. boxes.tsvShared numeric input; column definitions are in data/recipes.json. Fixed rangesSame axis domain and statistical definition in all five implementations.
Complete standalone program set terminal pdfcairo size 5.833333 in , 3.888889 in font "Helvetica,8"
set output "VIZ-08-002.pdf"
set lmargin at screen 0.13095238095238096
set rmargin at screen 0.9523809523809523
set bmargin at screen 0.16071428571428573
set tmargin at screen 0.7857142857142857
set xrange [ 0.5 : 4.5 ]
set yrange [ 0 : 75 ]
set xtics ( "1st" 1 , "2nd" 2 , "3rd" 3 , "Crew" 4 )
set ytics ( "0" 0 , "15" 15 , "30" 30 , "45" 45 , "60" 60 , "75" 75 )
set xlabel "Passenger class / crew"
set ylabel "Age (years)"
set border 3
set tics out nomirror
unset key
set style fill solid 1.0 noborder
set label 1 "VIZ-08-002" at screen .985 , .97 right
set label 2 "Whiskers: min/max; box: Q1/median/Q3" at screen .13 , .88 left font ",7"
set palette defined ( 0 "#e8f1fa" , 100 "#00549f" )
set cbrange [ 0 : 100 ]
unset colorbox
# BEGIN EXAMPLE
set boxwidth .5 absolute
set style fill solid 1 border lc rgb "#00549f"
plot "data/boxes.tsv" using 1 : 3 : 2 : 6 : 5 \
with candlesticks whiskerbars .5 lw 1 lc rgb "#00549f" fc rgb "#e8f1fa" , \
"" using 1 : 4 : 4 : 4 : 4 \
with candlesticks lw 1.4 lc rgb "#00549f"
# END EXAMPLE
unset output
Native build log
Download: Source · Source + data ZIP · SVG · PDF · PNG
Copy link VIZ-08-003 Asymptote: box Asymptote reads the shared numeric table into typed arrays and draws this chart with paths, pens and physical-size symbols.
Back to comparison gallery Drawing commands real [][] d = input ( "data/boxes.tsv" ). line ();
for ( int i = 0 ; i < d . length ; ++ i ) {
real [] v = d [ i ];
draw ( P ( v [ 0 ], v [ 1 ]) -- P ( v [ 0 ], v [ 5 ]), Blue );
for ( int j = 1 ; j <= 5 ; j += 4 )
draw ( P ( v [ 0 ] - .15 , v [ j ]) -- P ( v [ 0 ] + .15 , v [ j ]), Blue );
rect ( v [ 0 ] - .25 , v [ 2 ], v [ 0 ] + .25 , v [ 4 ], Wash );
draw ( P ( v [ 0 ] - .25 , v [ 2 ]) -- P ( v [ 0 ] + .25 , v [ 2 ]) -- P ( v [ 0 ] + .25 , v [ 4 ]) -- P ( v [ 0 ] - .25 ,
v [ 4 ]) -- cycle , Blue );
draw ( P ( v [ 0 ] - .25 , v [ 3 ]) -- P ( v [ 0 ] + .25 , v [ 3 ]), Blue );
}
Actual Asymptote output VIZ-08-003 · native vector output Asymptote · exit 0
Command or choice Meaning arrays + native pathsNative drawing method used here. boxes.tsvShared numeric input; column definitions are in data/recipes.json. Fixed rangesSame axis domain and statistical definition in all five implementations.
Complete standalone program import graph ;
size ( 420 bp , 280 bp , IgnoreAspect );
defaultpen ( fontsize ( 8 ));
pen Blue = rgb ( 0 , 84 / 255 , 159 / 255 ), Teal = rgb ( 0 , 177 / 255 , 183 / 255 );
pen Orange = rgb ( 246 / 255 , 168 / 255 , 0 ), Wash = rgb ( 232 / 255 , 241 / 255 , 250 / 255 );
pen Missing = rgb ( 236 / 255 , 236 / 255 , 237 / 255 );
pair P ( real x , real y ) {
return ( 55 + 345 * ( x - ( 0.5 )) / ( 4.0 ), 45 + 175 * ( y - ( 0 )) / ( 75 ));
}
void rect ( real x , real y , real xx , real yy , pen p ) {
fill ( P ( x , y ) -- P ( xx , y ) -- P ( xx , yy ) -- P ( x , yy ) -- cycle , p );
}
fill ( box (( 0 , 0 ), ( 420 , 280 )), white );
label ( "VIZ-08-003" , ( 414 , 272 ), SW , fontsize ( 8 ));
label ( "Whiskers: min/max; box: Q1/median/Q3" , ( 55 , 246 ), E , fontsize ( 7 ));
draw ( P ( 0.5 , 75 ) -- P ( 0.5 , 0 ) -- P ( 4.5 , 0 ), gray ( .4 ));
label ( "1st" , P ( 1 , 0 ), S , fontsize ( 7 ));
label ( "2nd" , P ( 2 , 0 ), S , fontsize ( 7 ));
label ( "3rd" , P ( 3 , 0 ), S , fontsize ( 7 ));
label ( "Crew" , P ( 4 , 0 ), S , fontsize ( 7 ));
label ( "0" , P ( 0.5 , 0 ), W , fontsize ( 7 ));
label ( "15" , P ( 0.5 , 15 ), W , fontsize ( 7 ));
label ( "30" , P ( 0.5 , 30 ), W , fontsize ( 7 ));
label ( "45" , P ( 0.5 , 45 ), W , fontsize ( 7 ));
label ( "60" , P ( 0.5 , 60 ), W , fontsize ( 7 ));
label ( "75" , P ( 0.5 , 75 ), W , fontsize ( 7 ));
label ( "Passenger class / crew" , ( 227.5 , 13 ), fontsize ( 8 ));
label ( rotate ( 90 ) * Label ( "Age (years)" ), ( 13 , 132 ), fontsize ( 8 ));
// BEGIN EXAMPLE
real [][] d = input ( "data/boxes.tsv" ). line ();
for ( int i = 0 ; i < d . length ; ++ i ) {
real [] v = d [ i ];
draw ( P ( v [ 0 ], v [ 1 ]) -- P ( v [ 0 ], v [ 5 ]), Blue );
for ( int j = 1 ; j <= 5 ; j += 4 )
draw ( P ( v [ 0 ] - .15 , v [ j ]) -- P ( v [ 0 ] + .15 , v [ j ]), Blue );
rect ( v [ 0 ] - .25 , v [ 2 ], v [ 0 ] + .25 , v [ 4 ], Wash );
draw ( P ( v [ 0 ] - .25 , v [ 2 ]) -- P ( v [ 0 ] + .25 , v [ 2 ]) -- P ( v [ 0 ] + .25 , v [ 4 ]) -- P ( v [ 0 ] - .25 ,
v [ 4 ]) -- cycle , Blue );
draw ( P ( v [ 0 ] - .25 , v [ 3 ]) -- P ( v [ 0 ] + .25 , v [ 3 ]), Blue );
}
// END EXAMPLE
shipout ( "VIZ-08-003" , bbox ( 0 ));
Native build log
Download: Source · Source + data ZIP · SVG · PDF · PNG
Copy link VIZ-08-004 MetaPost: box MetaPost reads numeric fields with gdata and scantokens, then constructs the chart with paths, TeX labels and colour interpolation.
Back to comparison gallery Drawing commands numeric n , v [][];
n := 0 ;
gdata ( "data/boxes.tsv" , c ,
n := n + 1 ;
for j = 1 upto 7 :
v [ n ][ j ] := scantokens c [ j ];
endfor
);
for k = 1 upto n :
draw P ( v [ k ][ 1 ], v [ k ][ 2 ]) -- P ( v [ k ][ 1 ], v [ k ][ 6 ]) withcolor Blue ;
for j = 2 step 4 until 6 :
draw P ( v [ k ][ 1 ] - .15 , v [ k ][ j ]) -- P ( v [ k ][ 1 ] + .15 , v [ k ][ j ]) withcolor Blue ;
endfor
rect ( v [ k ][ 1 ] - .25 , v [ k ][ 3 ], v [ k ][ 1 ] + .25 , v [ k ][ 5 ], Wash );
draw P ( v [ k ][ 1 ] - .25 , v [ k ][ 3 ]) -- P ( v [ k ][ 1 ] + .25 , v [ k ][ 3 ]) -- P ( v [ k ][ 1 ] + .25 ,
v [ k ][ 5 ]) -- P ( v [ k ][ 1 ] - .25 , v [ k ][ 5 ]) -- cycle withcolor Blue ;
draw P ( v [ k ][ 1 ] - .25 , v [ k ][ 4 ]) -- P ( v [ k ][ 1 ] + .25 , v [ k ][ 4 ]) withcolor Blue ;
endfor
Actual MetaPost output VIZ-08-004 · native vector output MetaPost · exit 0
Command or choice Meaning gdata + pathsNative drawing method used here. boxes.tsvShared numeric input; column definitions are in data/recipes.json. Fixed rangesSame axis domain and statistical definition in all five implementations.
Complete standalone program input graph ;
prologues := 3 ;
outputformat := "svg" ;
outputtemplate := "VIZ-08-004.svg" ;
color Blue , Teal , Orange , Wash , Missing ;
Blue := ( 0 , 84 / 255 , 159 / 255 );
Teal := ( 0 , 177 / 255 , 183 / 255 );
Orange := ( 246 / 255 , 168 / 255 , 0 );
Wash := ( 232 / 255 , 241 / 255 , 250 / 255 );
Missing := ( 236 / 255 , 236 / 255 , 237 / 255 );
vardef P ( expr x , y ) =
( 55 + 345 * ( x - ( 0.5 )) / ( 4.0 ), 45 + 175 * ( y - ( 0 )) / ( 75 ))
enddef ;
def rect ( expr x , y , xx , yy , col ) =
fill P ( x , y ) -- P ( xx , y ) -- P ( xx , yy ) -- P ( x , yy ) -- cycle withcolor col ;
enddef ;
beginfig ( 1 );
fill unitsquare xscaled 420 yscaled 280 withcolor white ;
label .llft ( "VIZ-08-004" infont "cmr8" , ( 414 , 272 ));
label .rt ( btex Whiskers: min/max; box: Q1/median/Q3 etex scaled .65 , ( 55 , 246 ));
draw P ( 0.5 , 75 ) -- P ( 0.5 , 0 ) -- P ( 4.5 , 0 ) withcolor .4 white ;
label .bot ( btex 1st etex scaled .7 , P ( 1 , 0 ));
label .bot ( btex 2nd etex scaled .7 , P ( 2 , 0 ));
label .bot ( btex 3rd etex scaled .7 , P ( 3 , 0 ));
label .bot ( btex Crew etex scaled .7 , P ( 4 , 0 ));
label .lft ( btex 0 etex scaled .7 , P ( 0.5 , 0 ));
label .lft ( btex 15 etex scaled .7 , P ( 0.5 , 15 ));
label .lft ( btex 30 etex scaled .7 , P ( 0.5 , 30 ));
label .lft ( btex 45 etex scaled .7 , P ( 0.5 , 45 ));
label .lft ( btex 60 etex scaled .7 , P ( 0.5 , 60 ));
label .lft ( btex 75 etex scaled .7 , P ( 0.5 , 75 ));
label ( btex Passenger class / crew etex scaled .8 , ( 227.5 , 13 ));
label ( btex Age (years) etex scaled .8 rotated 90 , ( 13 , 132 ));
% BEGIN EXAMPLE
numeric n , v [][];
n := 0 ;
gdata ( "data/boxes.tsv" , c ,
n := n + 1 ;
for j = 1 upto 7 :
v [ n ][ j ] := scantokens c [ j ];
endfor
);
for k = 1 upto n :
draw P ( v [ k ][ 1 ], v [ k ][ 2 ]) -- P ( v [ k ][ 1 ], v [ k ][ 6 ]) withcolor Blue ;
for j = 2 step 4 until 6 :
draw P ( v [ k ][ 1 ] - .15 , v [ k ][ j ]) -- P ( v [ k ][ 1 ] + .15 , v [ k ][ j ]) withcolor Blue ;
endfor
rect ( v [ k ][ 1 ] - .25 , v [ k ][ 3 ], v [ k ][ 1 ] + .25 , v [ k ][ 5 ], Wash );
draw P ( v [ k ][ 1 ] - .25 , v [ k ][ 3 ]) -- P ( v [ k ][ 1 ] + .25 , v [ k ][ 3 ]) -- P ( v [ k ][ 1 ] + .25 ,
v [ k ][ 5 ]) -- P ( v [ k ][ 1 ] - .25 , v [ k ][ 5 ]) -- cycle withcolor Blue ;
draw P ( v [ k ][ 1 ] - .25 , v [ k ][ 4 ]) -- P ( v [ k ][ 1 ] + .25 , v [ k ][ 4 ]) withcolor Blue ;
endfor
% END EXAMPLE
setbounds currentpicture to unitsquare xscaled 420 yscaled 280 ;
endfig ;
end .
Native build log Download: Source · Source + data ZIP · SVG · PDF · PNG
Copy link VIZ-08-005 GMT: box GMT reads selected columns through its native plotting modules; column expressions are performed by the shown local awk pipeline. The shared tables determine the statistics.
Back to comparison gallery Drawing commands plot data/boxes.tsv -i0,3,1,2,4,5 -EY+w43p/26p+p0.8p,#00549f -G#e8f1fa -W1p,#00549f
Actual GMT output VIZ-08-005 · native vector output GMT · exit 0
Command or choice Meaning plot -EYNative drawing method used here. boxes.tsvShared numeric input; column definitions are in data/recipes.json. Fixed rangesSame axis domain and statistical definition in all five implementations.
Complete standalone program #!/usr/bin/env bash
set -euo pipefail
export GMT_USERDIR = " $PWD /.gmt"
mkdir -p " $GMT_USERDIR "
gmt begin VIZ-08-005 pdf
gmt set \
FONT_ANNOT_PRIMARY 7p \
FONT_LABEL 8p \
FONT_TITLE 8p \
MAP_TITLE_OFFSET 4p \
MAP_FRAME_TYPE plain \
MAP_TICK_LENGTH_PRIMARY 3p
gmt plot -R0/420/0/280 -JX420p/280p -Gwhite -W0p <<'CANVAS'
0 0
420 0
420 280
0 280
CANVAS
gmt text -F+f8p+jTR <<'ID'
414 272 VIZ-08-005
ID
gmt text -F+f7p+jML <<'LEGEND'
55 246 Whiskers: min/max; box: Q1/median/Q3
LEGEND
gmt basemap -R0.5/4.5/0/75 -JX345p/175p -X55p -Y45p \
-Bpxcdata/classes-x.txt+l"Passenger class / crew" -Bpya15+l"Age (years)" -BWS
# BEGIN EXAMPLE
gmt plot data/boxes.tsv -i0,3,1,2,4,5 -EY+w43p/26p+p0.8p,#00549f -G#e8f1fa -W1p,#00549f
# END EXAMPLE
gmt end
Native build log
Download: Source · Source + data ZIP · SVG · PDF · PNG
Copy link VIZ-09-001 PGFplots / TikZ: violin Four shared KDE polygons become closed filled paths; PGFplots handles only axes and geometry.
Back to comparison gallery Drawing commands \begin { axis} [
width=345bp, height=175bp,
scale only axis, at={ (55bp,45bp)} ,
anchor=south west, xmin=0.5,
xmax=4.5, ymin=0,
ymax=75, xtick={ 1,2,3,4} ,
ytick={ 0,15,30,45,60,75} , xlabel={ Passenger class / crew} ,
ylabel={ Age (years)} , axis lines=left,
tick align=outside, enlargelimits=false,
clip=false, xticklabels={ 1st,2nd,3rd,Crew}
]
\addplot [fill=Wash,draw=Blue,thin]
table[x index=0,y index=1]{ data/violin-1.tsv} \closedcycle ;
\addplot [fill=Wash,draw=Blue,thin]
table[x index=0,y index=1]{ data/violin-2.tsv} \closedcycle ;
\addplot [fill=Wash,draw=Blue,thin]
table[x index=0,y index=1]{ data/violin-3.tsv} \closedcycle ;
\addplot [fill=Wash,draw=Blue,thin]
table[x index=0,y index=1]{ data/violin-4.tsv} \closedcycle ;
\end { axis}
Actual PGFplots / TikZ output VIZ-09-001 · native vector output PGFplots / TikZ · exit 0
Command or choice Meaning closedcycleNative drawing method used here. violin-1.tsvShared numeric input; column definitions are in data/recipes.json. Fixed rangesSame axis domain and statistical definition in all five implementations.
Complete standalone program \documentclass [tikz,border=0pt] { standalone}
\usepackage { pgfplots,pgfplotstable}
\usepgfplotslibrary { statistics,groupplots}
\pgfplotsset { compat=1.18}
\definecolor { Blue}{ HTML}{ 00549F}
\definecolor { Teal}{ HTML}{ 00B1B7}
\definecolor { Orange}{ HTML}{ F6A800}
\definecolor { Wash}{ HTML}{ E8F1FA}
\definecolor { Missing}{ HTML}{ ECECED}
\begin { document}
\begin { tikzpicture} [font=\fontsize { 8}{ 10} \selectfont ]
\path [use as bounding box,fill=white] (0,0) rectangle (420bp,280bp);
\node [anchor=north east] at (414bp,272bp) { VIZ-09-001} ;
\node [anchor=west,font=\fontsize{7}{9}\selectfont] at
(55bp,246bp) { Gaussian KDE: bandwidth 3 years; common width scale} ;
% BEGIN EXAMPLE
\begin { axis} [
width=345bp, height=175bp,
scale only axis, at={ (55bp,45bp)} ,
anchor=south west, xmin=0.5,
xmax=4.5, ymin=0,
ymax=75, xtick={ 1,2,3,4} ,
ytick={ 0,15,30,45,60,75} , xlabel={ Passenger class / crew} ,
ylabel={ Age (years)} , axis lines=left,
tick align=outside, enlargelimits=false,
clip=false, xticklabels={ 1st,2nd,3rd,Crew}
]
\addplot [fill=Wash,draw=Blue,thin]
table[x index=0,y index=1]{ data/violin-1.tsv} \closedcycle ;
\addplot [fill=Wash,draw=Blue,thin]
table[x index=0,y index=1]{ data/violin-2.tsv} \closedcycle ;
\addplot [fill=Wash,draw=Blue,thin]
table[x index=0,y index=1]{ data/violin-3.tsv} \closedcycle ;
\addplot [fill=Wash,draw=Blue,thin]
table[x index=0,y index=1]{ data/violin-4.tsv} \closedcycle ;
\end { axis}
% END EXAMPLE
\end { tikzpicture}
\end { document}
Native build log Download: Source · Source + data ZIP · SVG · PDF · PNG
Copy link VIZ-09-002 gnuplot: violin Read four prepared polygon boundaries and fill their closed interiors.
Back to comparison gallery Drawing commands plot "data/violin-1.tsv" using 1 : 2 \
with filledcurves closed fc rgb "#e8f1fa" lc rgb "#00549f" , \
"data/violin-2.tsv" using 1 : 2 \
with filledcurves closed fc rgb "#e8f1fa" lc rgb "#00549f" , \
"data/violin-3.tsv" using 1 : 2 \
with filledcurves closed fc rgb "#e8f1fa" lc rgb "#00549f" , \
"data/violin-4.tsv" using 1 : 2 \
with filledcurves closed fc rgb "#e8f1fa" lc rgb "#00549f" , \
"data/violin-1.tsv" using 1 : 2 \
with lines lc rgb "#00549f" , \
"data/violin-2.tsv" using 1 : 2 \
with lines lc rgb "#00549f" , \
"data/violin-3.tsv" using 1 : 2 \
with lines lc rgb "#00549f" , \
"data/violin-4.tsv" using 1 : 2 \
with lines lc rgb "#00549f"
Actual gnuplot output VIZ-09-002 · native vector output gnuplot · exit 0
Command or choice Meaning filledcurves closedNative drawing method used here. violin-1.tsvShared numeric input; column definitions are in data/recipes.json. Fixed rangesSame axis domain and statistical definition in all five implementations.
Complete standalone program set terminal pdfcairo size 5.833333 in , 3.888889 in font "Helvetica,8"
set output "VIZ-09-002.pdf"
set lmargin at screen 0.13095238095238096
set rmargin at screen 0.9523809523809523
set bmargin at screen 0.16071428571428573
set tmargin at screen 0.7857142857142857
set xrange [ 0.5 : 4.5 ]
set yrange [ 0 : 75 ]
set xtics ( "1st" 1 , "2nd" 2 , "3rd" 3 , "Crew" 4 )
set ytics ( "0" 0 , "15" 15 , "30" 30 , "45" 45 , "60" 60 , "75" 75 )
set xlabel "Passenger class / crew"
set ylabel "Age (years)"
set border 3
set tics out nomirror
unset key
set style fill solid 1.0 noborder
set label 1 "VIZ-09-002" at screen .985 , .97 right
set label 2 "Gaussian KDE: bandwidth 3 years; common width scale" at screen .13 , .88 \
left font ",7"
set palette defined ( 0 "#e8f1fa" , 100 "#00549f" )
set cbrange [ 0 : 100 ]
unset colorbox
# BEGIN EXAMPLE
plot "data/violin-1.tsv" using 1 : 2 \
with filledcurves closed fc rgb "#e8f1fa" lc rgb "#00549f" , \
"data/violin-2.tsv" using 1 : 2 \
with filledcurves closed fc rgb "#e8f1fa" lc rgb "#00549f" , \
"data/violin-3.tsv" using 1 : 2 \
with filledcurves closed fc rgb "#e8f1fa" lc rgb "#00549f" , \
"data/violin-4.tsv" using 1 : 2 \
with filledcurves closed fc rgb "#e8f1fa" lc rgb "#00549f" , \
"data/violin-1.tsv" using 1 : 2 \
with lines lc rgb "#00549f" , \
"data/violin-2.tsv" using 1 : 2 \
with lines lc rgb "#00549f" , \
"data/violin-3.tsv" using 1 : 2 \
with lines lc rgb "#00549f" , \
"data/violin-4.tsv" using 1 : 2 \
with lines lc rgb "#00549f"
# END EXAMPLE
unset output
Native build log
Download: Source · Source + data ZIP · SVG · PDF · PNG
Copy link VIZ-09-003 Asymptote: violin Asymptote reads the shared numeric table into typed arrays and draws this chart with paths, pens and physical-size symbols.
Back to comparison gallery Drawing commands for ( int j = 1 ; j <= 4 ; ++ j ) {
real [][] v = input ( "data/violin-" + string ( j ) + ".tsv" ). line ();
path curve = P ( v [ 0 ][ 0 ], v [ 0 ][ 1 ]);
for ( int i = 1 ; i < v . length ; ++ i )
curve = curve -- P ( v [ i ][ 0 ], v [ i ][ 1 ]);
filldraw ( curve -- cycle , Wash , Blue );
}
Actual Asymptote output VIZ-09-003 · native vector output Asymptote · exit 0
Command or choice Meaning arrays + native pathsNative drawing method used here. violin-1.tsvShared numeric input; column definitions are in data/recipes.json. Fixed rangesSame axis domain and statistical definition in all five implementations.
Complete standalone program import graph ;
size ( 420 bp , 280 bp , IgnoreAspect );
defaultpen ( fontsize ( 8 ));
pen Blue = rgb ( 0 , 84 / 255 , 159 / 255 ), Teal = rgb ( 0 , 177 / 255 , 183 / 255 );
pen Orange = rgb ( 246 / 255 , 168 / 255 , 0 ), Wash = rgb ( 232 / 255 , 241 / 255 , 250 / 255 );
pen Missing = rgb ( 236 / 255 , 236 / 255 , 237 / 255 );
pair P ( real x , real y ) {
return ( 55 + 345 * ( x - ( 0.5 )) / ( 4.0 ), 45 + 175 * ( y - ( 0 )) / ( 75 ));
}
void rect ( real x , real y , real xx , real yy , pen p ) {
fill ( P ( x , y ) -- P ( xx , y ) -- P ( xx , yy ) -- P ( x , yy ) -- cycle , p );
}
fill ( box (( 0 , 0 ), ( 420 , 280 )), white );
label ( "VIZ-09-003" , ( 414 , 272 ), SW , fontsize ( 8 ));
label ( "Gaussian KDE: bandwidth 3 years; common width scale" , ( 55 , 246 ), E , fontsize ( 7 ));
draw ( P ( 0.5 , 75 ) -- P ( 0.5 , 0 ) -- P ( 4.5 , 0 ), gray ( .4 ));
label ( "1st" , P ( 1 , 0 ), S , fontsize ( 7 ));
label ( "2nd" , P ( 2 , 0 ), S , fontsize ( 7 ));
label ( "3rd" , P ( 3 , 0 ), S , fontsize ( 7 ));
label ( "Crew" , P ( 4 , 0 ), S , fontsize ( 7 ));
label ( "0" , P ( 0.5 , 0 ), W , fontsize ( 7 ));
label ( "15" , P ( 0.5 , 15 ), W , fontsize ( 7 ));
label ( "30" , P ( 0.5 , 30 ), W , fontsize ( 7 ));
label ( "45" , P ( 0.5 , 45 ), W , fontsize ( 7 ));
label ( "60" , P ( 0.5 , 60 ), W , fontsize ( 7 ));
label ( "75" , P ( 0.5 , 75 ), W , fontsize ( 7 ));
label ( "Passenger class / crew" , ( 227.5 , 13 ), fontsize ( 8 ));
label ( rotate ( 90 ) * Label ( "Age (years)" ), ( 13 , 132 ), fontsize ( 8 ));
// BEGIN EXAMPLE
for ( int j = 1 ; j <= 4 ; ++ j ) {
real [][] v = input ( "data/violin-" + string ( j ) + ".tsv" ). line ();
path curve = P ( v [ 0 ][ 0 ], v [ 0 ][ 1 ]);
for ( int i = 1 ; i < v . length ; ++ i )
curve = curve -- P ( v [ i ][ 0 ], v [ i ][ 1 ]);
filldraw ( curve -- cycle , Wash , Blue );
}
// END EXAMPLE
shipout ( "VIZ-09-003" , bbox ( 0 ));
Native build log
Download: Source · Source + data ZIP · SVG · PDF · PNG
Copy link VIZ-09-004 MetaPost: violin MetaPost reads numeric fields with gdata and scantokens, then constructs the chart with paths, TeX labels and colour interpolation.
Back to comparison gallery Drawing commands path curve ;
gdata ( "data/violin-1.tsv" , c ,
if i = 1 :
curve := P ( scantokens c1 , scantokens c2 );
else :
curve := curve -- P ( scantokens c1 , scantokens c2 );
fi
);
fill curve -- cycle withcolor Wash ;
draw curve -- cycle withcolor Blue ;
gdata ( "data/violin-2.tsv" , c ,
if i = 1 :
curve := P ( scantokens c1 , scantokens c2 );
else :
curve := curve -- P ( scantokens c1 , scantokens c2 );
fi
);
fill curve -- cycle withcolor Wash ;
draw curve -- cycle withcolor Blue ;
gdata ( "data/violin-3.tsv" , c ,
if i = 1 :
curve := P ( scantokens c1 , scantokens c2 );
else :
curve := curve -- P ( scantokens c1 , scantokens c2 );
fi
);
fill curve -- cycle withcolor Wash ;
draw curve -- cycle withcolor Blue ;
gdata ( "data/violin-4.tsv" , c ,
if i = 1 :
curve := P ( scantokens c1 , scantokens c2 );
else :
curve := curve -- P ( scantokens c1 , scantokens c2 );
fi
);
fill curve -- cycle withcolor Wash ;
draw curve -- cycle withcolor Blue ;
Actual MetaPost output VIZ-09-004 · native vector output MetaPost · exit 0
Command or choice Meaning gdata + pathsNative drawing method used here. violin-1.tsvShared numeric input; column definitions are in data/recipes.json. Fixed rangesSame axis domain and statistical definition in all five implementations.
Complete standalone program input graph ;
prologues := 3 ;
outputformat := "svg" ;
outputtemplate := "VIZ-09-004.svg" ;
color Blue , Teal , Orange , Wash , Missing ;
Blue := ( 0 , 84 / 255 , 159 / 255 );
Teal := ( 0 , 177 / 255 , 183 / 255 );
Orange := ( 246 / 255 , 168 / 255 , 0 );
Wash := ( 232 / 255 , 241 / 255 , 250 / 255 );
Missing := ( 236 / 255 , 236 / 255 , 237 / 255 );
vardef P ( expr x , y ) =
( 55 + 345 * ( x - ( 0.5 )) / ( 4.0 ), 45 + 175 * ( y - ( 0 )) / ( 75 ))
enddef ;
def rect ( expr x , y , xx , yy , col ) =
fill P ( x , y ) -- P ( xx , y ) -- P ( xx , yy ) -- P ( x , yy ) -- cycle withcolor col ;
enddef ;
beginfig ( 1 );
fill unitsquare xscaled 420 yscaled 280 withcolor white ;
label .llft ( "VIZ-09-004" infont "cmr8" , ( 414 , 272 ));
label .rt ( btex Gaussian KDE: bandwidth 3 years; common width scale etex scaled .65 ,
( 55 , 246 ));
draw P ( 0.5 , 75 ) -- P ( 0.5 , 0 ) -- P ( 4.5 , 0 ) withcolor .4 white ;
label .bot ( btex 1st etex scaled .7 , P ( 1 , 0 ));
label .bot ( btex 2nd etex scaled .7 , P ( 2 , 0 ));
label .bot ( btex 3rd etex scaled .7 , P ( 3 , 0 ));
label .bot ( btex Crew etex scaled .7 , P ( 4 , 0 ));
label .lft ( btex 0 etex scaled .7 , P ( 0.5 , 0 ));
label .lft ( btex 15 etex scaled .7 , P ( 0.5 , 15 ));
label .lft ( btex 30 etex scaled .7 , P ( 0.5 , 30 ));
label .lft ( btex 45 etex scaled .7 , P ( 0.5 , 45 ));
label .lft ( btex 60 etex scaled .7 , P ( 0.5 , 60 ));
label .lft ( btex 75 etex scaled .7 , P ( 0.5 , 75 ));
label ( btex Passenger class / crew etex scaled .8 , ( 227.5 , 13 ));
label ( btex Age (years) etex scaled .8 rotated 90 , ( 13 , 132 ));
% BEGIN EXAMPLE
path curve ;
gdata ( "data/violin-1.tsv" , c ,
if i = 1 :
curve := P ( scantokens c1 , scantokens c2 );
else :
curve := curve -- P ( scantokens c1 , scantokens c2 );
fi
);
fill curve -- cycle withcolor Wash ;
draw curve -- cycle withcolor Blue ;
gdata ( "data/violin-2.tsv" , c ,
if i = 1 :
curve := P ( scantokens c1 , scantokens c2 );
else :
curve := curve -- P ( scantokens c1 , scantokens c2 );
fi
);
fill curve -- cycle withcolor Wash ;
draw curve -- cycle withcolor Blue ;
gdata ( "data/violin-3.tsv" , c ,
if i = 1 :
curve := P ( scantokens c1 , scantokens c2 );
else :
curve := curve -- P ( scantokens c1 , scantokens c2 );
fi
);
fill curve -- cycle withcolor Wash ;
draw curve -- cycle withcolor Blue ;
gdata ( "data/violin-4.tsv" , c ,
if i = 1 :
curve := P ( scantokens c1 , scantokens c2 );
else :
curve := curve -- P ( scantokens c1 , scantokens c2 );
fi
);
fill curve -- cycle withcolor Wash ;
draw curve -- cycle withcolor Blue ;
% END EXAMPLE
setbounds currentpicture to unitsquare xscaled 420 yscaled 280 ;
endfig ;
end .
Native build log Download: Source · Source + data ZIP · SVG · PDF · PNG
Copy link VIZ-09-005 GMT: violin GMT reads selected columns through its native plotting modules; column expressions are performed by the shown local awk pipeline. The shared tables determine the statistics.
Back to comparison gallery Drawing commands for group in 1 2 3 4 ; do
gmt plot "data/violin- $group .tsv" -L -G#e8f1fa -W.7p,#00549f
done
Actual GMT output VIZ-09-005 · native vector output GMT · exit 0
Command or choice Meaning plot -LNative drawing method used here. violin-1.tsvShared numeric input; column definitions are in data/recipes.json. Fixed rangesSame axis domain and statistical definition in all five implementations.
Complete standalone program #!/usr/bin/env bash
set -euo pipefail
export GMT_USERDIR = " $PWD /.gmt"
mkdir -p " $GMT_USERDIR "
gmt begin VIZ-09-005 pdf
gmt set \
FONT_ANNOT_PRIMARY 7p \
FONT_LABEL 8p \
FONT_TITLE 8p \
MAP_TITLE_OFFSET 4p \
MAP_FRAME_TYPE plain \
MAP_TICK_LENGTH_PRIMARY 3p
gmt plot -R0/420/0/280 -JX420p/280p -Gwhite -W0p <<'CANVAS'
0 0
420 0
420 280
0 280
CANVAS
gmt text -F+f8p+jTR <<'ID'
414 272 VIZ-09-005
ID
gmt text -F+f7p+jML <<'LEGEND'
55 246 Gaussian KDE: bandwidth 3 years; common width scale
LEGEND
gmt basemap -R0.5/4.5/0/75 -JX345p/175p -X55p -Y45p \
-Bpxcdata/classes-x.txt+l"Passenger class / crew" -Bpya15+l"Age (years)" -BWS
# BEGIN EXAMPLE
for group in 1 2 3 4 ; do
gmt plot "data/violin- $group .tsv" -L -G#e8f1fa -W.7p,#00549f
done
# END EXAMPLE
gmt end
Native build log
Download: Source · Source + data ZIP · SVG · PDF · PNG
Copy link VIZ-10-001 PGFplots / TikZ: heatmap TikZ fills each cell using a continuous light-to-blue scale; empty cells get a separate grey fill.
Back to comparison gallery Drawing commands \pgfplotstableread { data/cells.tsv} \Data
\begin { axis} [
width=345bp, height=175bp,
scale only axis, at={ (55bp,45bp)} ,
anchor=south west, xmin=0,
xmax=75, ymin=0.5,
ymax=4.5, xtick={ 0,15,30,45,60,75} ,
ytick={ 1,2,3,4} , xlabel={ Age band (years)} ,
ylabel={ Group} , axis lines=left,
tick align=outside, enlargelimits=false,
clip=false, yticklabels={ Crew,3rd,2nd,1st}
]
\pgfplotsextra {
\foreach \i in { 0,...,99}{
\pgfplotstablegetelem { \i }{ [index]0} \of\Data\let\va\pgfplotsretval
\pgfplotstablegetelem { \i }{ [index]1} \of\Data\let\vb\pgfplotsretval
\pgfplotstablegetelem { \i }{ [index]2} \of\Data\let\vc\pgfplotsretval
\pgfplotstablegetelem { \i }{ [index]3} \of\Data\let\vd\pgfplotsretval
\pgfplotstablegetelem { \i }{ [index]4} \of\Data\let\ve\pgfplotsretval
\pgfplotstablegetelem { \i }{ [index]5} \of\Data\let\vf\pgfplotsretval
\pgfmathsetmacro { \xl }{ \va -1.5}
\pgfmathsetmacro { \xr }{ \va +1.5}
\pgfmathsetmacro { \yl }{ \vb -.5}
\pgfmathsetmacro { \yr }{ \vb +.5}
\ifdim\vc pt<0pt
\def\shade { Missing}
\else
\edef\shade { Blue!\vc !Wash}
\fi
\path [fill=\shade] (axis cs:\xl ,\yl ) rectangle (axis cs:\xr ,\yr );
}
}
\end { axis}
Actual PGFplots / TikZ output VIZ-10-001 · native vector output PGFplots / TikZ · exit 0
Command or choice Meaning axis cs + colour mixingNative drawing method used here. cells.tsvShared numeric input; column definitions are in data/recipes.json. Fixed rangesSame axis domain and statistical definition in all five implementations.
Complete standalone program \documentclass [tikz,border=0pt] { standalone}
\usepackage { pgfplots,pgfplotstable}
\usepgfplotslibrary { statistics,groupplots}
\pgfplotsset { compat=1.18}
\definecolor { Blue}{ HTML}{ 00549F}
\definecolor { Teal}{ HTML}{ 00B1B7}
\definecolor { Orange}{ HTML}{ F6A800}
\definecolor { Wash}{ HTML}{ E8F1FA}
\definecolor { Missing}{ HTML}{ ECECED}
\begin { document}
\begin { tikzpicture} [font=\fontsize { 8}{ 10} \selectfont ]
\path [use as bounding box,fill=white] (0,0) rectangle (420bp,280bp);
\node [anchor=north east] at (414bp,272bp) { VIZ-10-001} ;
\node [anchor=west,font=\fontsize{7}{9}\selectfont] at
(55bp,246bp) { Survived: 0\% (light) to 100\% (blue); grey: n=0} ;
\path [fill=Blue!2.5!Wash] (55bp,231bp) rectangle (61bp,237bp);
\path [fill=Blue!7.5!Wash] (61bp,231bp) rectangle (67bp,237bp);
\path [fill=Blue!12.5!Wash] (67bp,231bp) rectangle (73bp,237bp);
\path [fill=Blue!17.5!Wash] (73bp,231bp) rectangle (79bp,237bp);
\path [fill=Blue!22.5!Wash] (79bp,231bp) rectangle (85bp,237bp);
\path [fill=Blue!27.500000000000004!Wash] (85bp,231bp) rectangle (91bp,237bp);
\path [fill=Blue!32.5!Wash] (91bp,231bp) rectangle (97bp,237bp);
\path [fill=Blue!37.5!Wash] (97bp,231bp) rectangle (103bp,237bp);
\path [fill=Blue!42.5!Wash] (103bp,231bp) rectangle (109bp,237bp);
\path [fill=Blue!47.5!Wash] (109bp,231bp) rectangle (115bp,237bp);
\path [fill=Blue!52.5!Wash] (115bp,231bp) rectangle (121bp,237bp);
\path [fill=Blue!57.49999999999999!Wash] (121bp,231bp) rectangle (127bp,237bp);
\path [fill=Blue!62.5!Wash] (127bp,231bp) rectangle (133bp,237bp);
\path [fill=Blue!67.5!Wash] (133bp,231bp) rectangle (139bp,237bp);
\path [fill=Blue!72.5!Wash] (139bp,231bp) rectangle (145bp,237bp);
\path [fill=Blue!77.5!Wash] (145bp,231bp) rectangle (151bp,237bp);
\path [fill=Blue!82.5!Wash] (151bp,231bp) rectangle (157bp,237bp);
\path [fill=Blue!87.5!Wash] (157bp,231bp) rectangle (163bp,237bp);
\path [fill=Blue!92.5!Wash] (163bp,231bp) rectangle (169bp,237bp);
\path [fill=Blue!97.5!Wash] (169bp,231bp) rectangle (175bp,237bp);
\node [font=\tiny,anchor=north] at (55bp,230bp) { 0} ;
\node [font=\tiny,anchor=north] at (115bp,230bp) { 50} ;
\node [font=\tiny,anchor=north] at (175bp,230bp) { 100\% } ;
% BEGIN EXAMPLE
\pgfplotstableread { data/cells.tsv} \Data
\begin { axis} [
width=345bp, height=175bp,
scale only axis, at={ (55bp,45bp)} ,
anchor=south west, xmin=0,
xmax=75, ymin=0.5,
ymax=4.5, xtick={ 0,15,30,45,60,75} ,
ytick={ 1,2,3,4} , xlabel={ Age band (years)} ,
ylabel={ Group} , axis lines=left,
tick align=outside, enlargelimits=false,
clip=false, yticklabels={ Crew,3rd,2nd,1st}
]
\pgfplotsextra {
\foreach \i in { 0,...,99}{
\pgfplotstablegetelem { \i }{ [index]0} \of\Data\let\va\pgfplotsretval
\pgfplotstablegetelem { \i }{ [index]1} \of\Data\let\vb\pgfplotsretval
\pgfplotstablegetelem { \i }{ [index]2} \of\Data\let\vc\pgfplotsretval
\pgfplotstablegetelem { \i }{ [index]3} \of\Data\let\vd\pgfplotsretval
\pgfplotstablegetelem { \i }{ [index]4} \of\Data\let\ve\pgfplotsretval
\pgfplotstablegetelem { \i }{ [index]5} \of\Data\let\vf\pgfplotsretval
\pgfmathsetmacro { \xl }{ \va -1.5}
\pgfmathsetmacro { \xr }{ \va +1.5}
\pgfmathsetmacro { \yl }{ \vb -.5}
\pgfmathsetmacro { \yr }{ \vb +.5}
\ifdim\vc pt<0pt
\def\shade { Missing}
\else
\edef\shade { Blue!\vc !Wash}
\fi
\path [fill=\shade] (axis cs:\xl ,\yl ) rectangle (axis cs:\xr ,\yr );
}
}
\end { axis}
% END EXAMPLE
\end { tikzpicture}
\end { document}
Native build log Download: Source · Source + data ZIP · SVG · PDF · PNG
Copy link VIZ-10-002 gnuplot: heatmap Explicit cell limits prevent interpolation between bins; a grey background preserves empty cells.
Back to comparison gallery Drawing commands set object 1 rect from 0 , .5 to 75 , 4.5 behind fc rgb "#ececed" fs solid 1.0 noborder
plot "data/cells.tsv" using 1 : 2 : ( $ 1 - 1.5 ) : ( $ 1 + 1.5 ) : ( $ 2 - .5 ) : ( $ 2 + .5 ) : ( $ 3 < 0 ? 1 \
/ 0 : $ 3 ) \
with boxxyerrorbars lc palette
Actual gnuplot output VIZ-10-002 · native vector output gnuplot · exit 0
Command or choice Meaning boxxyerrorbars + paletteNative drawing method used here. cells.tsvShared numeric input; column definitions are in data/recipes.json. Fixed rangesSame axis domain and statistical definition in all five implementations.
Complete standalone program set terminal pdfcairo size 5.833333 in , 3.888889 in font "Helvetica,8"
set output "VIZ-10-002.pdf"
set lmargin at screen 0.13095238095238096
set rmargin at screen 0.9523809523809523
set bmargin at screen 0.16071428571428573
set tmargin at screen 0.7857142857142857
set xrange [ 0 : 75 ]
set yrange [ 0.5 : 4.5 ]
set xtics ( "0" 0 , "15" 15 , "30" 30 , "45" 45 , "60" 60 , "75" 75 )
set ytics ( "Crew" 1 , "3rd" 2 , "2nd" 3 , "1st" 4 )
set xlabel "Age band (years)"
set ylabel "Group"
set border 3
set tics out nomirror
unset key
set style fill solid 1.0 noborder
set label 1 "VIZ-10-002" at screen .985 , .97 right
set label 2 "Survived: 0% (light) to 100% (blue); grey: n=0" at screen .13 , .88 left \
font ",7"
set palette defined ( 0 "#e8f1fa" , 100 "#00549f" )
set cbrange [ 0 : 100 ]
unset colorbox
set object 20 rect from screen 0.13095238095238096 , 0.825 to screen \
0.14523809523809525 , 0.8464285714285714 front fc rgb "#e2edf8" fs solid 1 noborder
set object 21 rect from screen 0.14523809523809525 , 0.825 to screen \
0.1595238095238095 , 0.8464285714285714 front fc rgb "#d7e5f3" fs solid 1 noborder
set object 22 rect from screen 0.1595238095238095 , 0.825 to screen \
0.1738095238095238 , 0.8464285714285714 front fc rgb "#cbddef" fs solid 1 noborder
set object 23 rect from screen 0.1738095238095238 , 0.825 to screen \
0.1880952380952381 , 0.8464285714285714 front fc rgb "#bfd6ea" fs solid 1 noborder
set object 24 rect from screen 0.1880952380952381 , 0.825 to screen \
0.20238095238095238 , 0.8464285714285714 front fc rgb "#b4cee6" fs solid 1 noborder
set object 25 rect from screen 0.20238095238095238 , 0.825 to screen \
0.21666666666666667 , 0.8464285714285714 front fc rgb "#a8c6e1" fs solid 1 noborder
set object 26 rect from screen 0.21666666666666667 , 0.825 to screen \
0.23095238095238096 , 0.8464285714285714 front fc rgb "#9dbedc" fs solid 1 noborder
set object 27 rect from screen 0.23095238095238096 , 0.825 to screen \
0.24523809523809523 , 0.8464285714285714 front fc rgb "#91b6d8" fs solid 1 noborder
set object 28 rect from screen 0.24523809523809523 , 0.825 to screen \
0.25952380952380955 , 0.8464285714285714 front fc rgb "#85aed3" fs solid 1 noborder
set object 29 rect from screen 0.25952380952380955 , 0.825 to screen \
0.27380952380952384 , 0.8464285714285714 front fc rgb "#7aa6cf" fs solid 1 noborder
set object 30 rect from screen 0.27380952380952384 , 0.825 to screen \
0.28809523809523807 , 0.8464285714285714 front fc rgb "#6e9fca" fs solid 1 noborder
set object 31 rect from screen 0.28809523809523807 , 0.825 to screen \
0.30238095238095236 , 0.8464285714285714 front fc rgb "#6397c6" fs solid 1 noborder
set object 32 rect from screen 0.30238095238095236 , 0.825 to screen \
0.31666666666666665 , 0.8464285714285714 front fc rgb "#578fc1" fs solid 1 noborder
set object 33 rect from screen 0.31666666666666665 , 0.825 to screen \
0.33095238095238094 , 0.8464285714285714 front fc rgb "#4b87bd" fs solid 1 noborder
set object 34 rect from screen 0.33095238095238094 , 0.825 to screen \
0.34523809523809523 , 0.8464285714285714 front fc rgb "#407fb8" fs solid 1 noborder
set object 35 rect from screen 0.34523809523809523 , 0.825 to screen \
0.3595238095238095 , 0.8464285714285714 front fc rgb "#3477b3" fs solid 1 noborder
set object 36 rect from screen 0.3595238095238095 , 0.825 to screen \
0.3738095238095238 , 0.8464285714285714 front fc rgb "#296faf" fs solid 1 noborder
set object 37 rect from screen 0.3738095238095238 , 0.825 to screen \
0.3880952380952381 , 0.8464285714285714 front fc rgb "#1d68aa" fs solid 1 noborder
set object 38 rect from screen 0.3880952380952381 , 0.825 to screen \
0.4023809523809524 , 0.8464285714285714 front fc rgb "#1160a6" fs solid 1 noborder
set object 39 rect from screen 0.4023809523809524 , 0.825 to screen \
0.4166666666666667 , 0.8464285714285714 front fc rgb "#0658a1" fs solid 1 noborder
set label 105 "0" at screen 0.13095238095238096 , 0.8035714285714286 center font ",6" \
front
set label 165 "50" at screen 0.27380952380952384 , 0.8035714285714286 center font ",6" \
front
set label 225 "100%" at screen 0.4166666666666667 , 0.8035714285714286 center font \
",6" front
# BEGIN EXAMPLE
set object 1 rect from 0 , .5 to 75 , 4.5 behind fc rgb "#ececed" fs solid 1.0 noborder
plot "data/cells.tsv" using 1 : 2 : ( $ 1 - 1.5 ) : ( $ 1 + 1.5 ) : ( $ 2 - .5 ) : ( $ 2 + .5 ) : ( $ 3 < 0 ? 1 \
/ 0 : $ 3 ) \
with boxxyerrorbars lc palette
# END EXAMPLE
unset output
Native build log
Download: Source · Source + data ZIP · SVG · PDF · PNG
Copy link VIZ-10-003 Asymptote: heatmap Asymptote reads the shared numeric table into typed arrays and draws this chart with paths, pens and physical-size symbols.
Back to comparison gallery Drawing commands real [][] d = input ( "data/cells.tsv" ). line ();
for ( int i = 0 ; i < d . length ; ++ i ) {
real [] v = d [ i ];
pen shade = v [ 3 ] == 0 ? Missing : ( 1 - v [ 2 ] / 100 ) * Wash + ( v [ 2 ] / 100 ) * Blue ;
rect ( v [ 0 ] - 1.5 , v [ 1 ] - .5 , v [ 0 ] + 1.5 , v [ 1 ] + .5 , shade );
}
Actual Asymptote output VIZ-10-003 · native vector output Asymptote · exit 0
Command or choice Meaning arrays + native pathsNative drawing method used here. cells.tsvShared numeric input; column definitions are in data/recipes.json. Fixed rangesSame axis domain and statistical definition in all five implementations.
Complete standalone program import graph ;
size ( 420 bp , 280 bp , IgnoreAspect );
defaultpen ( fontsize ( 8 ));
pen Blue = rgb ( 0 , 84 / 255 , 159 / 255 ), Teal = rgb ( 0 , 177 / 255 , 183 / 255 );
pen Orange = rgb ( 246 / 255 , 168 / 255 , 0 ), Wash = rgb ( 232 / 255 , 241 / 255 , 250 / 255 );
pen Missing = rgb ( 236 / 255 , 236 / 255 , 237 / 255 );
pair P ( real x , real y ) {
return ( 55 + 345 * ( x - ( 0 )) / ( 75 ), 45 + 175 * ( y - ( 0.5 )) / ( 4.0 ));
}
void rect ( real x , real y , real xx , real yy , pen p ) {
fill ( P ( x , y ) -- P ( xx , y ) -- P ( xx , yy ) -- P ( x , yy ) -- cycle , p );
}
fill ( box (( 0 , 0 ), ( 420 , 280 )), white );
label ( "VIZ-10-003" , ( 414 , 272 ), SW , fontsize ( 8 ));
label ( "Survived: 0\% (light) to 100\% (blue); grey: n=0" , ( 55 , 246 ), E , fontsize ( 7 ));
fill ( box (( 55 , 231 ), ( 61 , 237 )), 0.975 * Wash + 0.025 * Blue );
fill ( box (( 61 , 231 ), ( 67 , 237 )), 0.925 * Wash + 0.075 * Blue );
fill ( box (( 67 , 231 ), ( 73 , 237 )), 0.875 * Wash + 0.125 * Blue );
fill ( box (( 73 , 231 ), ( 79 , 237 )), 0.825 * Wash + 0.175 * Blue );
fill ( box (( 79 , 231 ), ( 85 , 237 )), 0.775 * Wash + 0.225 * Blue );
fill ( box (( 85 , 231 ), ( 91 , 237 )), 0.725 * Wash + 0.275 * Blue );
fill ( box (( 91 , 231 ), ( 97 , 237 )), 0.675 * Wash + 0.325 * Blue );
fill ( box (( 97 , 231 ), ( 103 , 237 )), 0.625 * Wash + 0.375 * Blue );
fill ( box (( 103 , 231 ), ( 109 , 237 )), 0.575 * Wash + 0.425 * Blue );
fill ( box (( 109 , 231 ), ( 115 , 237 )), 0.525 * Wash + 0.475 * Blue );
fill ( box (( 115 , 231 ), ( 121 , 237 )), 0.475 * Wash + 0.525 * Blue );
fill ( box (( 121 , 231 ), ( 127 , 237 )), 0.42500000000000004 * Wash + 0.575 * Blue );
fill ( box (( 127 , 231 ), ( 133 , 237 )), 0.375 * Wash + 0.625 * Blue );
fill ( box (( 133 , 231 ), ( 139 , 237 )), 0.32499999999999996 * Wash + 0.675 * Blue );
fill ( box (( 139 , 231 ), ( 145 , 237 )), 0.275 * Wash + 0.725 * Blue );
fill ( box (( 145 , 231 ), ( 151 , 237 )), 0.22499999999999998 * Wash + 0.775 * Blue );
fill ( box (( 151 , 231 ), ( 157 , 237 )), 0.17500000000000004 * Wash + 0.825 * Blue );
fill ( box (( 157 , 231 ), ( 163 , 237 )), 0.125 * Wash + 0.875 * Blue );
fill ( box (( 163 , 231 ), ( 169 , 237 )), 0.07499999999999996 * Wash + 0.925 * Blue );
fill ( box (( 169 , 231 ), ( 175 , 237 )), 0.025000000000000022 * Wash + 0.975 * Blue );
label ( "0" , ( 55 , 230 ), S , fontsize ( 6 ));
label ( "50" , ( 115 , 230 ), S , fontsize ( 6 ));
label ( "100\%" , ( 175 , 230 ), S , fontsize ( 6 ));
draw ( P ( 0 , 4.5 ) -- P ( 0 , 0.5 ) -- P ( 75 , 0.5 ), gray ( .4 ));
label ( "0" , P ( 0 , 0.5 ), S , fontsize ( 7 ));
label ( "15" , P ( 15 , 0.5 ), S , fontsize ( 7 ));
label ( "30" , P ( 30 , 0.5 ), S , fontsize ( 7 ));
label ( "45" , P ( 45 , 0.5 ), S , fontsize ( 7 ));
label ( "60" , P ( 60 , 0.5 ), S , fontsize ( 7 ));
label ( "75" , P ( 75 , 0.5 ), S , fontsize ( 7 ));
label ( "Crew" , P ( 0 , 1 ), W , fontsize ( 7 ));
label ( "3rd" , P ( 0 , 2 ), W , fontsize ( 7 ));
label ( "2nd" , P ( 0 , 3 ), W , fontsize ( 7 ));
label ( "1st" , P ( 0 , 4 ), W , fontsize ( 7 ));
label ( "Age band (years)" , ( 227.5 , 13 ), fontsize ( 8 ));
label ( rotate ( 90 ) * Label ( "Group" ), ( 13 , 132 ), fontsize ( 8 ));
// BEGIN EXAMPLE
real [][] d = input ( "data/cells.tsv" ). line ();
for ( int i = 0 ; i < d . length ; ++ i ) {
real [] v = d [ i ];
pen shade = v [ 3 ] == 0 ? Missing : ( 1 - v [ 2 ] / 100 ) * Wash + ( v [ 2 ] / 100 ) * Blue ;
rect ( v [ 0 ] - 1.5 , v [ 1 ] - .5 , v [ 0 ] + 1.5 , v [ 1 ] + .5 , shade );
}
// END EXAMPLE
shipout ( "VIZ-10-003" , bbox ( 0 ));
Native build log
Download: Source · Source + data ZIP · SVG · PDF · PNG
Copy link VIZ-10-004 MetaPost: heatmap MetaPost reads numeric fields with gdata and scantokens, then constructs the chart with paths, TeX labels and colour interpolation.
Back to comparison gallery Drawing commands numeric n , v [][];
n := 0 ;
gdata ( "data/cells.tsv" , c ,
n := n + 1 ;
for j = 1 upto 6 :
v [ n ][ j ] := scantokens c [ j ];
endfor
);
for k = 1 upto n :
rect ( v [ k ][ 1 ] - 1.5 , v [ k ][ 2 ] - .5 , v [ k ][ 1 ] + 1.5 , v [ k ][ 2 ] + .5 ,
if v [ k ][ 4 ] = 0 :
Missing
else :
( v [ k ][ 3 ] / 100 )[ Wash , Blue ]
fi
);
endfor
Actual MetaPost output VIZ-10-004 · native vector output MetaPost · exit 0
Command or choice Meaning gdata + pathsNative drawing method used here. cells.tsvShared numeric input; column definitions are in data/recipes.json. Fixed rangesSame axis domain and statistical definition in all five implementations.
Complete standalone program input graph ;
prologues := 3 ;
outputformat := "svg" ;
outputtemplate := "VIZ-10-004.svg" ;
color Blue , Teal , Orange , Wash , Missing ;
Blue := ( 0 , 84 / 255 , 159 / 255 );
Teal := ( 0 , 177 / 255 , 183 / 255 );
Orange := ( 246 / 255 , 168 / 255 , 0 );
Wash := ( 232 / 255 , 241 / 255 , 250 / 255 );
Missing := ( 236 / 255 , 236 / 255 , 237 / 255 );
vardef P ( expr x , y ) =
( 55 + 345 * ( x - ( 0 )) / ( 75 ), 45 + 175 * ( y - ( 0.5 )) / ( 4.0 ))
enddef ;
def rect ( expr x , y , xx , yy , col ) =
fill P ( x , y ) -- P ( xx , y ) -- P ( xx , yy ) -- P ( x , yy ) -- cycle withcolor col ;
enddef ;
beginfig ( 1 );
fill unitsquare xscaled 420 yscaled 280 withcolor white ;
label .llft ( "VIZ-10-004" infont "cmr8" , ( 414 , 272 ));
label .rt ( btex Survived: 0\% (light) to 100\% (blue); grey: n=0 etex scaled .65 , ( 55 ,
246 ));
fill unitsquare xscaled 6 yscaled 6 shifted ( 55 , 231 ) withcolor 0.025 [ Wash , Blue ];
fill unitsquare xscaled 6 yscaled 6 shifted ( 61 , 231 ) withcolor 0.075 [ Wash , Blue ];
fill unitsquare xscaled 6 yscaled 6 shifted ( 67 , 231 ) withcolor 0.125 [ Wash , Blue ];
fill unitsquare xscaled 6 yscaled 6 shifted ( 73 , 231 ) withcolor 0.175 [ Wash , Blue ];
fill unitsquare xscaled 6 yscaled 6 shifted ( 79 , 231 ) withcolor 0.225 [ Wash , Blue ];
fill unitsquare xscaled 6 yscaled 6 shifted ( 85 , 231 ) withcolor 0.275 [ Wash , Blue ];
fill unitsquare xscaled 6 yscaled 6 shifted ( 91 , 231 ) withcolor 0.325 [ Wash , Blue ];
fill unitsquare xscaled 6 yscaled 6 shifted ( 97 , 231 ) withcolor 0.375 [ Wash , Blue ];
fill unitsquare xscaled 6 yscaled 6 shifted ( 103 , 231 ) withcolor 0.425 [ Wash , Blue ];
fill unitsquare xscaled 6 yscaled 6 shifted ( 109 , 231 ) withcolor 0.475 [ Wash , Blue ];
fill unitsquare xscaled 6 yscaled 6 shifted ( 115 , 231 ) withcolor 0.525 [ Wash , Blue ];
fill unitsquare xscaled 6 yscaled 6 shifted ( 121 , 231 ) withcolor 0.575 [ Wash , Blue ];
fill unitsquare xscaled 6 yscaled 6 shifted ( 127 , 231 ) withcolor 0.625 [ Wash , Blue ];
fill unitsquare xscaled 6 yscaled 6 shifted ( 133 , 231 ) withcolor 0.675 [ Wash , Blue ];
fill unitsquare xscaled 6 yscaled 6 shifted ( 139 , 231 ) withcolor 0.725 [ Wash , Blue ];
fill unitsquare xscaled 6 yscaled 6 shifted ( 145 , 231 ) withcolor 0.775 [ Wash , Blue ];
fill unitsquare xscaled 6 yscaled 6 shifted ( 151 , 231 ) withcolor 0.825 [ Wash , Blue ];
fill unitsquare xscaled 6 yscaled 6 shifted ( 157 , 231 ) withcolor 0.875 [ Wash , Blue ];
fill unitsquare xscaled 6 yscaled 6 shifted ( 163 , 231 ) withcolor 0.925 [ Wash , Blue ];
fill unitsquare xscaled 6 yscaled 6 shifted ( 169 , 231 ) withcolor 0.975 [ Wash , Blue ];
label .bot ( btex 0 etex scaled .6 , ( 55 , 230 ));
label .bot ( btex 50 etex scaled .6 , ( 115 , 230 ));
label .bot ( btex 100\% etex scaled .6 , ( 175 , 230 ));
draw P ( 0 , 4.5 ) -- P ( 0 , 0.5 ) -- P ( 75 , 0.5 ) withcolor .4 white ;
label .bot ( btex 0 etex scaled .7 , P ( 0 , 0.5 ));
label .bot ( btex 15 etex scaled .7 , P ( 15 , 0.5 ));
label .bot ( btex 30 etex scaled .7 , P ( 30 , 0.5 ));
label .bot ( btex 45 etex scaled .7 , P ( 45 , 0.5 ));
label .bot ( btex 60 etex scaled .7 , P ( 60 , 0.5 ));
label .bot ( btex 75 etex scaled .7 , P ( 75 , 0.5 ));
label .lft ( btex Crew etex scaled .7 , P ( 0 , 1 ));
label .lft ( btex 3rd etex scaled .7 , P ( 0 , 2 ));
label .lft ( btex 2nd etex scaled .7 , P ( 0 , 3 ));
label .lft ( btex 1st etex scaled .7 , P ( 0 , 4 ));
label ( btex Age band (years) etex scaled .8 , ( 227.5 , 13 ));
label ( btex Group etex scaled .8 rotated 90 , ( 13 , 132 ));
% BEGIN EXAMPLE
numeric n , v [][];
n := 0 ;
gdata ( "data/cells.tsv" , c ,
n := n + 1 ;
for j = 1 upto 6 :
v [ n ][ j ] := scantokens c [ j ];
endfor
);
for k = 1 upto n :
rect ( v [ k ][ 1 ] - 1.5 , v [ k ][ 2 ] - .5 , v [ k ][ 1 ] + 1.5 , v [ k ][ 2 ] + .5 ,
if v [ k ][ 4 ] = 0 :
Missing
else :
( v [ k ][ 3 ] / 100 )[ Wash , Blue ]
fi
);
endfor
% END EXAMPLE
setbounds currentpicture to unitsquare xscaled 420 yscaled 280 ;
endfig ;
end .
Native build log Download: Source · Source + data ZIP · SVG · PDF · PNG
Copy link VIZ-10-005 GMT: heatmap GMT reads selected columns through its native plotting modules; column expressions are performed by the shown local awk pipeline. The shared tables determine the statistics.
Back to comparison gallery Drawing commands plot data/cells.tsv -i0,1 -Sr13.8p/43.75p -G#ececed
awk '$4>0 {print $1,$2,$3}' data/cells.tsv |
gmt plot -Sr13.8p/43.75p -Cdata/survival.cpt
Actual GMT output VIZ-10-005 · native vector output GMT · exit 0
Command or choice Meaning plot -Sr + CPTNative drawing method used here. cells.tsvShared numeric input; column definitions are in data/recipes.json. Fixed rangesSame axis domain and statistical definition in all five implementations.
Complete standalone program #!/usr/bin/env bash
set -euo pipefail
export GMT_USERDIR = " $PWD /.gmt"
mkdir -p " $GMT_USERDIR "
gmt begin VIZ-10-005 pdf
gmt set \
FONT_ANNOT_PRIMARY 7p \
FONT_LABEL 8p \
FONT_TITLE 8p \
MAP_TITLE_OFFSET 4p \
MAP_FRAME_TYPE plain \
MAP_TICK_LENGTH_PRIMARY 3p
gmt plot -R0/420/0/280 -JX420p/280p -Gwhite -W0p <<'CANVAS'
0 0
420 0
420 280
0 280
CANVAS
gmt text -F+f8p+jTR <<'ID'
414 272 VIZ-10-005
ID
gmt text -F+f7p+jML <<'LEGEND'
55 246 Survived: 0% (light) to 100% (blue); grey: n=0
LEGEND
echo "58 234" | gmt plot -Sr6p/6p -G#e2edf8
echo "64 234" | gmt plot -Sr6p/6p -G#d7e5f3
echo "70 234" | gmt plot -Sr6p/6p -G#cbddef
echo "76 234" | gmt plot -Sr6p/6p -G#bfd6ea
echo "82 234" | gmt plot -Sr6p/6p -G#b4cee6
echo "88 234" | gmt plot -Sr6p/6p -G#a8c6e1
echo "94 234" | gmt plot -Sr6p/6p -G#9dbedc
echo "100 234" | gmt plot -Sr6p/6p -G#91b6d8
echo "106 234" | gmt plot -Sr6p/6p -G#85aed3
echo "112 234" | gmt plot -Sr6p/6p -G#7aa6cf
echo "118 234" | gmt plot -Sr6p/6p -G#6e9fca
echo "124 234" | gmt plot -Sr6p/6p -G#6397c6
echo "130 234" | gmt plot -Sr6p/6p -G#578fc1
echo "136 234" | gmt plot -Sr6p/6p -G#4b87bd
echo "142 234" | gmt plot -Sr6p/6p -G#407fb8
echo "148 234" | gmt plot -Sr6p/6p -G#3477b3
echo "154 234" | gmt plot -Sr6p/6p -G#296faf
echo "160 234" | gmt plot -Sr6p/6p -G#1d68aa
echo "166 234" | gmt plot -Sr6p/6p -G#1160a6
echo "172 234" | gmt plot -Sr6p/6p -G#0658a1
echo "55 229 0" | gmt text -F+f6p+jTC
echo "115 229 50" | gmt text -F+f6p+jTC
echo "175 229 100%" | gmt text -F+f6p+jTC
gmt basemap -R0/75/0.5/4.5 -JX345p/175p -X55p -Y45p -Bpxa15+l"Age band (years)" \
-Bpycdata/classes-y.txt+l"Group" -BWS
# BEGIN EXAMPLE
gmt plot data/cells.tsv -i0,1 -Sr13.8p/43.75p -G#ececed
awk '$4>0 {print $1,$2,$3}' data/cells.tsv |
gmt plot -Sr13.8p/43.75p -Cdata/survival.cpt
# END EXAMPLE
gmt end
Native build log
Download: Source · Source + data ZIP · SVG · PDF · PNG
Copy link VIZ-11-001 PGFplots / TikZ: bubble Read shared diameters, halve them for TikZ radii, and mix colour from survival percentage.
Back to comparison gallery Drawing commands \pgfplotstableread { data/cells.tsv} \Data
\begin { axis} [
width=345bp, height=175bp,
scale only axis, at={ (55bp,45bp)} ,
anchor=south west, xmin=0,
xmax=75, ymin=0.5,
ymax=4.5, xtick={ 0,15,30,45,60,75} ,
ytick={ 1,2,3,4} , xlabel={ Age band (years)} ,
ylabel={ Group} , axis lines=left,
tick align=outside, enlargelimits=false,
clip=false, yticklabels={ Crew,3rd,2nd,1st}
]
\pgfplotsextra {
\foreach \i in { 0,...,99}{
\pgfplotstablegetelem { \i }{ [index]0} \of\Data\let\va\pgfplotsretval
\pgfplotstablegetelem { \i }{ [index]1} \of\Data\let\vb\pgfplotsretval
\pgfplotstablegetelem { \i }{ [index]2} \of\Data\let\vc\pgfplotsretval
\pgfplotstablegetelem { \i }{ [index]3} \of\Data\let\vd\pgfplotsretval
\pgfplotstablegetelem { \i }{ [index]4} \of\Data\let\ve\pgfplotsretval
\pgfplotstablegetelem { \i }{ [index]5} \of\Data\let\vf\pgfplotsretval
\ifdim\vd pt>0pt
\pgfmathsetmacro { \rr }{ \vf /2}
\fill [Blue!\vc!Wash] (axis cs:\va ,\vb ) circle[radius=\rr bp];
\fi
}
}
\end { axis}
Actual PGFplots / TikZ output VIZ-11-001 · native vector output PGFplots / TikZ · exit 0
Command or choice Meaning circle radius in bpNative drawing method used here. cells.tsvShared numeric input; column definitions are in data/recipes.json. Fixed rangesSame axis domain and statistical definition in all five implementations.
Complete standalone program \documentclass [tikz,border=0pt] { standalone}
\usepackage { pgfplots,pgfplotstable}
\usepgfplotslibrary { statistics,groupplots}
\pgfplotsset { compat=1.18}
\definecolor { Blue}{ HTML}{ 00549F}
\definecolor { Teal}{ HTML}{ 00B1B7}
\definecolor { Orange}{ HTML}{ F6A800}
\definecolor { Wash}{ HTML}{ E8F1FA}
\definecolor { Missing}{ HTML}{ ECECED}
\begin { document}
\begin { tikzpicture} [font=\fontsize { 8}{ 10} \selectfont ]
\path [use as bounding box,fill=white] (0,0) rectangle (420bp,280bp);
\node [anchor=north east] at (414bp,272bp) { VIZ-11-001} ;
\node [anchor=west,font=\fontsize{7}{9}\selectfont] at
(55bp,246bp) { Colour: survival 0-100\% ; circle area: n} ;
\path [fill=Blue!2.5!Wash] (55bp,231bp) rectangle (61bp,237bp);
\path [fill=Blue!7.5!Wash] (61bp,231bp) rectangle (67bp,237bp);
\path [fill=Blue!12.5!Wash] (67bp,231bp) rectangle (73bp,237bp);
\path [fill=Blue!17.5!Wash] (73bp,231bp) rectangle (79bp,237bp);
\path [fill=Blue!22.5!Wash] (79bp,231bp) rectangle (85bp,237bp);
\path [fill=Blue!27.500000000000004!Wash] (85bp,231bp) rectangle (91bp,237bp);
\path [fill=Blue!32.5!Wash] (91bp,231bp) rectangle (97bp,237bp);
\path [fill=Blue!37.5!Wash] (97bp,231bp) rectangle (103bp,237bp);
\path [fill=Blue!42.5!Wash] (103bp,231bp) rectangle (109bp,237bp);
\path [fill=Blue!47.5!Wash] (109bp,231bp) rectangle (115bp,237bp);
\path [fill=Blue!52.5!Wash] (115bp,231bp) rectangle (121bp,237bp);
\path [fill=Blue!57.49999999999999!Wash] (121bp,231bp) rectangle (127bp,237bp);
\path [fill=Blue!62.5!Wash] (127bp,231bp) rectangle (133bp,237bp);
\path [fill=Blue!67.5!Wash] (133bp,231bp) rectangle (139bp,237bp);
\path [fill=Blue!72.5!Wash] (139bp,231bp) rectangle (145bp,237bp);
\path [fill=Blue!77.5!Wash] (145bp,231bp) rectangle (151bp,237bp);
\path [fill=Blue!82.5!Wash] (151bp,231bp) rectangle (157bp,237bp);
\path [fill=Blue!87.5!Wash] (157bp,231bp) rectangle (163bp,237bp);
\path [fill=Blue!92.5!Wash] (163bp,231bp) rectangle (169bp,237bp);
\path [fill=Blue!97.5!Wash] (169bp,231bp) rectangle (175bp,237bp);
\node [font=\tiny,anchor=north] at (55bp,230bp) { 0} ;
\node [font=\tiny,anchor=north] at (115bp,230bp) { 50} ;
\node [font=\tiny,anchor=north] at (175bp,230bp) { 100\% } ;
\fill [Blue] (280bp,235bp) circle[radius=1.987866419864727bp];
\node [font=\tiny,anchor=north] at (280bp,227bp) { n=10} ;
\fill [Blue] (325bp,235bp) circle[radius=4.445004445006667bp];
\node [font=\tiny,anchor=north] at (325bp,227bp) { n=50} ;
\fill [Blue] (370bp,235bp) circle[radius=6.286185570937121bp];
\node [font=\tiny,anchor=north] at (370bp,227bp) { n=100} ;
% BEGIN EXAMPLE
\pgfplotstableread { data/cells.tsv} \Data
\begin { axis} [
width=345bp, height=175bp,
scale only axis, at={ (55bp,45bp)} ,
anchor=south west, xmin=0,
xmax=75, ymin=0.5,
ymax=4.5, xtick={ 0,15,30,45,60,75} ,
ytick={ 1,2,3,4} , xlabel={ Age band (years)} ,
ylabel={ Group} , axis lines=left,
tick align=outside, enlargelimits=false,
clip=false, yticklabels={ Crew,3rd,2nd,1st}
]
\pgfplotsextra {
\foreach \i in { 0,...,99}{
\pgfplotstablegetelem { \i }{ [index]0} \of\Data\let\va\pgfplotsretval
\pgfplotstablegetelem { \i }{ [index]1} \of\Data\let\vb\pgfplotsretval
\pgfplotstablegetelem { \i }{ [index]2} \of\Data\let\vc\pgfplotsretval
\pgfplotstablegetelem { \i }{ [index]3} \of\Data\let\vd\pgfplotsretval
\pgfplotstablegetelem { \i }{ [index]4} \of\Data\let\ve\pgfplotsretval
\pgfplotstablegetelem { \i }{ [index]5} \of\Data\let\vf\pgfplotsretval
\ifdim\vd pt>0pt
\pgfmathsetmacro { \rr }{ \vf /2}
\fill [Blue!\vc!Wash] (axis cs:\va ,\vb ) circle[radius=\rr bp];
\fi
}
}
\end { axis}
% END EXAMPLE
\end { tikzpicture}
\end { document}
Native build log Download: Source · Source + data ZIP · SVG · PDF · PNG
Copy link VIZ-11-002 gnuplot: bubble Convert shared physical diameters to x-axis radii; circle area remains proportional to cell count.
Back to comparison gallery Drawing commands plot "data/cells.tsv" using 1 : 2 : ( $ 6 / 2 * 75 / 345 ) : ( $ 4 == 0 ? 1 / 0 : $ 3 ) \
with circles lc palette
Actual gnuplot output VIZ-11-002 · native vector output gnuplot · exit 0
Command or choice Meaning with circles + paletteNative drawing method used here. cells.tsvShared numeric input; column definitions are in data/recipes.json. Fixed rangesSame axis domain and statistical definition in all five implementations.
Complete standalone program set terminal pdfcairo size 5.833333 in , 3.888889 in font "Helvetica,8"
set output "VIZ-11-002.pdf"
set lmargin at screen 0.13095238095238096
set rmargin at screen 0.9523809523809523
set bmargin at screen 0.16071428571428573
set tmargin at screen 0.7857142857142857
set xrange [ 0 : 75 ]
set yrange [ 0.5 : 4.5 ]
set xtics ( "0" 0 , "15" 15 , "30" 30 , "45" 45 , "60" 60 , "75" 75 )
set ytics ( "Crew" 1 , "3rd" 2 , "2nd" 3 , "1st" 4 )
set xlabel "Age band (years)"
set ylabel "Group"
set border 3
set tics out nomirror
unset key
set style fill solid 1.0 noborder
set label 1 "VIZ-11-002" at screen .985 , .97 right
set label 2 "Colour: survival 0-100%; circle area: n" at screen .13 , .88 left font ",7"
set palette defined ( 0 "#e8f1fa" , 100 "#00549f" )
set cbrange [ 0 : 100 ]
unset colorbox
set object 20 rect from screen 0.13095238095238096 , 0.825 to screen \
0.14523809523809525 , 0.8464285714285714 front fc rgb "#e2edf8" fs solid 1 noborder
set object 21 rect from screen 0.14523809523809525 , 0.825 to screen \
0.1595238095238095 , 0.8464285714285714 front fc rgb "#d7e5f3" fs solid 1 noborder
set object 22 rect from screen 0.1595238095238095 , 0.825 to screen \
0.1738095238095238 , 0.8464285714285714 front fc rgb "#cbddef" fs solid 1 noborder
set object 23 rect from screen 0.1738095238095238 , 0.825 to screen \
0.1880952380952381 , 0.8464285714285714 front fc rgb "#bfd6ea" fs solid 1 noborder
set object 24 rect from screen 0.1880952380952381 , 0.825 to screen \
0.20238095238095238 , 0.8464285714285714 front fc rgb "#b4cee6" fs solid 1 noborder
set object 25 rect from screen 0.20238095238095238 , 0.825 to screen \
0.21666666666666667 , 0.8464285714285714 front fc rgb "#a8c6e1" fs solid 1 noborder
set object 26 rect from screen 0.21666666666666667 , 0.825 to screen \
0.23095238095238096 , 0.8464285714285714 front fc rgb "#9dbedc" fs solid 1 noborder
set object 27 rect from screen 0.23095238095238096 , 0.825 to screen \
0.24523809523809523 , 0.8464285714285714 front fc rgb "#91b6d8" fs solid 1 noborder
set object 28 rect from screen 0.24523809523809523 , 0.825 to screen \
0.25952380952380955 , 0.8464285714285714 front fc rgb "#85aed3" fs solid 1 noborder
set object 29 rect from screen 0.25952380952380955 , 0.825 to screen \
0.27380952380952384 , 0.8464285714285714 front fc rgb "#7aa6cf" fs solid 1 noborder
set object 30 rect from screen 0.27380952380952384 , 0.825 to screen \
0.28809523809523807 , 0.8464285714285714 front fc rgb "#6e9fca" fs solid 1 noborder
set object 31 rect from screen 0.28809523809523807 , 0.825 to screen \
0.30238095238095236 , 0.8464285714285714 front fc rgb "#6397c6" fs solid 1 noborder
set object 32 rect from screen 0.30238095238095236 , 0.825 to screen \
0.31666666666666665 , 0.8464285714285714 front fc rgb "#578fc1" fs solid 1 noborder
set object 33 rect from screen 0.31666666666666665 , 0.825 to screen \
0.33095238095238094 , 0.8464285714285714 front fc rgb "#4b87bd" fs solid 1 noborder
set object 34 rect from screen 0.33095238095238094 , 0.825 to screen \
0.34523809523809523 , 0.8464285714285714 front fc rgb "#407fb8" fs solid 1 noborder
set object 35 rect from screen 0.34523809523809523 , 0.825 to screen \
0.3595238095238095 , 0.8464285714285714 front fc rgb "#3477b3" fs solid 1 noborder
set object 36 rect from screen 0.3595238095238095 , 0.825 to screen \
0.3738095238095238 , 0.8464285714285714 front fc rgb "#296faf" fs solid 1 noborder
set object 37 rect from screen 0.3738095238095238 , 0.825 to screen \
0.3880952380952381 , 0.8464285714285714 front fc rgb "#1d68aa" fs solid 1 noborder
set object 38 rect from screen 0.3880952380952381 , 0.825 to screen \
0.4023809523809524 , 0.8464285714285714 front fc rgb "#1160a6" fs solid 1 noborder
set object 39 rect from screen 0.4023809523809524 , 0.825 to screen \
0.4166666666666667 , 0.8464285714285714 front fc rgb "#0658a1" fs solid 1 noborder
set label 105 "0" at screen 0.13095238095238096 , 0.8035714285714286 center font ",6" \
front
set label 165 "50" at screen 0.27380952380952384 , 0.8035714285714286 center font ",6" \
front
set label 225 "100%" at screen 0.4166666666666667 , 0.8035714285714286 center font \
",6" front
set object 90 circle at screen 0.6666666666666666 , 0.8392857142857143 size screen \
0.0047330152853922065 front fc rgb "#00549f" fs solid 1 noborder
set label 90 "n=10" at screen 0.6666666666666666 , 0.7928571428571428 center font ",6" \
front
set object 130 circle at screen 0.7738095238095238 , 0.8392857142857143 size screen \
0.010583343916682541 front fc rgb "#00549f" fs solid 1 noborder
set label 130 "n=50" at screen 0.7738095238095238 , 0.7928571428571428 center font \
",6" front
set object 180 circle at screen 0.8809523809523809 , 0.8392857142857143 size screen \
0.01496710850223124 front fc rgb "#00549f" fs solid 1 noborder
set label 180 "n=100" at screen 0.8809523809523809 , 0.7928571428571428 center font \
",6" front
# BEGIN EXAMPLE
plot "data/cells.tsv" using 1 : 2 : ( $ 6 / 2 * 75 / 345 ) : ( $ 4 == 0 ? 1 / 0 : $ 3 ) \
with circles lc palette
# END EXAMPLE
unset output
Native build log
Download: Source · Source + data ZIP · SVG · PDF · PNG
Copy link VIZ-11-003 Asymptote: bubble Asymptote reads the shared numeric table into typed arrays and draws this chart with paths, pens and physical-size symbols.
Back to comparison gallery Drawing commands real [][] d = input ( "data/cells.tsv" ). line ();
for ( int i = 0 ; i < d . length ; ++ i ) {
real [] v = d [ i ];
if ( v [ 3 ] > 0 ) fill ( circle ( P ( v [ 0 ], v [ 1 ]), v [ 5 ] / 2 ),
( 1 - v [ 2 ] / 100 ) * Wash + ( v [ 2 ] / 100 ) * Blue );
}
Actual Asymptote output VIZ-11-003 · native vector output Asymptote · exit 0
Command or choice Meaning arrays + native pathsNative drawing method used here. cells.tsvShared numeric input; column definitions are in data/recipes.json. Fixed rangesSame axis domain and statistical definition in all five implementations.
Complete standalone program import graph ;
size ( 420 bp , 280 bp , IgnoreAspect );
defaultpen ( fontsize ( 8 ));
pen Blue = rgb ( 0 , 84 / 255 , 159 / 255 ), Teal = rgb ( 0 , 177 / 255 , 183 / 255 );
pen Orange = rgb ( 246 / 255 , 168 / 255 , 0 ), Wash = rgb ( 232 / 255 , 241 / 255 , 250 / 255 );
pen Missing = rgb ( 236 / 255 , 236 / 255 , 237 / 255 );
pair P ( real x , real y ) {
return ( 55 + 345 * ( x - ( 0 )) / ( 75 ), 45 + 175 * ( y - ( 0.5 )) / ( 4.0 ));
}
void rect ( real x , real y , real xx , real yy , pen p ) {
fill ( P ( x , y ) -- P ( xx , y ) -- P ( xx , yy ) -- P ( x , yy ) -- cycle , p );
}
fill ( box (( 0 , 0 ), ( 420 , 280 )), white );
label ( "VIZ-11-003" , ( 414 , 272 ), SW , fontsize ( 8 ));
label ( "Colour: survival 0-100\%; circle area: n" , ( 55 , 246 ), E , fontsize ( 7 ));
fill ( box (( 55 , 231 ), ( 61 , 237 )), 0.975 * Wash + 0.025 * Blue );
fill ( box (( 61 , 231 ), ( 67 , 237 )), 0.925 * Wash + 0.075 * Blue );
fill ( box (( 67 , 231 ), ( 73 , 237 )), 0.875 * Wash + 0.125 * Blue );
fill ( box (( 73 , 231 ), ( 79 , 237 )), 0.825 * Wash + 0.175 * Blue );
fill ( box (( 79 , 231 ), ( 85 , 237 )), 0.775 * Wash + 0.225 * Blue );
fill ( box (( 85 , 231 ), ( 91 , 237 )), 0.725 * Wash + 0.275 * Blue );
fill ( box (( 91 , 231 ), ( 97 , 237 )), 0.675 * Wash + 0.325 * Blue );
fill ( box (( 97 , 231 ), ( 103 , 237 )), 0.625 * Wash + 0.375 * Blue );
fill ( box (( 103 , 231 ), ( 109 , 237 )), 0.575 * Wash + 0.425 * Blue );
fill ( box (( 109 , 231 ), ( 115 , 237 )), 0.525 * Wash + 0.475 * Blue );
fill ( box (( 115 , 231 ), ( 121 , 237 )), 0.475 * Wash + 0.525 * Blue );
fill ( box (( 121 , 231 ), ( 127 , 237 )), 0.42500000000000004 * Wash + 0.575 * Blue );
fill ( box (( 127 , 231 ), ( 133 , 237 )), 0.375 * Wash + 0.625 * Blue );
fill ( box (( 133 , 231 ), ( 139 , 237 )), 0.32499999999999996 * Wash + 0.675 * Blue );
fill ( box (( 139 , 231 ), ( 145 , 237 )), 0.275 * Wash + 0.725 * Blue );
fill ( box (( 145 , 231 ), ( 151 , 237 )), 0.22499999999999998 * Wash + 0.775 * Blue );
fill ( box (( 151 , 231 ), ( 157 , 237 )), 0.17500000000000004 * Wash + 0.825 * Blue );
fill ( box (( 157 , 231 ), ( 163 , 237 )), 0.125 * Wash + 0.875 * Blue );
fill ( box (( 163 , 231 ), ( 169 , 237 )), 0.07499999999999996 * Wash + 0.925 * Blue );
fill ( box (( 169 , 231 ), ( 175 , 237 )), 0.025000000000000022 * Wash + 0.975 * Blue );
label ( "0" , ( 55 , 230 ), S , fontsize ( 6 ));
label ( "50" , ( 115 , 230 ), S , fontsize ( 6 ));
label ( "100\%" , ( 175 , 230 ), S , fontsize ( 6 ));
fill ( circle (( 280 , 235 ), 1.987866419864727 ), Blue );
label ( "n=10" , ( 280 , 227 ), S , fontsize ( 6 ));
fill ( circle (( 325 , 235 ), 4.445004445006667 ), Blue );
label ( "n=50" , ( 325 , 227 ), S , fontsize ( 6 ));
fill ( circle (( 370 , 235 ), 6.286185570937121 ), Blue );
label ( "n=100" , ( 370 , 227 ), S , fontsize ( 6 ));
draw ( P ( 0 , 4.5 ) -- P ( 0 , 0.5 ) -- P ( 75 , 0.5 ), gray ( .4 ));
label ( "0" , P ( 0 , 0.5 ), S , fontsize ( 7 ));
label ( "15" , P ( 15 , 0.5 ), S , fontsize ( 7 ));
label ( "30" , P ( 30 , 0.5 ), S , fontsize ( 7 ));
label ( "45" , P ( 45 , 0.5 ), S , fontsize ( 7 ));
label ( "60" , P ( 60 , 0.5 ), S , fontsize ( 7 ));
label ( "75" , P ( 75 , 0.5 ), S , fontsize ( 7 ));
label ( "Crew" , P ( 0 , 1 ), W , fontsize ( 7 ));
label ( "3rd" , P ( 0 , 2 ), W , fontsize ( 7 ));
label ( "2nd" , P ( 0 , 3 ), W , fontsize ( 7 ));
label ( "1st" , P ( 0 , 4 ), W , fontsize ( 7 ));
label ( "Age band (years)" , ( 227.5 , 13 ), fontsize ( 8 ));
label ( rotate ( 90 ) * Label ( "Group" ), ( 13 , 132 ), fontsize ( 8 ));
// BEGIN EXAMPLE
real [][] d = input ( "data/cells.tsv" ). line ();
for ( int i = 0 ; i < d . length ; ++ i ) {
real [] v = d [ i ];
if ( v [ 3 ] > 0 ) fill ( circle ( P ( v [ 0 ], v [ 1 ]), v [ 5 ] / 2 ),
( 1 - v [ 2 ] / 100 ) * Wash + ( v [ 2 ] / 100 ) * Blue );
}
// END EXAMPLE
shipout ( "VIZ-11-003" , bbox ( 0 ));
Native build log
Download: Source · Source + data ZIP · SVG · PDF · PNG
Copy link VIZ-11-004 MetaPost: bubble MetaPost reads numeric fields with gdata and scantokens, then constructs the chart with paths, TeX labels and colour interpolation.
Back to comparison gallery Drawing commands numeric n , v [][];
n := 0 ;
gdata ( "data/cells.tsv" , c ,
n := n + 1 ;
for j = 1 upto 6 :
v [ n ][ j ] := scantokens c [ j ];
endfor
);
for k = 1 upto n :
if v [ k ][ 4 ] > 0 :
fill fullcircle scaled v [ k ][ 6 ] shifted P ( v [ k ][ 1 ], v [ k ][ 2 ])
withcolor ( v [ k ][ 3 ] / 100 )[ Wash , Blue ];
fi
endfor
Actual MetaPost output VIZ-11-004 · native vector output MetaPost · exit 0
Command or choice Meaning gdata + pathsNative drawing method used here. cells.tsvShared numeric input; column definitions are in data/recipes.json. Fixed rangesSame axis domain and statistical definition in all five implementations.
Complete standalone program input graph ;
prologues := 3 ;
outputformat := "svg" ;
outputtemplate := "VIZ-11-004.svg" ;
color Blue , Teal , Orange , Wash , Missing ;
Blue := ( 0 , 84 / 255 , 159 / 255 );
Teal := ( 0 , 177 / 255 , 183 / 255 );
Orange := ( 246 / 255 , 168 / 255 , 0 );
Wash := ( 232 / 255 , 241 / 255 , 250 / 255 );
Missing := ( 236 / 255 , 236 / 255 , 237 / 255 );
vardef P ( expr x , y ) =
( 55 + 345 * ( x - ( 0 )) / ( 75 ), 45 + 175 * ( y - ( 0.5 )) / ( 4.0 ))
enddef ;
def rect ( expr x , y , xx , yy , col ) =
fill P ( x , y ) -- P ( xx , y ) -- P ( xx , yy ) -- P ( x , yy ) -- cycle withcolor col ;
enddef ;
beginfig ( 1 );
fill unitsquare xscaled 420 yscaled 280 withcolor white ;
label .llft ( "VIZ-11-004" infont "cmr8" , ( 414 , 272 ));
label .rt ( btex Colour: survival 0-100\%; circle area: n etex scaled .65 , ( 55 , 246 ));
fill unitsquare xscaled 6 yscaled 6 shifted ( 55 , 231 ) withcolor 0.025 [ Wash , Blue ];
fill unitsquare xscaled 6 yscaled 6 shifted ( 61 , 231 ) withcolor 0.075 [ Wash , Blue ];
fill unitsquare xscaled 6 yscaled 6 shifted ( 67 , 231 ) withcolor 0.125 [ Wash , Blue ];
fill unitsquare xscaled 6 yscaled 6 shifted ( 73 , 231 ) withcolor 0.175 [ Wash , Blue ];
fill unitsquare xscaled 6 yscaled 6 shifted ( 79 , 231 ) withcolor 0.225 [ Wash , Blue ];
fill unitsquare xscaled 6 yscaled 6 shifted ( 85 , 231 ) withcolor 0.275 [ Wash , Blue ];
fill unitsquare xscaled 6 yscaled 6 shifted ( 91 , 231 ) withcolor 0.325 [ Wash , Blue ];
fill unitsquare xscaled 6 yscaled 6 shifted ( 97 , 231 ) withcolor 0.375 [ Wash , Blue ];
fill unitsquare xscaled 6 yscaled 6 shifted ( 103 , 231 ) withcolor 0.425 [ Wash , Blue ];
fill unitsquare xscaled 6 yscaled 6 shifted ( 109 , 231 ) withcolor 0.475 [ Wash , Blue ];
fill unitsquare xscaled 6 yscaled 6 shifted ( 115 , 231 ) withcolor 0.525 [ Wash , Blue ];
fill unitsquare xscaled 6 yscaled 6 shifted ( 121 , 231 ) withcolor 0.575 [ Wash , Blue ];
fill unitsquare xscaled 6 yscaled 6 shifted ( 127 , 231 ) withcolor 0.625 [ Wash , Blue ];
fill unitsquare xscaled 6 yscaled 6 shifted ( 133 , 231 ) withcolor 0.675 [ Wash , Blue ];
fill unitsquare xscaled 6 yscaled 6 shifted ( 139 , 231 ) withcolor 0.725 [ Wash , Blue ];
fill unitsquare xscaled 6 yscaled 6 shifted ( 145 , 231 ) withcolor 0.775 [ Wash , Blue ];
fill unitsquare xscaled 6 yscaled 6 shifted ( 151 , 231 ) withcolor 0.825 [ Wash , Blue ];
fill unitsquare xscaled 6 yscaled 6 shifted ( 157 , 231 ) withcolor 0.875 [ Wash , Blue ];
fill unitsquare xscaled 6 yscaled 6 shifted ( 163 , 231 ) withcolor 0.925 [ Wash , Blue ];
fill unitsquare xscaled 6 yscaled 6 shifted ( 169 , 231 ) withcolor 0.975 [ Wash , Blue ];
label .bot ( btex 0 etex scaled .6 , ( 55 , 230 ));
label .bot ( btex 50 etex scaled .6 , ( 115 , 230 ));
label .bot ( btex 100\% etex scaled .6 , ( 175 , 230 ));
fill fullcircle scaled 3.975732839729454 shifted ( 280 , 235 ) withcolor Blue ;
label .bot ( btex n=10 etex scaled .6 , ( 280 , 227 ));
fill fullcircle scaled 8.890008890013334 shifted ( 325 , 235 ) withcolor Blue ;
label .bot ( btex n=50 etex scaled .6 , ( 325 , 227 ));
fill fullcircle scaled 12.572371141874243 shifted ( 370 , 235 ) withcolor Blue ;
label .bot ( btex n=100 etex scaled .6 , ( 370 , 227 ));
draw P ( 0 , 4.5 ) -- P ( 0 , 0.5 ) -- P ( 75 , 0.5 ) withcolor .4 white ;
label .bot ( btex 0 etex scaled .7 , P ( 0 , 0.5 ));
label .bot ( btex 15 etex scaled .7 , P ( 15 , 0.5 ));
label .bot ( btex 30 etex scaled .7 , P ( 30 , 0.5 ));
label .bot ( btex 45 etex scaled .7 , P ( 45 , 0.5 ));
label .bot ( btex 60 etex scaled .7 , P ( 60 , 0.5 ));
label .bot ( btex 75 etex scaled .7 , P ( 75 , 0.5 ));
label .lft ( btex Crew etex scaled .7 , P ( 0 , 1 ));
label .lft ( btex 3rd etex scaled .7 , P ( 0 , 2 ));
label .lft ( btex 2nd etex scaled .7 , P ( 0 , 3 ));
label .lft ( btex 1st etex scaled .7 , P ( 0 , 4 ));
label ( btex Age band (years) etex scaled .8 , ( 227.5 , 13 ));
label ( btex Group etex scaled .8 rotated 90 , ( 13 , 132 ));
% BEGIN EXAMPLE
numeric n , v [][];
n := 0 ;
gdata ( "data/cells.tsv" , c ,
n := n + 1 ;
for j = 1 upto 6 :
v [ n ][ j ] := scantokens c [ j ];
endfor
);
for k = 1 upto n :
if v [ k ][ 4 ] > 0 :
fill fullcircle scaled v [ k ][ 6 ] shifted P ( v [ k ][ 1 ], v [ k ][ 2 ])
withcolor ( v [ k ][ 3 ] / 100 )[ Wash , Blue ];
fi
endfor
% END EXAMPLE
setbounds currentpicture to unitsquare xscaled 420 yscaled 280 ;
endfig ;
end .
Native build log Download: Source · Source + data ZIP · SVG · PDF · PNG
Copy link VIZ-11-005 GMT: bubble GMT reads selected columns through its native plotting modules; column expressions are performed by the shown local awk pipeline. The shared tables determine the statistics.
Back to comparison gallery Drawing commands # GMT variable circle diameters are centimetres; 72 bp = 1 inch.
awk '$4>0 {print $1,$2,$3,$6/72*2.54}' data/cells.tsv | gmt plot -Sc -Cdata/survival.cpt
Actual GMT output VIZ-11-005 · native vector output GMT · exit 0
Command or choice Meaning plot -Sc + CPTNative drawing method used here. cells.tsvShared numeric input; column definitions are in data/recipes.json. Fixed rangesSame axis domain and statistical definition in all five implementations.
Complete standalone program #!/usr/bin/env bash
set -euo pipefail
export GMT_USERDIR = " $PWD /.gmt"
mkdir -p " $GMT_USERDIR "
gmt begin VIZ-11-005 pdf
gmt set \
FONT_ANNOT_PRIMARY 7p \
FONT_LABEL 8p \
FONT_TITLE 8p \
MAP_TITLE_OFFSET 4p \
MAP_FRAME_TYPE plain \
MAP_TICK_LENGTH_PRIMARY 3p
gmt plot -R0/420/0/280 -JX420p/280p -Gwhite -W0p <<'CANVAS'
0 0
420 0
420 280
0 280
CANVAS
gmt text -F+f8p+jTR <<'ID'
414 272 VIZ-11-005
ID
gmt text -F+f7p+jML <<'LEGEND'
55 246 Colour: survival 0-100%; circle area: n
LEGEND
echo "58 234" | gmt plot -Sr6p/6p -G#e2edf8
echo "64 234" | gmt plot -Sr6p/6p -G#d7e5f3
echo "70 234" | gmt plot -Sr6p/6p -G#cbddef
echo "76 234" | gmt plot -Sr6p/6p -G#bfd6ea
echo "82 234" | gmt plot -Sr6p/6p -G#b4cee6
echo "88 234" | gmt plot -Sr6p/6p -G#a8c6e1
echo "94 234" | gmt plot -Sr6p/6p -G#9dbedc
echo "100 234" | gmt plot -Sr6p/6p -G#91b6d8
echo "106 234" | gmt plot -Sr6p/6p -G#85aed3
echo "112 234" | gmt plot -Sr6p/6p -G#7aa6cf
echo "118 234" | gmt plot -Sr6p/6p -G#6e9fca
echo "124 234" | gmt plot -Sr6p/6p -G#6397c6
echo "130 234" | gmt plot -Sr6p/6p -G#578fc1
echo "136 234" | gmt plot -Sr6p/6p -G#4b87bd
echo "142 234" | gmt plot -Sr6p/6p -G#407fb8
echo "148 234" | gmt plot -Sr6p/6p -G#3477b3
echo "154 234" | gmt plot -Sr6p/6p -G#296faf
echo "160 234" | gmt plot -Sr6p/6p -G#1d68aa
echo "166 234" | gmt plot -Sr6p/6p -G#1160a6
echo "172 234" | gmt plot -Sr6p/6p -G#0658a1
echo "55 229 0" | gmt text -F+f6p+jTC
echo "115 229 50" | gmt text -F+f6p+jTC
echo "175 229 100%" | gmt text -F+f6p+jTC
echo "280 235" | gmt plot -Sc3.975732839729454p -G#00549f
echo "280 227 n=10" | gmt text -F+f6p+jTC
echo "325 235" | gmt plot -Sc8.890008890013334p -G#00549f
echo "325 227 n=50" | gmt text -F+f6p+jTC
echo "370 235" | gmt plot -Sc12.572371141874243p -G#00549f
echo "370 227 n=100" | gmt text -F+f6p+jTC
gmt basemap -R0/75/0.5/4.5 -JX345p/175p -X55p -Y45p -Bpxa15+l"Age band (years)" \
-Bpycdata/classes-y.txt+l"Group" -BWS
# BEGIN EXAMPLE
# GMT variable circle diameters are centimetres; 72 bp = 1 inch.
awk '$4>0 {print $1,$2,$3,$6/72*2.54}' data/cells.tsv | gmt plot -Sc -Cdata/survival.cpt
# END EXAMPLE
gmt end
Native build log
Download: Source · Source + data ZIP · SVG · PDF · PNG
Copy link VIZ-12-001 PGFplots / TikZ: facets A native 2-by-2 group plot fixes the same ranges and bins in every panel.
Back to comparison gallery Drawing commands \begin { scope} [shift={ (55bp,155bp)} ]
\begin { groupplot} [
group style={ group size=2 by 2,horizontal sep=40bp,vertical sep=42bp} ,
anchor=south west, width=150bp,
height=65bp, scale only axis,
xmin=0, xmax=75,
ymin=0, ymax=200,
xtick={ 0,25,50,75} , ytick={ 0,100,200} ,
axis lines=left, tick label style={ font=\tiny } ,
title style={ font=\small } , xlabel={ Age (years)} ,
ylabel={ People}
]
\nextgroupplot [title={1st (n=323)}]
\addplot [ybar,bar shift=0pt,bar width=6bp,fill=Blue,draw=white,line width=.2bp]
table[x index=0,y index=6]{ data/ages.tsv} ;
\nextgroupplot [title={2nd (n=284)}]
\addplot [ybar,bar shift=0pt,bar width=6bp,fill=Blue,draw=white,line width=.2bp]
table[x index=0,y index=7]{ data/ages.tsv} ;
\nextgroupplot [title={3rd (n=708)}]
\addplot [ybar,bar shift=0pt,bar width=6bp,fill=Blue,draw=white,line width=.2bp]
table[x index=0,y index=8]{ data/ages.tsv} ;
\nextgroupplot [title={Crew (n=890)}]
\addplot [ybar,bar shift=0pt,bar width=6bp,fill=Blue,draw=white,line width=.2bp]
table[x index=0,y index=9]{ data/ages.tsv} ;
\end { groupplot}
\end { scope}
Actual PGFplots / TikZ output VIZ-12-001 · native vector output PGFplots / TikZ · exit 0
Command or choice Meaning groupplotNative drawing method used here. ages.tsvShared numeric input; column definitions are in data/recipes.json. Fixed rangesSame axis domain and statistical definition in all five implementations.
Complete standalone program \documentclass [tikz,border=0pt] { standalone}
\usepackage { pgfplots,pgfplotstable}
\usepgfplotslibrary { statistics,groupplots}
\pgfplotsset { compat=1.18}
\definecolor { Blue}{ HTML}{ 00549F}
\definecolor { Teal}{ HTML}{ 00B1B7}
\definecolor { Orange}{ HTML}{ F6A800}
\definecolor { Wash}{ HTML}{ E8F1FA}
\definecolor { Missing}{ HTML}{ ECECED}
\begin { document}
\begin { tikzpicture} [font=\fontsize { 8}{ 10} \selectfont ]
\path [use as bounding box,fill=white] (0,0) rectangle (420bp,280bp);
\node [anchor=north east] at (414bp,272bp) { VIZ-12-001} ;
\node [anchor=west,font=\fontsize{7}{9}\selectfont] at
(55bp,246bp) { Known ages; common bins and common count scale} ;
% BEGIN EXAMPLE
\begin { scope} [shift={ (55bp,155bp)} ]
\begin { groupplot} [
group style={ group size=2 by 2,horizontal sep=40bp,vertical sep=42bp} ,
anchor=south west, width=150bp,
height=65bp, scale only axis,
xmin=0, xmax=75,
ymin=0, ymax=200,
xtick={ 0,25,50,75} , ytick={ 0,100,200} ,
axis lines=left, tick label style={ font=\tiny } ,
title style={ font=\small } , xlabel={ Age (years)} ,
ylabel={ People}
]
\nextgroupplot [title={1st (n=323)}]
\addplot [ybar,bar shift=0pt,bar width=6bp,fill=Blue,draw=white,line width=.2bp]
table[x index=0,y index=6]{ data/ages.tsv} ;
\nextgroupplot [title={2nd (n=284)}]
\addplot [ybar,bar shift=0pt,bar width=6bp,fill=Blue,draw=white,line width=.2bp]
table[x index=0,y index=7]{ data/ages.tsv} ;
\nextgroupplot [title={3rd (n=708)}]
\addplot [ybar,bar shift=0pt,bar width=6bp,fill=Blue,draw=white,line width=.2bp]
table[x index=0,y index=8]{ data/ages.tsv} ;
\nextgroupplot [title={Crew (n=890)}]
\addplot [ybar,bar shift=0pt,bar width=6bp,fill=Blue,draw=white,line width=.2bp]
table[x index=0,y index=9]{ data/ages.tsv} ;
\end { groupplot}
\end { scope}
% END EXAMPLE
\end { tikzpicture}
\end { document}
Native build log Download: Source · Source + data ZIP · SVG · PDF · PNG
Copy link VIZ-12-002 gnuplot: facets Four native plots reuse the same ranges and corresponding class columns.
Back to comparison gallery Drawing commands set boxwidth 3 absolute
unset label 2
set multiplot
set yrange [ 0 : 200 ]
set ytics 100
set xtics 25
set lmargin at screen 0.13095238095238096
set rmargin at screen 0.4880952380952381
set bmargin at screen 0.5535714285714286
set tmargin at screen 0.7857142857142857
set title "1st" offset 0 , - .5
plot "data/ages.tsv" using 1 : 7 with boxes lc rgb "#00549f"
set lmargin at screen 0.5952380952380952
set rmargin at screen 0.9523809523809523
set bmargin at screen 0.5535714285714286
set tmargin at screen 0.7857142857142857
set title "2nd" offset 0 , - .5
plot "data/ages.tsv" using 1 : 8 with boxes lc rgb "#00549f"
set lmargin at screen 0.13095238095238096
set rmargin at screen 0.4880952380952381
set bmargin at screen 0.17142857142857143
set tmargin at screen 0.4035714285714286
set title "3rd" offset 0 , - .5
plot "data/ages.tsv" using 1 : 9 with boxes lc rgb "#00549f"
set lmargin at screen 0.5952380952380952
set rmargin at screen 0.9523809523809523
set bmargin at screen 0.17142857142857143
set tmargin at screen 0.4035714285714286
set title "Crew" offset 0 , - .5
plot "data/ages.tsv" using 1 : 10 with boxes lc rgb "#00549f"
unset multiplot
Actual gnuplot output VIZ-12-002 · native vector output gnuplot · exit 0
Command or choice Meaning multiplotNative drawing method used here. ages.tsvShared numeric input; column definitions are in data/recipes.json. Fixed rangesSame axis domain and statistical definition in all five implementations.
Complete standalone program set terminal pdfcairo size 5.833333 in , 3.888889 in font "Helvetica,8"
set output "VIZ-12-002.pdf"
set lmargin at screen 0.13095238095238096
set rmargin at screen 0.9523809523809523
set bmargin at screen 0.16071428571428573
set tmargin at screen 0.7857142857142857
set xrange [ 0 : 75 ]
set yrange [ 0 : 200 ]
set xtics ( "0" 0 , "25" 25 , "50" 50 , "75" 75 )
set ytics ( "0" 0 , "50" 50 , "100" 100 , "150" 150 , "200" 200 )
set xlabel "Age (years)"
set ylabel "People"
set border 3
set tics out nomirror
unset key
set style fill solid 1.0 noborder
set label 1 "VIZ-12-002" at screen .985 , .97 right
set label 2 "Known ages; common bins and common count scale" at screen .13 , .88 left \
font ",7"
set palette defined ( 0 "#e8f1fa" , 100 "#00549f" )
set cbrange [ 0 : 100 ]
unset colorbox
# BEGIN EXAMPLE
set boxwidth 3 absolute
unset label 2
set multiplot
set yrange [ 0 : 200 ]
set ytics 100
set xtics 25
set lmargin at screen 0.13095238095238096
set rmargin at screen 0.4880952380952381
set bmargin at screen 0.5535714285714286
set tmargin at screen 0.7857142857142857
set title "1st" offset 0 , - .5
plot "data/ages.tsv" using 1 : 7 with boxes lc rgb "#00549f"
set lmargin at screen 0.5952380952380952
set rmargin at screen 0.9523809523809523
set bmargin at screen 0.5535714285714286
set tmargin at screen 0.7857142857142857
set title "2nd" offset 0 , - .5
plot "data/ages.tsv" using 1 : 8 with boxes lc rgb "#00549f"
set lmargin at screen 0.13095238095238096
set rmargin at screen 0.4880952380952381
set bmargin at screen 0.17142857142857143
set tmargin at screen 0.4035714285714286
set title "3rd" offset 0 , - .5
plot "data/ages.tsv" using 1 : 9 with boxes lc rgb "#00549f"
set lmargin at screen 0.5952380952380952
set rmargin at screen 0.9523809523809523
set bmargin at screen 0.17142857142857143
set tmargin at screen 0.4035714285714286
set title "Crew" offset 0 , - .5
plot "data/ages.tsv" using 1 : 10 with boxes lc rgb "#00549f"
unset multiplot
# END EXAMPLE
unset output
Native build log
Download: Source · Source + data ZIP · SVG · PDF · PNG
Copy link VIZ-12-003 Asymptote: facets Asymptote draws four separate pictures and translates them into a common canvas, preserving each panel scale.
Back to comparison gallery Drawing commands real [][] d = input ( "data/ages.tsv" ). line ();
string [] names = { "1st" , "2nd" , "3rd" , "Crew" };
for ( int j = 0 ; j < 4 ; ++ j ) {
real x = 55 + 195 * ( j % 2 ), y = 155 - 107 * floor ( j / 2 );
picture panel ;
draw ( panel , ( 0 , 65 ) -- ( 0 , 0 ) -- ( 150 , 0 ), gray ( .4 ));
for ( int t = 0 ; t <= 75 ; t += 25 )
label ( panel , string ( t ), ( 2 * t , 0 ), S , fontsize ( 6 ));
for ( int t = 0 ; t <= 200 ; t += 100 )
label ( panel , string ( t ), ( 0 , 65 * t / 200 ), W , fontsize ( 6 ));
label ( panel , names [ j ], ( 75 , 76 ), fontsize ( 8 ));
label ( panel , "Age (years)" , ( 75 , - 20 ), fontsize ( 7 ));
for ( int i = 0 ; i < d . length ; ++ i ) {
real [] v = d [ i ];
fill ( panel , box (( 2 * v [ 1 ], 0 ), ( 2 * v [ 2 ], 65 * v [ 6 + j ] / 200 )), Blue );
}
add ( shift ( x , y ) * panel );
}
Actual Asymptote output VIZ-12-003 · native vector output Asymptote · exit 0
Command or choice Meaning arrays + native pathsNative drawing method used here. ages.tsvShared numeric input; column definitions are in data/recipes.json. Fixed rangesSame axis domain and statistical definition in all five implementations.
Complete standalone program import graph ;
size ( 420 bp , 280 bp , IgnoreAspect );
defaultpen ( fontsize ( 8 ));
pen Blue = rgb ( 0 , 84 / 255 , 159 / 255 ), Teal = rgb ( 0 , 177 / 255 , 183 / 255 );
pen Orange = rgb ( 246 / 255 , 168 / 255 , 0 ), Wash = rgb ( 232 / 255 , 241 / 255 , 250 / 255 );
pen Missing = rgb ( 236 / 255 , 236 / 255 , 237 / 255 );
pair P ( real x , real y ) {
return ( 55 + 345 * ( x - ( 0 )) / ( 75 ), 45 + 175 * ( y - ( 0 )) / ( 200 ));
}
void rect ( real x , real y , real xx , real yy , pen p ) {
fill ( P ( x , y ) -- P ( xx , y ) -- P ( xx , yy ) -- P ( x , yy ) -- cycle , p );
}
fill ( box (( 0 , 0 ), ( 420 , 280 )), white );
label ( "VIZ-12-003" , ( 414 , 272 ), SW , fontsize ( 8 ));
label ( "Known ages; common bins and common count scale" , ( 55 , 246 ), E , fontsize ( 7 ));
// BEGIN EXAMPLE
real [][] d = input ( "data/ages.tsv" ). line ();
string [] names = { "1st" , "2nd" , "3rd" , "Crew" };
for ( int j = 0 ; j < 4 ; ++ j ) {
real x = 55 + 195 * ( j % 2 ), y = 155 - 107 * floor ( j / 2 );
picture panel ;
draw ( panel , ( 0 , 65 ) -- ( 0 , 0 ) -- ( 150 , 0 ), gray ( .4 ));
for ( int t = 0 ; t <= 75 ; t += 25 )
label ( panel , string ( t ), ( 2 * t , 0 ), S , fontsize ( 6 ));
for ( int t = 0 ; t <= 200 ; t += 100 )
label ( panel , string ( t ), ( 0 , 65 * t / 200 ), W , fontsize ( 6 ));
label ( panel , names [ j ], ( 75 , 76 ), fontsize ( 8 ));
label ( panel , "Age (years)" , ( 75 , - 20 ), fontsize ( 7 ));
for ( int i = 0 ; i < d . length ; ++ i ) {
real [] v = d [ i ];
fill ( panel , box (( 2 * v [ 1 ], 0 ), ( 2 * v [ 2 ], 65 * v [ 6 + j ] / 200 )), Blue );
}
add ( shift ( x , y ) * panel );
}
// END EXAMPLE
shipout ( "VIZ-12-003" , bbox ( 0 ));
Native build log
Download: Source · Source + data ZIP · SVG · PDF · PNG
Copy link VIZ-12-004 MetaPost: facets MetaPost composes four native pictures on the same canvas, using a common scale and a separate count column for each group.
Back to comparison gallery Drawing commands numeric n , v [][];
n := 0 ;
gdata ( "data/ages.tsv" , c ,
n := n + 1 ;
for j = 1 upto 10 :
v [ n ][ j ] := scantokens c [ j ];
endfor
);
picture panel ;
for m = 0 upto 3 :
panel := nullpicture ;
addto panel doublepath ( 0 , 65 ) -- ( 0 , 0 ) -- ( 150 , 0 ) withcolor .4 white ;
for t = 0 step 25 until 75 :
addto panel also thelabel .bot ( decimal t infont "cmr7" , ( 2 t , 0 ));
endfor
for t = 0 step 100 until 200 :
addto panel also thelabel .lft ( decimal t infont "cmr7" , ( 0 , 65 t / 200 ));
endfor
addto panel also thelabel ( btex Age (years) etex scaled .7 , ( 75 , - 20 ));
for k = 1 upto n :
addto panel contour ( 2 v [ k ][ 2 ], 0 ) -- ( 2 v [ k ][ 3 ], 0 ) -- ( 2 v [ k ][ 3 ],
65 v [ k ][ 7 + m ] / 200 ) -- ( 2 v [ k ][ 2 ], 65 v [ k ][ 7 + m ] / 200 ) -- cycle
withcolor Blue ;
endfor
if m = 0 :
addto panel also thelabel ( btex 1st etex scaled .8 , ( 75 , 76 ));
fi
if m = 1 :
addto panel also thelabel ( btex 2nd etex scaled .8 , ( 75 , 76 ));
fi
if m = 2 :
addto panel also thelabel ( btex 3rd etex scaled .8 , ( 75 , 76 ));
fi
if m = 3 :
addto panel also thelabel ( btex Crew etex scaled .8 , ( 75 , 76 ));
fi
draw panel shifted ( 55 + 195 * ( m mod 2 ), 155 - 107 * floor ( m / 2 ));
endfor
Actual MetaPost output VIZ-12-004 · native vector output MetaPost · exit 0
Command or choice Meaning gdata + pathsNative drawing method used here. ages.tsvShared numeric input; column definitions are in data/recipes.json. Fixed rangesSame axis domain and statistical definition in all five implementations.
Complete standalone program input graph ;
prologues := 3 ;
outputformat := "svg" ;
outputtemplate := "VIZ-12-004.svg" ;
color Blue , Teal , Orange , Wash , Missing ;
Blue := ( 0 , 84 / 255 , 159 / 255 );
Teal := ( 0 , 177 / 255 , 183 / 255 );
Orange := ( 246 / 255 , 168 / 255 , 0 );
Wash := ( 232 / 255 , 241 / 255 , 250 / 255 );
Missing := ( 236 / 255 , 236 / 255 , 237 / 255 );
vardef P ( expr x , y ) =
( 55 + 345 * ( x - ( 0 )) / ( 75 ), 45 + 175 * ( y - ( 0 )) / ( 200 ))
enddef ;
def rect ( expr x , y , xx , yy , col ) =
fill P ( x , y ) -- P ( xx , y ) -- P ( xx , yy ) -- P ( x , yy ) -- cycle withcolor col ;
enddef ;
beginfig ( 1 );
fill unitsquare xscaled 420 yscaled 280 withcolor white ;
label .llft ( "VIZ-12-004" infont "cmr8" , ( 414 , 272 ));
label .rt ( btex Known ages; common bins and common count scale etex scaled .65 , ( 55 ,
246 ));
% BEGIN EXAMPLE
numeric n , v [][];
n := 0 ;
gdata ( "data/ages.tsv" , c ,
n := n + 1 ;
for j = 1 upto 10 :
v [ n ][ j ] := scantokens c [ j ];
endfor
);
picture panel ;
for m = 0 upto 3 :
panel := nullpicture ;
addto panel doublepath ( 0 , 65 ) -- ( 0 , 0 ) -- ( 150 , 0 ) withcolor .4 white ;
for t = 0 step 25 until 75 :
addto panel also thelabel .bot ( decimal t infont "cmr7" , ( 2 t , 0 ));
endfor
for t = 0 step 100 until 200 :
addto panel also thelabel .lft ( decimal t infont "cmr7" , ( 0 , 65 t / 200 ));
endfor
addto panel also thelabel ( btex Age (years) etex scaled .7 , ( 75 , - 20 ));
for k = 1 upto n :
addto panel contour ( 2 v [ k ][ 2 ], 0 ) -- ( 2 v [ k ][ 3 ], 0 ) -- ( 2 v [ k ][ 3 ],
65 v [ k ][ 7 + m ] / 200 ) -- ( 2 v [ k ][ 2 ], 65 v [ k ][ 7 + m ] / 200 ) -- cycle
withcolor Blue ;
endfor
if m = 0 :
addto panel also thelabel ( btex 1st etex scaled .8 , ( 75 , 76 ));
fi
if m = 1 :
addto panel also thelabel ( btex 2nd etex scaled .8 , ( 75 , 76 ));
fi
if m = 2 :
addto panel also thelabel ( btex 3rd etex scaled .8 , ( 75 , 76 ));
fi
if m = 3 :
addto panel also thelabel ( btex Crew etex scaled .8 , ( 75 , 76 ));
fi
draw panel shifted ( 55 + 195 * ( m mod 2 ), 155 - 107 * floor ( m / 2 ));
endfor
% END EXAMPLE
setbounds currentpicture to unitsquare xscaled 420 yscaled 280 ;
endfig ;
end .
Native build log Download: Source · Source + data ZIP · SVG · PDF · PNG
Copy link VIZ-12-005 GMT: facets GMT reads selected columns through its native plotting modules; column expressions are performed by the shown local awk pipeline. The shared tables determine the statistics.
Back to comparison gallery Drawing commands subplot begin 2x2 -Fs150p/65p -M20p/21p -X55p -Y45p
gmt subplot set 0
gmt basemap -R0/75/0/200 -JX? -Bpxa25+l"Age (years)" -Bpya100+lPeople -BWS+t"1st"
gmt plot data/ages.tsv -i0,6 -Sb6p+b0 -G#00549f
gmt subplot set 1
gmt basemap -R0/75/0/200 -JX? -Bpxa25+l"Age (years)" -Bpya100+lPeople -BWS+t"2nd"
gmt plot data/ages.tsv -i0,7 -Sb6p+b0 -G#00549f
gmt subplot set 2
gmt basemap -R0/75/0/200 -JX? -Bpxa25+l"Age (years)" -Bpya100+lPeople -BWS+t"3rd"
gmt plot data/ages.tsv -i0,8 -Sb6p+b0 -G#00549f
gmt subplot set 3
gmt basemap -R0/75/0/200 -JX? -Bpxa25+l"Age (years)" -Bpya100+lPeople -BWS+t"Crew"
gmt plot data/ages.tsv -i0,9 -Sb6p+b0 -G#00549f
gmt subplot end
Actual GMT output VIZ-12-005 · native vector output GMT · exit 0
Command or choice Meaning subplotNative drawing method used here. ages.tsvShared numeric input; column definitions are in data/recipes.json. Fixed rangesSame axis domain and statistical definition in all five implementations.
Complete standalone program #!/usr/bin/env bash
set -euo pipefail
export GMT_USERDIR = " $PWD /.gmt"
mkdir -p " $GMT_USERDIR "
gmt begin VIZ-12-005 pdf
gmt set \
FONT_ANNOT_PRIMARY 7p \
FONT_LABEL 8p \
FONT_TITLE 8p \
MAP_TITLE_OFFSET 4p \
MAP_FRAME_TYPE plain \
MAP_TICK_LENGTH_PRIMARY 3p
gmt plot -R0/420/0/280 -JX420p/280p -Gwhite -W0p <<'CANVAS'
0 0
420 0
420 280
0 280
CANVAS
gmt text -F+f8p+jTR <<'ID'
414 272 VIZ-12-005
ID
gmt text -F+f7p+jML <<'LEGEND'
55 246 Known ages; common bins and common count scale
LEGEND
# BEGIN EXAMPLE
gmt subplot begin 2x2 -Fs150p/65p -M20p/21p -X55p -Y45p
gmt subplot set 0
gmt basemap -R0/75/0/200 -JX? -Bpxa25+l"Age (years)" -Bpya100+lPeople -BWS+t"1st"
gmt plot data/ages.tsv -i0,6 -Sb6p+b0 -G#00549f
gmt subplot set 1
gmt basemap -R0/75/0/200 -JX? -Bpxa25+l"Age (years)" -Bpya100+lPeople -BWS+t"2nd"
gmt plot data/ages.tsv -i0,7 -Sb6p+b0 -G#00549f
gmt subplot set 2
gmt basemap -R0/75/0/200 -JX? -Bpxa25+l"Age (years)" -Bpya100+lPeople -BWS+t"3rd"
gmt plot data/ages.tsv -i0,8 -Sb6p+b0 -G#00549f
gmt subplot set 3
gmt basemap -R0/75/0/200 -JX? -Bpxa25+l"Age (years)" -Bpya100+lPeople -BWS+t"Crew"
gmt plot data/ages.tsv -i0,9 -Sb6p+b0 -G#00549f
gmt subplot end
# END EXAMPLE
gmt end
Native build log
Download: Source · Source + data ZIP · SVG · PDF · PNG
Example and command index