No matching examples. Try another query or clear the filters.
A visual reference · MetaPost
MetaPost, one change at a time
From a first path to computed geometry, scientific plots and styled illustrations.
Complete source. A small change. Its actual result.
The Org file is the canonical source. Read the HTML guide beside your work,
or download its PDF and source for offline reading.
Last changes: 2026-11-01. Added 18 drawing and styling examples: botanical and object illustrations, a coastal scene, an isometric house, stroke caps and joins, tapered ribbons, ink treatments, shadows, palette roles, road casings, hatching, halftones, guilloche, woven bands, wave tiles and circular lettering. The tour now has 102 reproducible examples in 17 chapters.
Read the drawing commands and expand the complete standalone program.
Actual vector figure
Compare native MetaPost output with its control points, geometry and data.
One change
Follow a comparison, download the source and reuse SVG, vector PDF or PNG output.
Read from the beginning or jump to a stable example ID. Each example includes
its complete input and captured result. Copy link preserves the address of the
guide you are reading, including its current domain and path.
The first chapters develop paths, geometric constraints and the picture
language. The complete programs define numlabel to round displayed numbers
to hundredths, keeping floating-point calculation separate from labels. Later chapters build data graphics from explicit calculations and
introduce the standard graph.mp library. The sixteen compositions in the pinned
ROOT MetaPost atlas supply the starting ideas; this tour develops them into
independent, explained examples and adds scientific plots. Chapters 15-17
return to illustration, stroke styles, textures, ornament and lettering. Start
there for drawing recipes and follow their comparisons back to the underlying
path, pen and clipping commands.
Every entry shows its focused drawing commands. Expand the complete program
or download the .mp source to see the shared white canvas, explicit RWTH colours,
output filename and visible example ID. Run a downloaded program with
mpost -numbersystem=double MPT-01-001.mp.
Coordinates normally grow rightwards and upwards. Trigonometric functions
sind, cosd and dir use degrees. The complete programs use native SVG output
with outlined font glyphs; their vector PDFs and PNG previews come from that
same vector figure. Each vector PDF also carries its complete .mp source.
Chapters 13 and 14 read the bundled synthetic files in data/. Download and
extract the source-and-data ZIP, keep its directory structure and run from the
extracted root. Their figure PDFs embed both source and declared inputs. The
guide PDF attaches an aggregate data-and-source archive for offline reproduction.
The atlas's sixteen showcase ideas are developed here with independent
complete programs, new coordinates, explanations and comparisons. The poster
builder is not imported. Source-to-atlas panel mappings are retained in the
Org properties and sources/atlas-provenance.json. All additional plotting
fixtures are small and synthetic. MetaPost and the TeX distribution remain
external dependencies; their executables, libraries and font files are not
redistributed as source code in this tour.
This is MetaPost, version 3.00 (TeX Live 2026) (kpathsea version 6.4.2)
(/usr/local/texlive/2026/texmf-dist/metapost/base/mpost.mp
(/usr/local/texlive/2026/texmf-dist/metapost/base/plain.mp
Preloading the plain mem file, version 1.005) ) (./MPT-01-001.mp [1{psfonts.map
}<cmr10.pfb><cmr8.pfb>] )
1 output file written: MPT-01-001.svg
Transcript written on MPT-01-001.log.
Command or parameter
Meaning
(x,y)
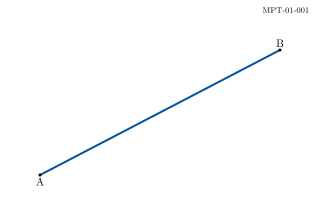
A coordinate pair places a point in the drawing plane.
--
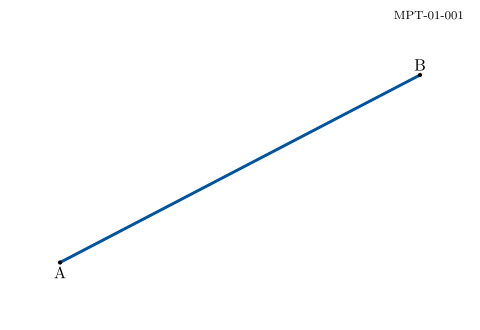
Join the two endpoints with a straight segment.
withpen
Choose the stroke independently of the geometry.
Complete standalone MetaPost program
prologues:=3;outputformat:="svg";defaultfont:="cmr10";defaultscale:=1.1;colorBlue,Teal,Orange,Green,Grey,Light,Wash;Blue:=(0,84/255,159/255);Teal:=(0,177/255,183/255);Orange:=(246/255,168/255,0);Green:=(87/255,171/255,39/255);Grey:=(100/255,101/255,103/255);Light:=(236/255,236/255,237/255);Wash:=(232/255,241/255,250/255);% Format displayed numbers to hundredths using integer strings.vardefnumlabel(exprvalue)=saven,whole,frac;numericn,whole,frac;n:=round(100absvalue);whole:=floor(n/100);frac:=nmod100;(ifvalue<-.005:"-" & fidecimalwholeiffrac>0: & "." & iffrac<10:"0" & fidecimalfracfi)enddef;pickuppencirclescaled.9;outputtemplate:="MPT-01-001.svg";beginfig(1);fillunitsquarexscaled320yscaled220withcolorwhite;% BEGIN DRAWINGdraw(40,45)--(280,170)withpenpencirclescaled2withcolorBlue;dotlabel.bot("A",(40,45));dotlabel.top("B",(280,170));% END DRAWINGlabel.lft("MPT-01-001"infont"cmr8",(312,210));setboundscurrentpicturetounitsquarexscaled320yscaled220;endfig;end.
This is MetaPost, version 3.00 (TeX Live 2026) (kpathsea version 6.4.2)
(/usr/local/texlive/2026/texmf-dist/metapost/base/mpost.mp
(/usr/local/texlive/2026/texmf-dist/metapost/base/plain.mp
Preloading the plain mem file, version 1.005) ) (./MPT-01-002.mp [1{psfonts.map
}<cmr10.pfb><cmr8.pfb>] )
1 output file written: MPT-01-002.svg
Transcript written on MPT-01-002.log.
Command or parameter
Meaning
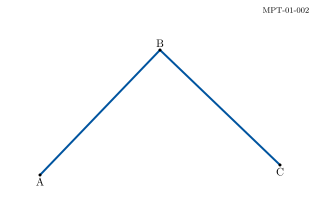
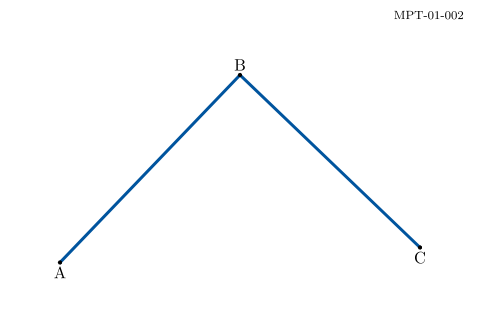
-- between three pairs
Two independent straight segments meet at the middle vertex.
dotlabel
Draw a dot and place its label on the requested side.
Complete standalone MetaPost program
prologues:=3;outputformat:="svg";defaultfont:="cmr10";defaultscale:=1.1;colorBlue,Teal,Orange,Green,Grey,Light,Wash;Blue:=(0,84/255,159/255);Teal:=(0,177/255,183/255);Orange:=(246/255,168/255,0);Green:=(87/255,171/255,39/255);Grey:=(100/255,101/255,103/255);Light:=(236/255,236/255,237/255);Wash:=(232/255,241/255,250/255);% Format displayed numbers to hundredths using integer strings.vardefnumlabel(exprvalue)=saven,whole,frac;numericn,whole,frac;n:=round(100absvalue);whole:=floor(n/100);frac:=nmod100;(ifvalue<-.005:"-" & fidecimalwholeiffrac>0: & "." & iffrac<10:"0" & fidecimalfracfi)enddef;pickuppencirclescaled.9;outputtemplate:="MPT-01-002.svg";beginfig(1);fillunitsquarexscaled320yscaled220withcolorwhite;% BEGIN DRAWINGdraw(40,45)--(160,170)--(280,55)withpenpencirclescaled2withcolorBlue;dotlabel.bot("A",(40,45));dotlabel.top("B",(160,170));dotlabel.bot("C",(280,55));% END DRAWINGlabel.lft("MPT-01-002"infont"cmr8",(312,210));setboundscurrentpicturetounitsquarexscaled320yscaled220;endfig;end.
This is MetaPost, version 3.00 (TeX Live 2026) (kpathsea version 6.4.2)
(/usr/local/texlive/2026/texmf-dist/metapost/base/mpost.mp
(/usr/local/texlive/2026/texmf-dist/metapost/base/plain.mp
Preloading the plain mem file, version 1.005) ) (./MPT-01-003.mp [1{psfonts.map
}<cmr8.pfb>] )
1 output file written: MPT-01-003.svg
Transcript written on MPT-01-003.log.
Command or parameter
Meaning
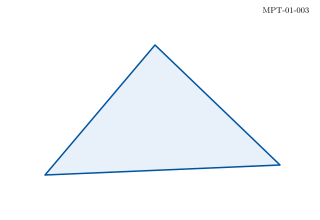
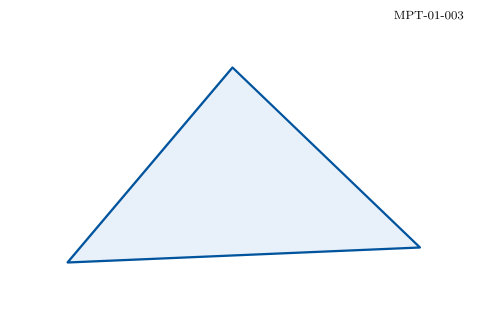
path p
Store geometry so that fill and draw use the same boundary.
cycle
Join the last vertex back to the first.
fill / draw
Fill the interior first, then draw the outline.
Complete standalone MetaPost program
prologues:=3;outputformat:="svg";defaultfont:="cmr10";defaultscale:=1.1;colorBlue,Teal,Orange,Green,Grey,Light,Wash;Blue:=(0,84/255,159/255);Teal:=(0,177/255,183/255);Orange:=(246/255,168/255,0);Green:=(87/255,171/255,39/255);Grey:=(100/255,101/255,103/255);Light:=(236/255,236/255,237/255);Wash:=(232/255,241/255,250/255);% Format displayed numbers to hundredths using integer strings.vardefnumlabel(exprvalue)=saven,whole,frac;numericn,whole,frac;n:=round(100absvalue);whole:=floor(n/100);frac:=nmod100;(ifvalue<-.005:"-" & fidecimalwholeiffrac>0: & "." & iffrac<10:"0" & fidecimalfracfi)enddef;pickuppencirclescaled.9;outputtemplate:="MPT-01-003.svg";beginfig(1);fillunitsquarexscaled320yscaled220withcolorwhite;% BEGIN DRAWINGpathp;p:=(45,45)--(155,175)--(280,55)--cycle;fillpwithcolorWash;drawpwithpenpencirclescaled1.5withcolorBlue;% END DRAWINGlabel.lft("MPT-01-003"infont"cmr8",(312,210));setboundscurrentpicturetounitsquarexscaled320yscaled220;endfig;end.
This is MetaPost, version 3.00 (TeX Live 2026) (kpathsea version 6.4.2)
(/usr/local/texlive/2026/texmf-dist/metapost/base/mpost.mp
(/usr/local/texlive/2026/texmf-dist/metapost/base/plain.mp
Preloading the plain mem file, version 1.005) ) (./MPT-01-004.mp [1{psfonts.map
}<cmr10.pfb><cmr8.pfb>] )
1 output file written: MPT-01-004.svg
Transcript written on MPT-01-004.log.
Command or parameter
Meaning
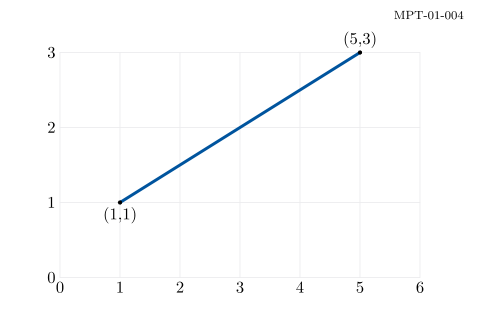
for ... upto
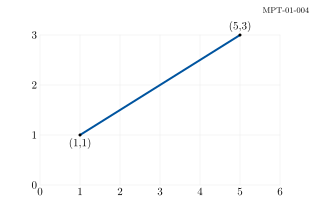
Generate reference lines from integer indices.
decimal
Convert a numeric value into a label string.
40+40i / 35+50j
Map logical coordinates onto a rectangular plotting area.
Complete standalone MetaPost program
prologues:=3;outputformat:="svg";defaultfont:="cmr10";defaultscale:=1.1;colorBlue,Teal,Orange,Green,Grey,Light,Wash;Blue:=(0,84/255,159/255);Teal:=(0,177/255,183/255);Orange:=(246/255,168/255,0);Green:=(87/255,171/255,39/255);Grey:=(100/255,101/255,103/255);Light:=(236/255,236/255,237/255);Wash:=(232/255,241/255,250/255);% Format displayed numbers to hundredths using integer strings.vardefnumlabel(exprvalue)=saven,whole,frac;numericn,whole,frac;n:=round(100absvalue);whole:=floor(n/100);frac:=nmod100;(ifvalue<-.005:"-" & fidecimalwholeiffrac>0: & "." & iffrac<10:"0" & fidecimalfracfi)enddef;pickuppencirclescaled.9;outputtemplate:="MPT-01-004.svg";beginfig(1);fillunitsquarexscaled320yscaled220withcolorwhite;% BEGIN DRAWINGfori=0upto6:draw(40+40i,35)--(40+40i,185)withcolorLight;label.bot(decimali,(40+40i,35));endforforj=0upto3:draw(40,35+50j)--(280,35+50j)withcolorLight;label.lft(decimalj,(40,35+50j));endfordraw(80,85)--(240,185)withpenpencirclescaled2withcolorBlue;dotlabel.bot("(1,1)",(80,85));dotlabel.top("(5,3)",(240,185));% END DRAWINGlabel.lft("MPT-01-004"infont"cmr8",(312,210));setboundscurrentpicturetounitsquarexscaled320yscaled220;endfig;end.
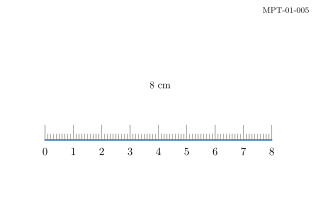
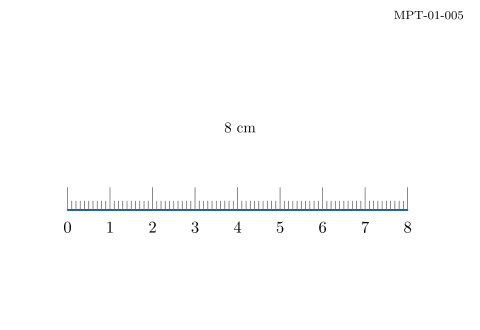
numericu;u:=cm;draw(45,80)--(45+8u,80)withpenpencirclescaled1.2withcolorBlue;fori=0upto80:draw(45+i*mm,80)--(45+i*mm,80+ifimod10=0:15else:6fi)withcolorGrey;ifimod10=0:label.bot(decimal(i/10),(45+i*mm,75));fiendforlabel(btex 8 cm etex,(160,135));
Actual output
MPT-01-005 · Rendered by MetaPost
MetaPost · exit 0
Native compiler log
Standard output
This is MetaPost, version 3.00 (TeX Live 2026) (kpathsea version 6.4.2)
(/usr/local/texlive/2026/texmf-dist/metapost/base/mpost.mp
(/usr/local/texlive/2026/texmf-dist/metapost/base/plain.mp
Preloading the plain mem file, version 1.005) ) (./MPT-01-005.mp [1{psfonts.map
}<cmr10.pfb><cmr8.pfb>] )
1 output file written: MPT-01-005.svg
Transcript written on MPT-01-005.log.
Command or parameter
Meaning
cm / mm
Use the unit constants rather than guessing a conversion.
mod
Choose longer marks at whole centimetres.
if ... else ... fi
Select a tick length without duplicating the drawing.
Complete standalone MetaPost program
prologues:=3;outputformat:="svg";defaultfont:="cmr10";defaultscale:=1.1;colorBlue,Teal,Orange,Green,Grey,Light,Wash;Blue:=(0,84/255,159/255);Teal:=(0,177/255,183/255);Orange:=(246/255,168/255,0);Green:=(87/255,171/255,39/255);Grey:=(100/255,101/255,103/255);Light:=(236/255,236/255,237/255);Wash:=(232/255,241/255,250/255);% Format displayed numbers to hundredths using integer strings.vardefnumlabel(exprvalue)=saven,whole,frac;numericn,whole,frac;n:=round(100absvalue);whole:=floor(n/100);frac:=nmod100;(ifvalue<-.005:"-" & fidecimalwholeiffrac>0: & "." & iffrac<10:"0" & fidecimalfracfi)enddef;pickuppencirclescaled.9;outputtemplate:="MPT-01-005.svg";beginfig(1);fillunitsquarexscaled320yscaled220withcolorwhite;% BEGIN DRAWINGnumericu;u:=cm;draw(45,80)--(45+8u,80)withpenpencirclescaled1.2withcolorBlue;fori=0upto80:draw(45+i*mm,80)--(45+i*mm,80+ifimod10=0:15else:6fi)withcolorGrey;ifimod10=0:label.bot(decimal(i/10),(45+i*mm,75));fiendforlabel(btex 8 cm etex,(160,135));% END DRAWINGlabel.lft("MPT-01-005"infont"cmr8",(312,210));setboundscurrentpicturetounitsquarexscaled320yscaled220;endfig;end.
This is MetaPost, version 3.00 (TeX Live 2026) (kpathsea version 6.4.2)
(/usr/local/texlive/2026/texmf-dist/metapost/base/mpost.mp
(/usr/local/texlive/2026/texmf-dist/metapost/base/plain.mp
Preloading the plain mem file, version 1.005) ) (./MPT-01-006.mp [1{psfonts.map
}<cmr10.pfb><cmr8.pfb>] )
1 output file written: MPT-01-006.svg
Transcript written on MPT-01-006.log.
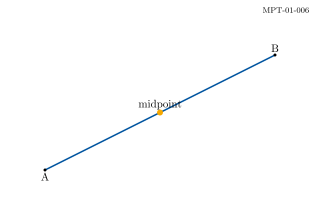
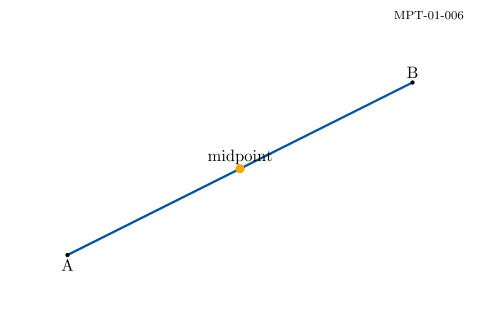
Command or parameter
Meaning
pair
A two-dimensional vector or position.
.5[a,b]
Compute the midpoint with linear interpolation.
shifted m
Move a circle centred at the origin onto the calculated point.
Complete standalone MetaPost program
prologues:=3;outputformat:="svg";defaultfont:="cmr10";defaultscale:=1.1;colorBlue,Teal,Orange,Green,Grey,Light,Wash;Blue:=(0,84/255,159/255);Teal:=(0,177/255,183/255);Orange:=(246/255,168/255,0);Green:=(87/255,171/255,39/255);Grey:=(100/255,101/255,103/255);Light:=(236/255,236/255,237/255);Wash:=(232/255,241/255,250/255);% Format displayed numbers to hundredths using integer strings.vardefnumlabel(exprvalue)=saven,whole,frac;numericn,whole,frac;n:=round(100absvalue);whole:=floor(n/100);frac:=nmod100;(ifvalue<-.005:"-" & fidecimalwholeiffrac>0: & "." & iffrac<10:"0" & fidecimalfracfi)enddef;pickuppencirclescaled.9;outputtemplate:="MPT-01-006.svg";beginfig(1);fillunitsquarexscaled320yscaled220withcolorwhite;% BEGIN DRAWINGpaira,b,m;a:=(45,50);b:=(275,165);m:=.5[a,b];drawa--bwithpenpencirclescaled1.5withcolorBlue;dotlabel.bot("A",a);dotlabel.top("B",b);fillfullcirclescaled6shiftedmwithcolorOrange;label.top("midpoint",m);% END DRAWINGlabel.lft("MPT-01-006"infont"cmr8",(312,210));setboundscurrentpicturetounitsquarexscaled320yscaled220;endfig;end.
This is MetaPost, version 3.00 (TeX Live 2026) (kpathsea version 6.4.2)
(/usr/local/texlive/2026/texmf-dist/metapost/base/mpost.mp
(/usr/local/texlive/2026/texmf-dist/metapost/base/plain.mp
Preloading the plain mem file, version 1.005) ) (./MPT-02-001.mp [1{psfonts.map
}<cmr8.pfb>] )
1 output file written: MPT-02-001.svg
Transcript written on MPT-02-001.log.
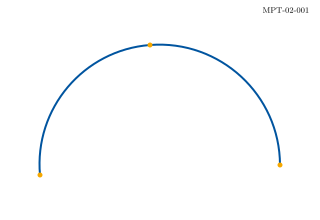
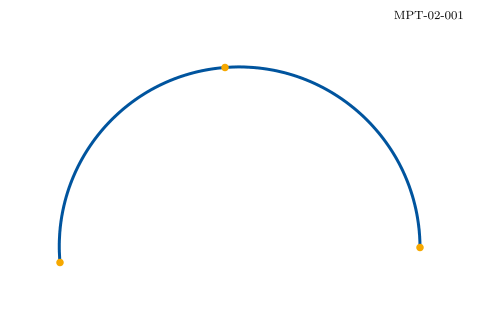
Command or parameter
Meaning
..
Ask for a smooth cubic path through the knots.
Knots
The orange dots are interpolation points, not control handles.
Complete standalone MetaPost program
prologues:=3;outputformat:="svg";defaultfont:="cmr10";defaultscale:=1.1;colorBlue,Teal,Orange,Green,Grey,Light,Wash;Blue:=(0,84/255,159/255);Teal:=(0,177/255,183/255);Orange:=(246/255,168/255,0);Green:=(87/255,171/255,39/255);Grey:=(100/255,101/255,103/255);Light:=(236/255,236/255,237/255);Wash:=(232/255,241/255,250/255);% Format displayed numbers to hundredths using integer strings.vardefnumlabel(exprvalue)=saven,whole,frac;numericn,whole,frac;n:=round(100absvalue);whole:=floor(n/100);frac:=nmod100;(ifvalue<-.005:"-" & fidecimalwholeiffrac>0: & "." & iffrac<10:"0" & fidecimalfracfi)enddef;pickuppencirclescaled.9;outputtemplate:="MPT-02-001.svg";beginfig(1);fillunitsquarexscaled320yscaled220withcolorwhite;% BEGIN DRAWINGdraw(40,45)..(150,175)..(280,55)withpenpencirclescaled2withcolorBlue;forp=(40,45),(150,175),(280,55):fillfullcirclescaled5shiftedpwithcolorOrange;endfor% END DRAWINGlabel.lft("MPT-02-001"infont"cmr8",(312,210));setboundscurrentpicturetounitsquarexscaled320yscaled220;endfig;end.
This is MetaPost, version 3.00 (TeX Live 2026) (kpathsea version 6.4.2)
(/usr/local/texlive/2026/texmf-dist/metapost/base/mpost.mp
(/usr/local/texlive/2026/texmf-dist/metapost/base/plain.mp
Preloading the plain mem file, version 1.005) ) (./MPT-02-002.mp [1{psfonts.map
}<cmr8.pfb>] )
1 output file written: MPT-02-002.svg
Transcript written on MPT-02-002.log.
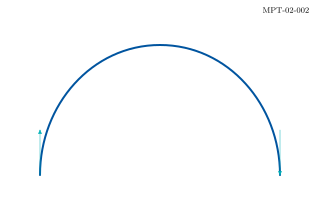
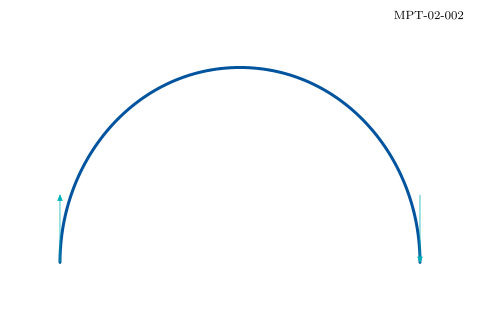
Command or parameter
Meaning
{up} / {down}
Constrain the tangent direction at the adjacent endpoint.
drawarrow
Make the prescribed directions visible.
Complete standalone MetaPost program
prologues:=3;outputformat:="svg";defaultfont:="cmr10";defaultscale:=1.1;colorBlue,Teal,Orange,Green,Grey,Light,Wash;Blue:=(0,84/255,159/255);Teal:=(0,177/255,183/255);Orange:=(246/255,168/255,0);Green:=(87/255,171/255,39/255);Grey:=(100/255,101/255,103/255);Light:=(236/255,236/255,237/255);Wash:=(232/255,241/255,250/255);% Format displayed numbers to hundredths using integer strings.vardefnumlabel(exprvalue)=saven,whole,frac;numericn,whole,frac;n:=round(100absvalue);whole:=floor(n/100);frac:=nmod100;(ifvalue<-.005:"-" & fidecimalwholeiffrac>0: & "." & iffrac<10:"0" & fidecimalfracfi)enddef;pickuppencirclescaled.9;outputtemplate:="MPT-02-002.svg";beginfig(1);fillunitsquarexscaled320yscaled220withcolorwhite;% BEGIN DRAWINGdraw(40,45){up}..(160,175)..{down}(280,45)withpenpencirclescaled2withcolorBlue;drawarrow(40,45)--(40,90)withcolorTeal;drawarrow(280,90)--(280,45)withcolorTeal;% END DRAWINGlabel.lft("MPT-02-002"infont"cmr8",(312,210));setboundscurrentpicturetounitsquarexscaled320yscaled220;endfig;end.
This is MetaPost, version 3.00 (TeX Live 2026) (kpathsea version 6.4.2)
(/usr/local/texlive/2026/texmf-dist/metapost/base/mpost.mp
(/usr/local/texlive/2026/texmf-dist/metapost/base/plain.mp
Preloading the plain mem file, version 1.005) ) (./MPT-02-003.mp [1{psfonts.map
}<cmr10.pfb><cmr8.pfb>] )
1 output file written: MPT-02-003.svg
Transcript written on MPT-02-003.log.
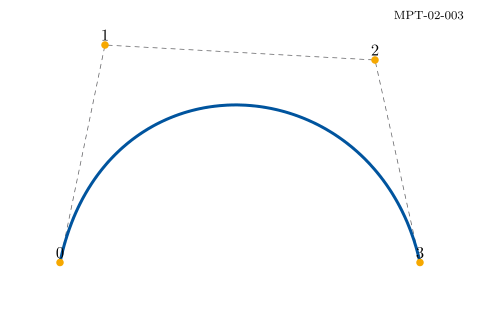
Command or parameter
Meaning
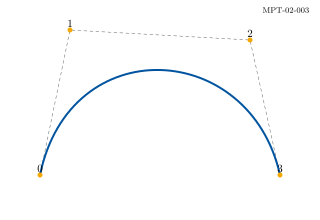
controls z1 and z2
Specify both Bezier controls instead of letting MetaPost choose them.
z[i]
The standard paired-coordinate notation also supports indexed points.
Complete standalone MetaPost program
prologues:=3;outputformat:="svg";defaultfont:="cmr10";defaultscale:=1.1;colorBlue,Teal,Orange,Green,Grey,Light,Wash;Blue:=(0,84/255,159/255);Teal:=(0,177/255,183/255);Orange:=(246/255,168/255,0);Green:=(87/255,171/255,39/255);Grey:=(100/255,101/255,103/255);Light:=(236/255,236/255,237/255);Wash:=(232/255,241/255,250/255);% Format displayed numbers to hundredths using integer strings.vardefnumlabel(exprvalue)=saven,whole,frac;numericn,whole,frac;n:=round(100absvalue);whole:=floor(n/100);frac:=nmod100;(ifvalue<-.005:"-" & fidecimalwholeiffrac>0: & "." & iffrac<10:"0" & fidecimalfracfi)enddef;pickuppencirclescaled.9;outputtemplate:="MPT-02-003.svg";beginfig(1);fillunitsquarexscaled320yscaled220withcolorwhite;% BEGIN DRAWINGz0=(40,45);z1=(70,190);z2=(250,180);z3=(280,45);drawz0--z1--z2--z3dashedevenlywithcolorGrey;drawz0..controlsz1andz2..z3withpenpencirclescaled2withcolorBlue;fori=0upto3:fillfullcirclescaled5shiftedz[i]withcolorOrange;label.top(decimali,z[i]);endfor% END DRAWINGlabel.lft("MPT-02-003"infont"cmr8",(312,210));setboundscurrentpicturetounitsquarexscaled320yscaled220;endfig;end.
This is MetaPost, version 3.00 (TeX Live 2026) (kpathsea version 6.4.2)
(/usr/local/texlive/2026/texmf-dist/metapost/base/mpost.mp
(/usr/local/texlive/2026/texmf-dist/metapost/base/plain.mp
Preloading the plain mem file, version 1.005) ) (./MPT-02-004.mp [1{psfonts.map
}<cmr10.pfb><cmr8.pfb>] )
1 output file written: MPT-02-004.svg
Transcript written on MPT-02-004.log.
Command or parameter
Meaning
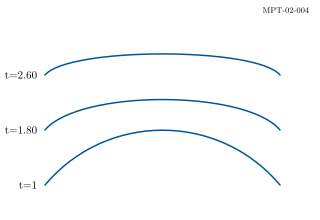
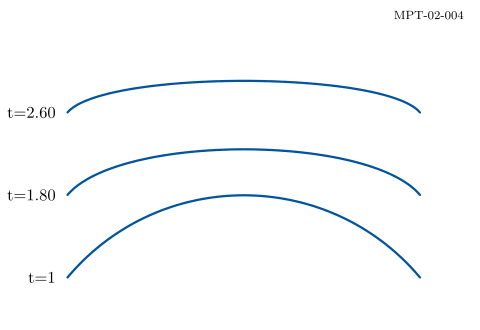
tension
Control how tightly the interpolating segment approaches its chord.
dir angle
Create a direction vector from an angle in degrees.
Same endpoints
Only tension changes within each translated row.
Complete standalone MetaPost program
prologues:=3;outputformat:="svg";defaultfont:="cmr10";defaultscale:=1.1;colorBlue,Teal,Orange,Green,Grey,Light,Wash;Blue:=(0,84/255,159/255);Teal:=(0,177/255,183/255);Orange:=(246/255,168/255,0);Green:=(87/255,171/255,39/255);Grey:=(100/255,101/255,103/255);Light:=(236/255,236/255,237/255);Wash:=(232/255,241/255,250/255);% Format displayed numbers to hundredths using integer strings.vardefnumlabel(exprvalue)=saven,whole,frac;numericn,whole,frac;n:=round(100absvalue);whole:=floor(n/100);frac:=nmod100;(ifvalue<-.005:"-" & fidecimalwholeiffrac>0: & "." & iffrac<10:"0" & fidecimalfracfi)enddef;pickuppencirclescaled.9;outputtemplate:="MPT-02-004.svg";beginfig(1);fillunitsquarexscaled320yscaled220withcolorwhite;% BEGIN DRAWINGfork=0upto2:draw(45,35+55k){dir50}..tension(1+.8k)..{dir-50}(280,35+55k)withpenpencirclescaled1.5withcolorBlue;label.lft("t="&numlabel(1+.8k),(40,35+55k));endfor% END DRAWINGlabel.lft("MPT-02-004"infont"cmr8",(312,210));setboundscurrentpicturetounitsquarexscaled320yscaled220;endfig;end.
This is MetaPost, version 3.00 (TeX Live 2026) (kpathsea version 6.4.2)
(/usr/local/texlive/2026/texmf-dist/metapost/base/mpost.mp
(/usr/local/texlive/2026/texmf-dist/metapost/base/plain.mp
Preloading the plain mem file, version 1.005) ) (./MPT-02-005.mp [1{psfonts.map
}<cmr8.pfb>] )
1 output file written: MPT-02-005.svg
Transcript written on MPT-02-005.log.
Command or parameter
Meaning
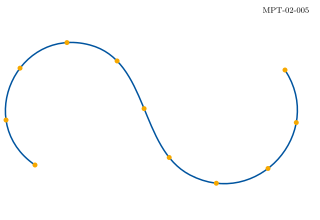
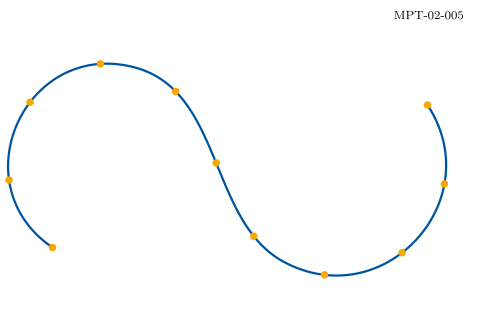
arclength p
Measure the length of the entire path.
arctime ... of p
Find the path time at the requested distance.
point t of p
Evaluate the path at that time.
Complete standalone MetaPost program
prologues:=3;outputformat:="svg";defaultfont:="cmr10";defaultscale:=1.1;colorBlue,Teal,Orange,Green,Grey,Light,Wash;Blue:=(0,84/255,159/255);Teal:=(0,177/255,183/255);Orange:=(246/255,168/255,0);Green:=(87/255,171/255,39/255);Grey:=(100/255,101/255,103/255);Light:=(236/255,236/255,237/255);Wash:=(232/255,241/255,250/255);% Format displayed numbers to hundredths using integer strings.vardefnumlabel(exprvalue)=saven,whole,frac;numericn,whole,frac;n:=round(100absvalue);whole:=floor(n/100);frac:=nmod100;(ifvalue<-.005:"-" & fidecimalwholeiffrac>0: & "." & iffrac<10:"0" & fidecimalfracfi)enddef;pickuppencirclescaled.9;outputtemplate:="MPT-02-005.svg";beginfig(1);fillunitsquarexscaled320yscaled220withcolorwhite;% BEGIN DRAWINGpathp;numerict;p:=(35,55)..(90,175)..(190,45)..(285,150);drawpwithpenpencirclescaled1.5withcolorBlue;fork=0upto10:t:=arctime(k*arclengthp/10)ofp;fillfullcirclescaled5shifted(pointtofp)withcolorOrange;endfor% END DRAWINGlabel.lft("MPT-02-005"infont"cmr8",(312,210));setboundscurrentpicturetounitsquarexscaled320yscaled220;endfig;end.
This is MetaPost, version 3.00 (TeX Live 2026) (kpathsea version 6.4.2)
(/usr/local/texlive/2026/texmf-dist/metapost/base/mpost.mp
(/usr/local/texlive/2026/texmf-dist/metapost/base/plain.mp
Preloading the plain mem file, version 1.005) ) (./MPT-02-006.mp [1{psfonts.map
}<cmr8.pfb>] )
1 output file written: MPT-02-006.svg
Transcript written on MPT-02-006.log.
Command or parameter
Meaning
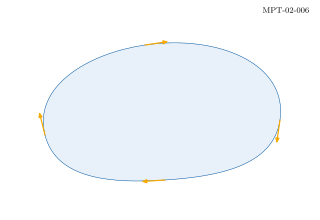
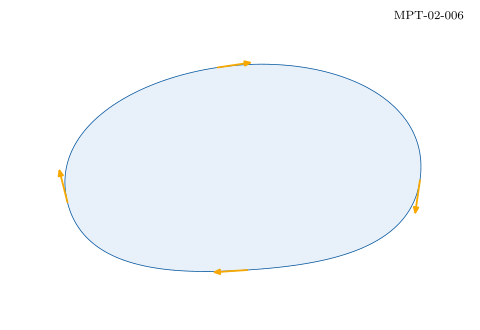
..cycle
Close the curve smoothly.
direction
Obtain a tangent vector at a path time.
unitvector
Normalize a nonzero direction before choosing arrow length.
Complete standalone MetaPost program
prologues:=3;outputformat:="svg";defaultfont:="cmr10";defaultscale:=1.1;colorBlue,Teal,Orange,Green,Grey,Light,Wash;Blue:=(0,84/255,159/255);Teal:=(0,177/255,183/255);Orange:=(246/255,168/255,0);Green:=(87/255,171/255,39/255);Grey:=(100/255,101/255,103/255);Light:=(236/255,236/255,237/255);Wash:=(232/255,241/255,250/255);% Format displayed numbers to hundredths using integer strings.vardefnumlabel(exprvalue)=saven,whole,frac;numericn,whole,frac;n:=round(100absvalue);whole:=floor(n/100);frac:=nmod100;(ifvalue<-.005:"-" & fidecimalwholeiffrac>0: & "." & iffrac<10:"0" & fidecimalfracfi)enddef;pickuppencirclescaled.9;outputtemplate:="MPT-02-006.svg";beginfig(1);fillunitsquarexscaled320yscaled220withcolorwhite;% BEGIN DRAWINGpathp;paira,t;p:=(45,85)..(145,175)..(280,100)..(165,40)..cycle;fillpwithcolorWash;drawpwithcolorBlue;fork=0uptolengthp-1:a:=pointkofp;t:=unitvector(directionkofp);drawarrowa--(a+22t)withpenpencirclescaled1.2withcolorOrange;endfor% END DRAWINGlabel.lft("MPT-02-006"infont"cmr8",(312,210));setboundscurrentpicturetounitsquarexscaled320yscaled220;endfig;end.
This is MetaPost, version 3.00 (TeX Live 2026) (kpathsea version 6.4.2)
(/usr/local/texlive/2026/texmf-dist/metapost/base/mpost.mp
(/usr/local/texlive/2026/texmf-dist/metapost/base/plain.mp
Preloading the plain mem file, version 1.005) ) (./MPT-03-001.mp [1{psfonts.map
}<cmr10.pfb><cmr8.pfb>] )
1 output file written: MPT-03-001.svg
Transcript written on MPT-03-001.log.
Command or parameter
Meaning
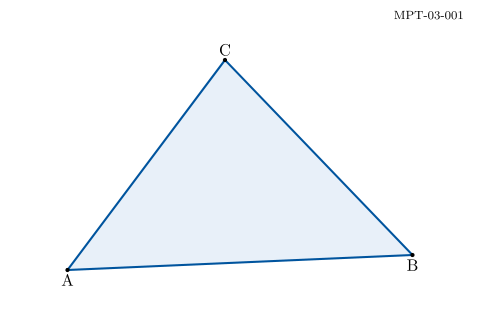
State a relationship for the linear equation solver.
z1-z0
A vector displacement can determine both coordinates.
Complete standalone MetaPost program
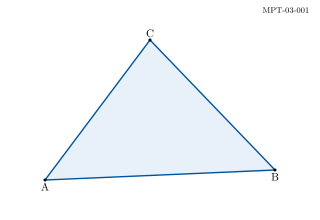
prologues:=3;outputformat:="svg";defaultfont:="cmr10";defaultscale:=1.1;colorBlue,Teal,Orange,Green,Grey,Light,Wash;Blue:=(0,84/255,159/255);Teal:=(0,177/255,183/255);Orange:=(246/255,168/255,0);Green:=(87/255,171/255,39/255);Grey:=(100/255,101/255,103/255);Light:=(236/255,236/255,237/255);Wash:=(232/255,241/255,250/255);% Format displayed numbers to hundredths using integer strings.vardefnumlabel(exprvalue)=saven,whole,frac;numericn,whole,frac;n:=round(100absvalue);whole:=floor(n/100);frac:=nmod100;(ifvalue<-.005:"-" & fidecimalwholeiffrac>0: & "." & iffrac<10:"0" & fidecimalfracfi)enddef;pickuppencirclescaled.9;outputtemplate:="MPT-03-001.svg";beginfig(1);fillunitsquarexscaled320yscaled220withcolorwhite;% BEGIN DRAWINGz0=(45,40);z1-z0=(230,10);z2-z0=(105,140);fillz0--z1--z2--cyclewithcolorWash;drawz0--z1--z2--cyclewithpenpencirclescaled1.4withcolorBlue;dotlabel.bot("A",z0);dotlabel.bot("B",z1);dotlabel.top("C",z2);% END DRAWINGlabel.lft("MPT-03-001"infont"cmr8",(312,210));setboundscurrentpicturetounitsquarexscaled320yscaled220;endfig;end.
This is MetaPost, version 3.00 (TeX Live 2026) (kpathsea version 6.4.2)
(/usr/local/texlive/2026/texmf-dist/metapost/base/mpost.mp
(/usr/local/texlive/2026/texmf-dist/metapost/base/plain.mp
Preloading the plain mem file, version 1.005) ) (./MPT-03-002.mp [1{psfonts.map
}<cmr8.pfb>] )
1 output file written: MPT-03-002.svg
Transcript written on MPT-03-002.log.
Command or parameter
Meaning
.5[...]
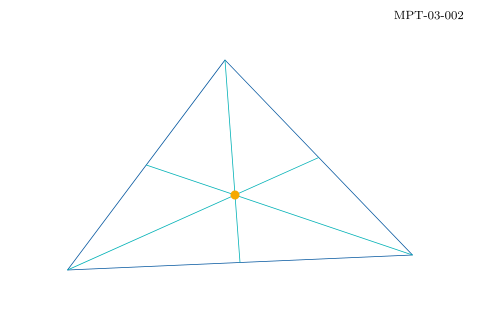
Compute the opposite side midpoints.
(z0+z1+z2)/3
Compute the centroid from the three vertices.
Complete standalone MetaPost program
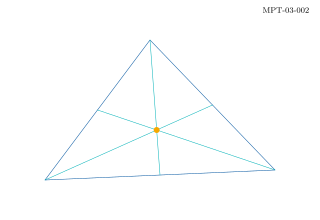
prologues:=3;outputformat:="svg";defaultfont:="cmr10";defaultscale:=1.1;colorBlue,Teal,Orange,Green,Grey,Light,Wash;Blue:=(0,84/255,159/255);Teal:=(0,177/255,183/255);Orange:=(246/255,168/255,0);Green:=(87/255,171/255,39/255);Grey:=(100/255,101/255,103/255);Light:=(236/255,236/255,237/255);Wash:=(232/255,241/255,250/255);% Format displayed numbers to hundredths using integer strings.vardefnumlabel(exprvalue)=saven,whole,frac;numericn,whole,frac;n:=round(100absvalue);whole:=floor(n/100);frac:=nmod100;(ifvalue<-.005:"-" & fidecimalwholeiffrac>0: & "." & iffrac<10:"0" & fidecimalfracfi)enddef;pickuppencirclescaled.9;outputtemplate:="MPT-03-002.svg";beginfig(1);fillunitsquarexscaled320yscaled220withcolorwhite;% BEGIN DRAWINGz0=(45,40);z1=(275,50);z2=(150,180);z3=.5[z0,z1];z4=.5[z1,z2];z5=.5[z2,z0];drawz0--z1--z2--cyclewithcolorBlue;drawz0--z4withcolorTeal;drawz1--z5withcolorTeal;drawz2--z3withcolorTeal;fillfullcirclescaled6shifted((z0+z1+z2)/3)withcolorOrange;% END DRAWINGlabel.lft("MPT-03-002"infont"cmr8",(312,210));setboundscurrentpicturetounitsquarexscaled320yscaled220;endfig;end.
This is MetaPost, version 3.00 (TeX Live 2026) (kpathsea version 6.4.2)
(/usr/local/texlive/2026/texmf-dist/metapost/base/mpost.mp
(/usr/local/texlive/2026/texmf-dist/metapost/base/plain.mp
Preloading the plain mem file, version 1.005) ) (./MPT-03-003.mp [1{psfonts.map
}<cmr8.pfb>] )
1 output file written: MPT-03-003.svg
Transcript written on MPT-03-003.log.
Command or parameter
Meaning
intersectionpoint
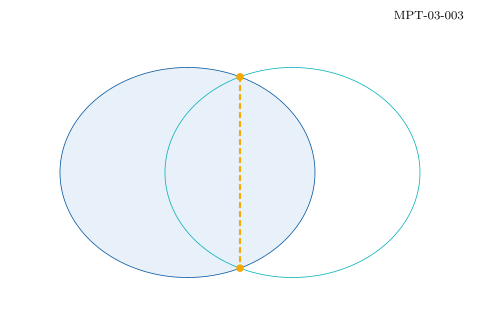
Find a point common to the two paths.
reverse
Change path traversal order to select the other crossing.
Complete standalone MetaPost program
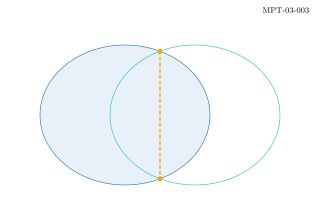
prologues:=3;outputformat:="svg";defaultfont:="cmr10";defaultscale:=1.1;colorBlue,Teal,Orange,Green,Grey,Light,Wash;Blue:=(0,84/255,159/255);Teal:=(0,177/255,183/255);Orange:=(246/255,168/255,0);Green:=(87/255,171/255,39/255);Grey:=(100/255,101/255,103/255);Light:=(236/255,236/255,237/255);Wash:=(232/255,241/255,250/255);% Format displayed numbers to hundredths using integer strings.vardefnumlabel(exprvalue)=saven,whole,frac;numericn,whole,frac;n:=round(100absvalue);whole:=floor(n/100);frac:=nmod100;(ifvalue<-.005:"-" & fidecimalwholeiffrac>0: & "." & iffrac<10:"0" & fidecimalfracfi)enddef;pickuppencirclescaled.9;outputtemplate:="MPT-03-003.svg";beginfig(1);fillunitsquarexscaled320yscaled220withcolorwhite;% BEGIN DRAWINGpatha,b;pairp,q;a:=fullcirclexscaled170yscaled140shifted(125,105);b:=fullcirclexscaled170yscaled140shifted(195,105);p:=aintersectionpointb;q:=(reversea)intersectionpointb;fillawithcolorWash;drawawithcolorBlue;drawbwithcolorTeal;drawp--qdashedevenlywithpenpencirclescaled1.4withcolorOrange;fillfullcirclescaled5shiftedpwithcolorOrange;fillfullcirclescaled5shiftedqwithcolorOrange;% END DRAWINGlabel.lft("MPT-03-003"infont"cmr8",(312,210));setboundscurrentpicturetounitsquarexscaled320yscaled220;endfig;end.
This is MetaPost, version 3.00 (TeX Live 2026) (kpathsea version 6.4.2)
(/usr/local/texlive/2026/texmf-dist/metapost/base/mpost.mp
(/usr/local/texlive/2026/texmf-dist/metapost/base/plain.mp
Preloading the plain mem file, version 1.005) ) (./MPT-03-004.mp [1{psfonts.map
}<cmr10.pfb><cmr8.pfb>] )
1 output file written: MPT-03-004.svg
Transcript written on MPT-03-004.log.
Command or parameter
Meaning
whatever
Introduce an independent unknown scalar in each equation.
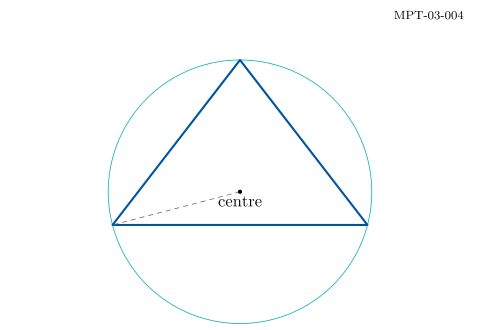
rotated 90
A perpendicular direction to a side.
abs(o-a)
The distance from the solved centre to a vertex.
Complete standalone MetaPost program
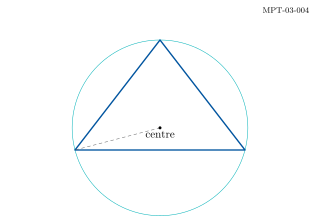
prologues:=3;outputformat:="svg";defaultfont:="cmr10";defaultscale:=1.1;colorBlue,Teal,Orange,Green,Grey,Light,Wash;Blue:=(0,84/255,159/255);Teal:=(0,177/255,183/255);Orange:=(246/255,168/255,0);Green:=(87/255,171/255,39/255);Grey:=(100/255,101/255,103/255);Light:=(236/255,236/255,237/255);Wash:=(232/255,241/255,250/255);% Format displayed numbers to hundredths using integer strings.vardefnumlabel(exprvalue)=saven,whole,frac;numericn,whole,frac;n:=round(100absvalue);whole:=floor(n/100);frac:=nmod100;(ifvalue<-.005:"-" & fidecimalwholeiffrac>0: & "." & iffrac<10:"0" & fidecimalfracfi)enddef;pickuppencirclescaled.9;outputtemplate:="MPT-03-004.svg";beginfig(1);fillunitsquarexscaled320yscaled220withcolorwhite;% BEGIN DRAWINGpaira,b,c,o;a:=(75,70);b:=(245,70);c:=(160,180);o=.5[a,b]+whatever*((b-a)rotated90);o=.5[a,c]+whatever*((c-a)rotated90);drawfullcirclescaled(2*abs(o-a))shiftedowithcolorTeal;drawa--b--c--cyclewithpenpencirclescaled1.4withcolorBlue;drawo--adashedevenlywithcolorGrey;dotlabel.bot("centre",o);% END DRAWINGlabel.lft("MPT-03-004"infont"cmr8",(312,210));setboundscurrentpicturetounitsquarexscaled320yscaled220;endfig;end.
This is MetaPost, version 3.00 (TeX Live 2026) (kpathsea version 6.4.2)
(/usr/local/texlive/2026/texmf-dist/metapost/base/mpost.mp
(/usr/local/texlive/2026/texmf-dist/metapost/base/plain.mp
Preloading the plain mem file, version 1.005) ) (./MPT-03-005.mp [1{psfonts.map
}<cmr10.pfb><cmr8.pfb>] )
1 output file written: MPT-03-005.svg
Transcript written on MPT-03-005.log.
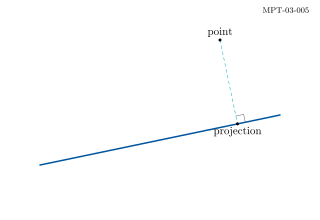
Command or parameter
Meaning
Two pair equations
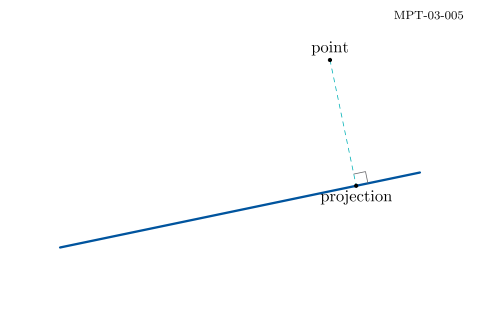
Constrain the foot to the line and its displacement to the normal.
unitvector
Build an eight-unit right-angle marker independent of line length.
Complete standalone MetaPost program
prologues:=3;outputformat:="svg";defaultfont:="cmr10";defaultscale:=1.1;colorBlue,Teal,Orange,Green,Grey,Light,Wash;Blue:=(0,84/255,159/255);Teal:=(0,177/255,183/255);Orange:=(246/255,168/255,0);Green:=(87/255,171/255,39/255);Grey:=(100/255,101/255,103/255);Light:=(236/255,236/255,237/255);Wash:=(232/255,241/255,250/255);% Format displayed numbers to hundredths using integer strings.vardefnumlabel(exprvalue)=saven,whole,frac;numericn,whole,frac;n:=round(100absvalue);whole:=floor(n/100);frac:=nmod100;(ifvalue<-.005:"-" & fidecimalwholeiffrac>0: & "." & iffrac<10:"0" & fidecimalfracfi)enddef;pickuppencirclescaled.9;outputtemplate:="MPT-03-005.svg";beginfig(1);fillunitsquarexscaled320yscaled220withcolorwhite;% BEGIN DRAWINGpaira,b,p,foot,u,v;a:=(40,55);b:=(280,105);p:=(220,180);foot=a+whatever*(b-a);p-foot=whatever*((b-a)rotated90);drawa--bwithpenpencirclescaled1.5withcolorBlue;drawp--footdashedevenlywithcolorTeal;u:=8*unitvector(b-a);v:=8*unitvector(p-foot);draw(foot+u)--(foot+u+v)--(foot+v)withcolorGrey;dotlabel.top("point",p);dotlabel.bot("projection",foot);% END DRAWINGlabel.lft("MPT-03-005"infont"cmr8",(312,210));setboundscurrentpicturetounitsquarexscaled320yscaled220;endfig;end.
This is MetaPost, version 3.00 (TeX Live 2026) (kpathsea version 6.4.2)
(/usr/local/texlive/2026/texmf-dist/metapost/base/mpost.mp
(/usr/local/texlive/2026/texmf-dist/metapost/base/plain.mp
Preloading the plain mem file, version 1.005) ) (./MPT-03-006.mp [1{psfonts.map
}<cmr10.pfb><cmr8.pfb>] )
1 output file written: MPT-03-006.svg
Transcript written on MPT-03-006.log.
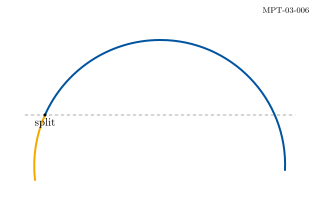
Command or parameter
Meaning
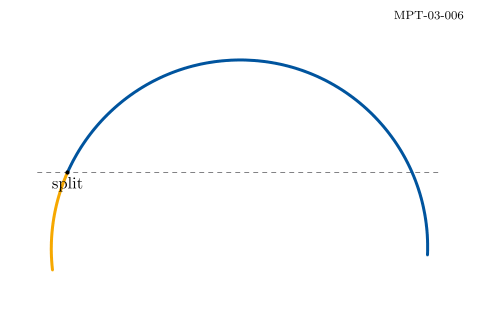
intersectiontimes
Return the two traversal parameters at a crossing.
subpath
Extract a part of the original curve without fitting a replacement.
Complete standalone MetaPost program
prologues:=3;outputformat:="svg";defaultfont:="cmr10";defaultscale:=1.1;colorBlue,Teal,Orange,Green,Grey,Light,Wash;Blue:=(0,84/255,159/255);Teal:=(0,177/255,183/255);Orange:=(246/255,168/255,0);Green:=(87/255,171/255,39/255);Grey:=(100/255,101/255,103/255);Light:=(236/255,236/255,237/255);Wash:=(232/255,241/255,250/255);% Format displayed numbers to hundredths using integer strings.vardefnumlabel(exprvalue)=saven,whole,frac;numericn,whole,frac;n:=round(100absvalue);whole:=floor(n/100);frac:=nmod100;(ifvalue<-.005:"-" & fidecimalwholeiffrac>0: & "." & iffrac<10:"0" & fidecimalfracfi)enddef;pickuppencirclescaled.9;outputtemplate:="MPT-03-006.svg";beginfig(1);fillunitsquarexscaled320yscaled220withcolorwhite;% BEGIN DRAWINGpathp,line;pairtimes,q;p:=(35,40)..(160,180)..(285,50);line:=(25,105)--(295,105);times:=pintersectiontimesline;drawlinedashedevenlywithcolorGrey;drawsubpath(0,xparttimes)ofpwithpenpencirclescaled2withcolorOrange;drawsubpath(xparttimes,lengthp)ofpwithpenpencirclescaled2withcolorBlue;q:=point(xparttimes)ofp;dotlabel.bot("split",q);% END DRAWINGlabel.lft("MPT-03-006"infont"cmr8",(312,210));setboundscurrentpicturetounitsquarexscaled320yscaled220;endfig;end.
This is MetaPost, version 3.00 (TeX Live 2026) (kpathsea version 6.4.2)
(/usr/local/texlive/2026/texmf-dist/metapost/base/mpost.mp
(/usr/local/texlive/2026/texmf-dist/metapost/base/plain.mp
Preloading the plain mem file, version 1.005) ) (./MPT-04-001.mp [1{psfonts.map
}<cmr8.pfb>] )
1 output file written: MPT-04-001.svg
Transcript written on MPT-04-001.log.
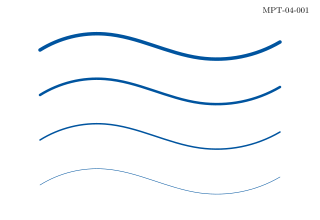
Command or parameter
Meaning
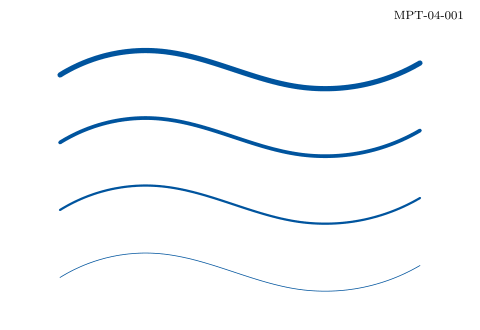
pencircle scaled w
Choose a round pen of width w.
shifted
Translate copies without changing their geometry.
Complete standalone MetaPost program
prologues:=3;outputformat:="svg";defaultfont:="cmr10";defaultscale:=1.1;colorBlue,Teal,Orange,Green,Grey,Light,Wash;Blue:=(0,84/255,159/255);Teal:=(0,177/255,183/255);Orange:=(246/255,168/255,0);Green:=(87/255,171/255,39/255);Grey:=(100/255,101/255,103/255);Light:=(236/255,236/255,237/255);Wash:=(232/255,241/255,250/255);% Format displayed numbers to hundredths using integer strings.vardefnumlabel(exprvalue)=saven,whole,frac;numericn,whole,frac;n:=round(100absvalue);whole:=floor(n/100);frac:=nmod100;(ifvalue<-.005:"-" & fidecimalwholeiffrac>0: & "." & iffrac<10:"0" & fidecimalfracfi)enddef;pickuppencirclescaled.9;outputtemplate:="MPT-04-001.svg";beginfig(1);fillunitsquarexscaled320yscaled220withcolorwhite;% BEGIN DRAWINGpathp;p:=(40,0)..(105,16)..(200,-8)..(280,8);fork=0upto3:drawpshifted(0,35+45k)withpenpencirclescaled(.5+k)withcolorBlue;endfor% END DRAWINGlabel.lft("MPT-04-001"infont"cmr8",(312,210));setboundscurrentpicturetounitsquarexscaled320yscaled220;endfig;end.
This is MetaPost, version 3.00 (TeX Live 2026) (kpathsea version 6.4.2)
(/usr/local/texlive/2026/texmf-dist/metapost/base/mpost.mp
(/usr/local/texlive/2026/texmf-dist/metapost/base/plain.mp
Preloading the plain mem file, version 1.005) ) (./MPT-04-002.mp [1{psfonts.map
}<cmr10.pfb><cmr8.pfb>] )
1 output file written: MPT-04-002.svg
Transcript written on MPT-04-002.log.
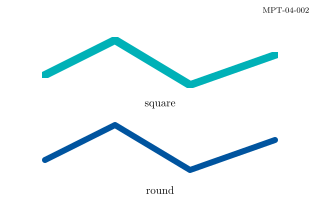
Command or parameter
Meaning
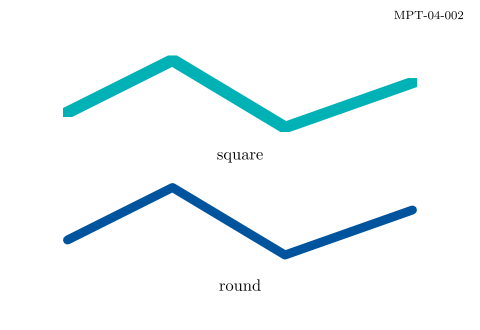
pencircle / pensquare
Choose the shape swept along the path.
Same centre line
The difference comes from the pen rather than different coordinates.
Complete standalone MetaPost program
prologues:=3;outputformat:="svg";defaultfont:="cmr10";defaultscale:=1.1;colorBlue,Teal,Orange,Green,Grey,Light,Wash;Blue:=(0,84/255,159/255);Teal:=(0,177/255,183/255);Orange:=(246/255,168/255,0);Green:=(87/255,171/255,39/255);Grey:=(100/255,101/255,103/255);Light:=(236/255,236/255,237/255);Wash:=(232/255,241/255,250/255);% Format displayed numbers to hundredths using integer strings.vardefnumlabel(exprvalue)=saven,whole,frac;numericn,whole,frac;n:=round(100absvalue);whole:=floor(n/100);frac:=nmod100;(ifvalue<-.005:"-" & fidecimalwholeiffrac>0: & "." & iffrac<10:"0" & fidecimalfracfi)enddef;pickuppencirclescaled.9;outputtemplate:="MPT-04-002.svg";beginfig(1);fillunitsquarexscaled320yscaled220withcolorwhite;% BEGIN DRAWINGpathp;p:=(45,0)--(115,35)--(190,-10)--(275,20);drawpshifted(0,60)withpenpencirclescaled6withcolorBlue;drawpshifted(0,145)withpenpensquarescaled6withcolorTeal;label("round",(160,30));label("square",(160,115));% END DRAWINGlabel.lft("MPT-04-002"infont"cmr8",(312,210));setboundscurrentpicturetounitsquarexscaled320yscaled220;endfig;end.
This is MetaPost, version 3.00 (TeX Live 2026) (kpathsea version 6.4.2)
(/usr/local/texlive/2026/texmf-dist/metapost/base/mpost.mp
(/usr/local/texlive/2026/texmf-dist/metapost/base/plain.mp
Preloading the plain mem file, version 1.005) ) (./MPT-04-003.mp [1{psfonts.map
}<cmr8.pfb>] )
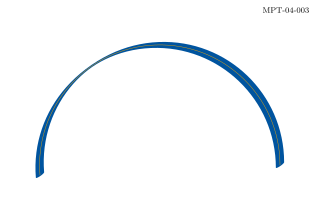
1 output file written: MPT-04-003.svg
Transcript written on MPT-04-003.log.
Command or parameter
Meaning
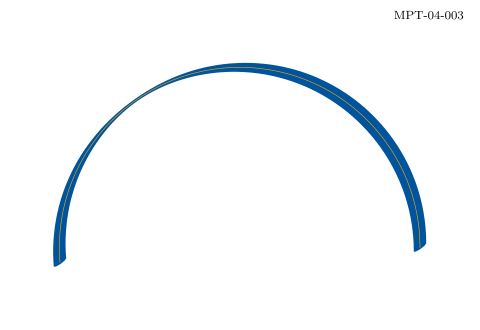
xscaled / yscaled
Give the pen unequal dimensions.
rotated 35
Rotate the nib, not the centre line.
Complete standalone MetaPost program
prologues:=3;outputformat:="svg";defaultfont:="cmr10";defaultscale:=1.1;colorBlue,Teal,Orange,Green,Grey,Light,Wash;Blue:=(0,84/255,159/255);Teal:=(0,177/255,183/255);Orange:=(246/255,168/255,0);Green:=(87/255,171/255,39/255);Grey:=(100/255,101/255,103/255);Light:=(236/255,236/255,237/255);Wash:=(232/255,241/255,250/255);% Format displayed numbers to hundredths using integer strings.vardefnumlabel(exprvalue)=saven,whole,frac;numericn,whole,frac;n:=round(100absvalue);whole:=floor(n/100);frac:=nmod100;(ifvalue<-.005:"-" & fidecimalwholeiffrac>0: & "." & iffrac<10:"0" & fidecimalfracfi)enddef;pickuppencirclescaled.9;outputtemplate:="MPT-04-003.svg";beginfig(1);fillunitsquarexscaled320yscaled220withcolorwhite;% BEGIN DRAWINGpathp;p:=(40,45)..(155,175)..(280,55);drawpwithpenpencirclexscaled10yscaled2rotated35withcolorBlue;drawpwithpenpencirclescaled.4withcolorOrange;% END DRAWINGlabel.lft("MPT-04-003"infont"cmr8",(312,210));setboundscurrentpicturetounitsquarexscaled320yscaled220;endfig;end.
This is MetaPost, version 3.00 (TeX Live 2026) (kpathsea version 6.4.2)
(/usr/local/texlive/2026/texmf-dist/metapost/base/mpost.mp
(/usr/local/texlive/2026/texmf-dist/metapost/base/plain.mp
Preloading the plain mem file, version 1.005) ) (./MPT-04-004.mp [1{psfonts.map
}<cmr8.pfb>] )
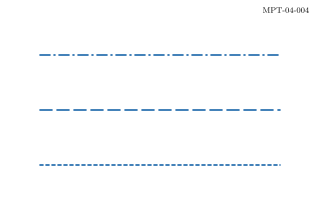
1 output file written: MPT-04-004.svg
Transcript written on MPT-04-004.log.
Command or parameter
Meaning
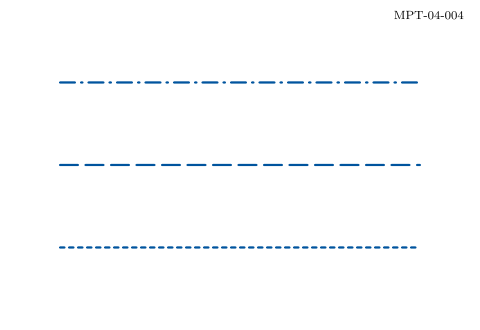
evenly
Use the standard evenly spaced pattern.
dashpattern
Alternate specified on and off lengths.
Complete standalone MetaPost program
prologues:=3;outputformat:="svg";defaultfont:="cmr10";defaultscale:=1.1;colorBlue,Teal,Orange,Green,Grey,Light,Wash;Blue:=(0,84/255,159/255);Teal:=(0,177/255,183/255);Orange:=(246/255,168/255,0);Green:=(87/255,171/255,39/255);Grey:=(100/255,101/255,103/255);Light:=(236/255,236/255,237/255);Wash:=(232/255,241/255,250/255);% Format displayed numbers to hundredths using integer strings.vardefnumlabel(exprvalue)=saven,whole,frac;numericn,whole,frac;n:=round(100absvalue);whole:=floor(n/100);frac:=nmod100;(ifvalue<-.005:"-" & fidecimalwholeiffrac>0: & "." & iffrac<10:"0" & fidecimalfracfi)enddef;pickuppencirclescaled.9;outputtemplate:="MPT-04-004.svg";beginfig(1);fillunitsquarexscaled320yscaled220withcolorwhite;% BEGIN DRAWINGdraw(40,55)--(280,55)dashedevenlywithpenpencirclescaled1.5withcolorBlue;draw(40,110)--(280,110)dasheddashpattern(on12off5)withpenpencirclescaled1.5withcolorBlue;draw(40,165)--(280,165)dasheddashpattern(on10off4on1off4)withpenpencirclescaled1.5withcolorBlue;% END DRAWINGlabel.lft("MPT-04-004"infont"cmr8",(312,210));setboundscurrentpicturetounitsquarexscaled320yscaled220;endfig;end.
This is MetaPost, version 3.00 (TeX Live 2026) (kpathsea version 6.4.2)
(/usr/local/texlive/2026/texmf-dist/metapost/base/mpost.mp
(/usr/local/texlive/2026/texmf-dist/metapost/base/plain.mp
Preloading the plain mem file, version 1.005) ) (./MPT-04-005.mp [1{psfonts.map
}<cmr10.pfb><cmr8.pfb>] )
1 output file written: MPT-04-005.svg
Transcript written on MPT-04-005.log.
Command or parameter
Meaning
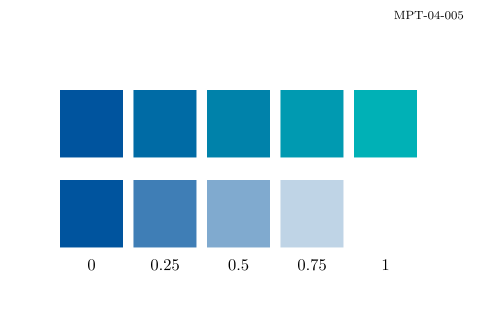
t[colourA,colourB]
Linearly interpolate the colour components.
White mixture
Create a tint that remains an opaque fill.
Complete standalone MetaPost program
prologues:=3;outputformat:="svg";defaultfont:="cmr10";defaultscale:=1.1;colorBlue,Teal,Orange,Green,Grey,Light,Wash;Blue:=(0,84/255,159/255);Teal:=(0,177/255,183/255);Orange:=(246/255,168/255,0);Green:=(87/255,171/255,39/255);Grey:=(100/255,101/255,103/255);Light:=(236/255,236/255,237/255);Wash:=(232/255,241/255,250/255);% Format displayed numbers to hundredths using integer strings.vardefnumlabel(exprvalue)=saven,whole,frac;numericn,whole,frac;n:=round(100absvalue);whole:=floor(n/100);frac:=nmod100;(ifvalue<-.005:"-" & fidecimalwholeiffrac>0: & "." & iffrac<10:"0" & fidecimalfracfi)enddef;pickuppencirclescaled.9;outputtemplate:="MPT-04-005.svg";beginfig(1);fillunitsquarexscaled320yscaled220withcolorwhite;% BEGIN DRAWINGfori=0upto4:fillunitsquarexscaled42yscaled45shifted(40+49i,115)withcolor(i/4)[Blue,Teal];fillunitsquarexscaled42yscaled45shifted(40+49i,55)withcolor(i/4)[Blue,white];label.bot(decimal(i/4),(61+49i,50));endfor% END DRAWINGlabel.lft("MPT-04-005"infont"cmr8",(312,210));setboundscurrentpicturetounitsquarexscaled320yscaled220;endfig;end.
This is MetaPost, version 3.00 (TeX Live 2026) (kpathsea version 6.4.2)
(/usr/local/texlive/2026/texmf-dist/metapost/base/mpost.mp
(/usr/local/texlive/2026/texmf-dist/metapost/base/plain.mp
Preloading the plain mem file, version 1.005) ) (./MPT-04-006.mp [1{psfonts.map
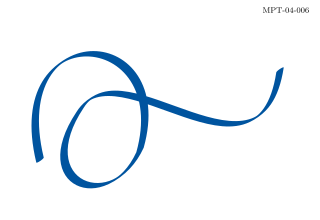
}<cmr8.pfb>] )
1 output file written: MPT-04-006.svg
Transcript written on MPT-04-006.log.
Command or parameter
Meaning
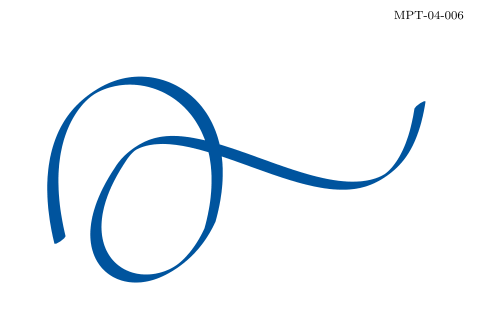
Compound cubic path
Join several explicit Bezier segments.
Elliptical pen
Keep one nib orientation while the path turns.
Complete standalone MetaPost program
prologues:=3;outputformat:="svg";defaultfont:="cmr10";defaultscale:=1.1;colorBlue,Teal,Orange,Green,Grey,Light,Wash;Blue:=(0,84/255,159/255);Teal:=(0,177/255,183/255);Orange:=(246/255,168/255,0);Green:=(87/255,171/255,39/255);Grey:=(100/255,101/255,103/255);Light:=(236/255,236/255,237/255);Wash:=(232/255,241/255,250/255);% Format displayed numbers to hundredths using integer strings.vardefnumlabel(exprvalue)=saven,whole,frac;numericn,whole,frac;n:=round(100absvalue);whole:=floor(n/100);frac:=nmod100;(ifvalue<-.005:"-" & fidecimalwholeiffrac>0: & "." & iffrac<10:"0" & fidecimalfracfi)enddef;pickuppencirclescaled.9;outputtemplate:="MPT-04-006.svg";beginfig(1);fillunitsquarexscaled320yscaled220withcolorwhite;% BEGIN DRAWINGpathp;p:=(40,60)..controls(5,205)and(175,195)..(140,70)..controls(110,5)and(30,35)..(80,110)..controls(120,175)and(260,20)..(280,150);drawpwithpenpencirclexscaled9yscaled1.8rotated35withcolorBlue;% END DRAWINGlabel.lft("MPT-04-006"infont"cmr8",(312,210));setboundscurrentpicturetounitsquarexscaled320yscaled220;endfig;end.
This is MetaPost, version 3.00 (TeX Live 2026) (kpathsea version 6.4.2)
(/usr/local/texlive/2026/texmf-dist/metapost/base/mpost.mp
(/usr/local/texlive/2026/texmf-dist/metapost/base/plain.mp
Preloading the plain mem file, version 1.005) ) (./MPT-05-001.mp [1{psfonts.map
}<cmr8.pfb>] )
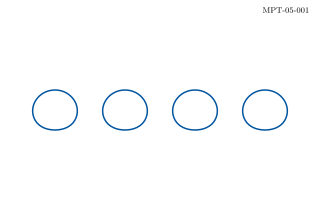
1 output file written: MPT-05-001.svg
Transcript written on MPT-05-001.log.
Command or parameter
Meaning
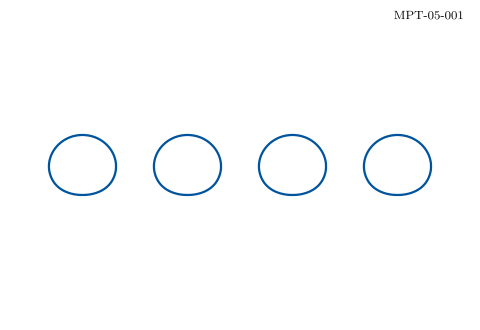
shifted (dx,dy)
Translate a path by a pair.
Stored path
Reuse the same geometry rather than writing four copies.
Complete standalone MetaPost program
prologues:=3;outputformat:="svg";defaultfont:="cmr10";defaultscale:=1.1;colorBlue,Teal,Orange,Green,Grey,Light,Wash;Blue:=(0,84/255,159/255);Teal:=(0,177/255,183/255);Orange:=(246/255,168/255,0);Green:=(87/255,171/255,39/255);Grey:=(100/255,101/255,103/255);Light:=(236/255,236/255,237/255);Wash:=(232/255,241/255,250/255);% Format displayed numbers to hundredths using integer strings.vardefnumlabel(exprvalue)=saven,whole,frac;numericn,whole,frac;n:=round(100absvalue);whole:=floor(n/100);frac:=nmod100;(ifvalue<-.005:"-" & fidecimalwholeiffrac>0: & "." & iffrac<10:"0" & fidecimalfracfi)enddef;pickuppencirclescaled.9;outputtemplate:="MPT-05-001.svg";beginfig(1);fillunitsquarexscaled320yscaled220withcolorwhite;% BEGIN DRAWINGpathp;p:=(-20,0)..(0,30)..(20,0)..(0,-10)..cycle;fori=0upto3:drawpshifted(55+70i,100)withpenpencirclescaled1.5withcolorBlue;endfor% END DRAWINGlabel.lft("MPT-05-001"infont"cmr8",(312,210));setboundscurrentpicturetounitsquarexscaled320yscaled220;endfig;end.
This is MetaPost, version 3.00 (TeX Live 2026) (kpathsea version 6.4.2)
(/usr/local/texlive/2026/texmf-dist/metapost/base/mpost.mp
(/usr/local/texlive/2026/texmf-dist/metapost/base/plain.mp
Preloading the plain mem file, version 1.005) ) (./MPT-05-002.mp [1{psfonts.map
}<cmr8.pfb>] )
1 output file written: MPT-05-002.svg
Transcript written on MPT-05-002.log.
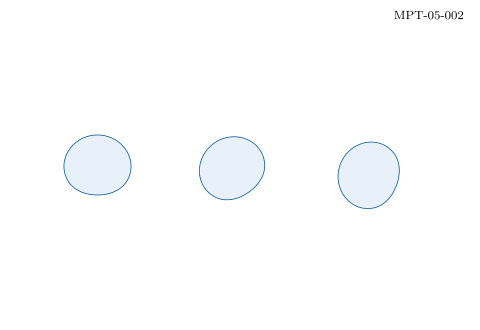
Command or parameter
Meaning
rotated angle
Angles are in degrees.
Order
Rotate locally, then translate to the desired centre.
Complete standalone MetaPost program
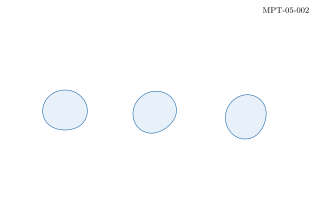
prologues:=3;outputformat:="svg";defaultfont:="cmr10";defaultscale:=1.1;colorBlue,Teal,Orange,Green,Grey,Light,Wash;Blue:=(0,84/255,159/255);Teal:=(0,177/255,183/255);Orange:=(246/255,168/255,0);Green:=(87/255,171/255,39/255);Grey:=(100/255,101/255,103/255);Light:=(236/255,236/255,237/255);Wash:=(232/255,241/255,250/255);% Format displayed numbers to hundredths using integer strings.vardefnumlabel(exprvalue)=saven,whole,frac;numericn,whole,frac;n:=round(100absvalue);whole:=floor(n/100);frac:=nmod100;(ifvalue<-.005:"-" & fidecimalwholeiffrac>0: & "." & iffrac<10:"0" & fidecimalfracfi)enddef;pickuppencirclescaled.9;outputtemplate:="MPT-05-002.svg";beginfig(1);fillunitsquarexscaled320yscaled220withcolorwhite;% BEGIN DRAWINGpathp;p:=(-20,0)..(0,30)..(20,0)..(0,-10)..cycle;fori=0upto2:fillprotated(35i)shifted(65+95i,100)withcolorWash;drawprotated(35i)shifted(65+95i,100)withcolorBlue;endfor% END DRAWINGlabel.lft("MPT-05-002"infont"cmr8",(312,210));setboundscurrentpicturetounitsquarexscaled320yscaled220;endfig;end.
This is MetaPost, version 3.00 (TeX Live 2026) (kpathsea version 6.4.2)
(/usr/local/texlive/2026/texmf-dist/metapost/base/mpost.mp
(/usr/local/texlive/2026/texmf-dist/metapost/base/plain.mp
Preloading the plain mem file, version 1.005) ) (./MPT-05-003.mp [1{psfonts.map
}<cmr8.pfb>] )
1 output file written: MPT-05-003.svg
Transcript written on MPT-05-003.log.
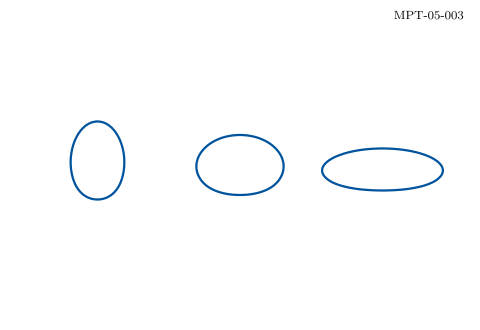
Command or parameter
Meaning
xscaled / yscaled
Apply different factors to horizontal and vertical components.
Pen placement
withpen chooses the final stroke independently of the transformed path.
Complete standalone MetaPost program
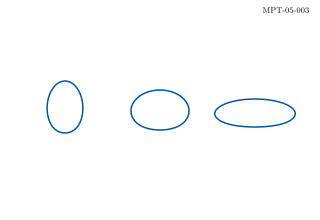
prologues:=3;outputformat:="svg";defaultfont:="cmr10";defaultscale:=1.1;colorBlue,Teal,Orange,Green,Grey,Light,Wash;Blue:=(0,84/255,159/255);Teal:=(0,177/255,183/255);Orange:=(246/255,168/255,0);Green:=(87/255,171/255,39/255);Grey:=(100/255,101/255,103/255);Light:=(236/255,236/255,237/255);Wash:=(232/255,241/255,250/255);% Format displayed numbers to hundredths using integer strings.vardefnumlabel(exprvalue)=saven,whole,frac;numericn,whole,frac;n:=round(100absvalue);whole:=floor(n/100);frac:=nmod100;(ifvalue<-.005:"-" & fidecimalwholeiffrac>0: & "." & iffrac<10:"0" & fidecimalfracfi)enddef;pickuppencirclescaled.9;outputtemplate:="MPT-05-003.svg";beginfig(1);fillunitsquarexscaled320yscaled220withcolorwhite;% BEGIN DRAWINGpathp;p:=(-20,0)..(0,30)..(20,0)..(0,-10)..cycle;fori=0upto2:drawpxscaled(.8+.5i)yscaled(1.3-.3i)shifted(65+95i,100)withpenpencirclescaled1.5withcolorBlue;endfor% END DRAWINGlabel.lft("MPT-05-003"infont"cmr8",(312,210));setboundscurrentpicturetounitsquarexscaled320yscaled220;endfig;end.
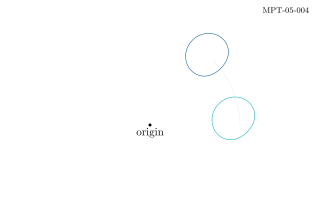
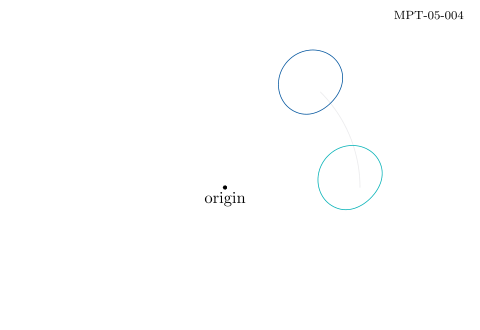
The blue path is translated and then rotated; the turquoise one is rotated and then translated. Their final positions differ even though the same operations appear.
This is MetaPost, version 3.00 (TeX Live 2026) (kpathsea version 6.4.2)
(/usr/local/texlive/2026/texmf-dist/metapost/base/mpost.mp
(/usr/local/texlive/2026/texmf-dist/metapost/base/plain.mp
Preloading the plain mem file, version 1.005) ) (./MPT-05-004.mp [1{psfonts.map
}<cmr10.pfb><cmr8.pfb>] )
1 output file written: MPT-05-004.svg
Transcript written on MPT-05-004.log.
Command or parameter
Meaning
Operation order
Transformations are applied from left to right.
Rotation about the origin
A preceding translation is rotated along with the path.
Complete standalone MetaPost program
prologues:=3;outputformat:="svg";defaultfont:="cmr10";defaultscale:=1.1;colorBlue,Teal,Orange,Green,Grey,Light,Wash;Blue:=(0,84/255,159/255);Teal:=(0,177/255,183/255);Orange:=(246/255,168/255,0);Green:=(87/255,171/255,39/255);Grey:=(100/255,101/255,103/255);Light:=(236/255,236/255,237/255);Wash:=(232/255,241/255,250/255);% Format displayed numbers to hundredths using integer strings.vardefnumlabel(exprvalue)=saven,whole,frac;numericn,whole,frac;n:=round(100absvalue);whole:=floor(n/100);frac:=nmod100;(ifvalue<-.005:"-" & fidecimalwholeiffrac>0: & "." & iffrac<10:"0" & fidecimalfracfi)enddef;pickuppencirclescaled.9;outputtemplate:="MPT-05-004.svg";beginfig(1);fillunitsquarexscaled320yscaled220withcolorwhite;% BEGIN DRAWINGpathp;p:=(-20,0)..(0,30)..(20,0)..(0,-10)..cycle;pairo;o:=(150,95);drawsubpath(0,1)offullcirclescaled180shiftedowithcolorLight;drawpshifted(90,0)rotated45shiftedowithcolorBlue;drawprotated45shifted(90,0)shiftedowithcolorTeal;dotlabel.bot("origin",o);% END DRAWINGlabel.lft("MPT-05-004"infont"cmr8",(312,210));setboundscurrentpicturetounitsquarexscaled320yscaled220;endfig;end.
This is MetaPost, version 3.00 (TeX Live 2026) (kpathsea version 6.4.2)
(/usr/local/texlive/2026/texmf-dist/metapost/base/mpost.mp
(/usr/local/texlive/2026/texmf-dist/metapost/base/plain.mp
Preloading the plain mem file, version 1.005) ) (./MPT-05-005.mp [1{psfonts.map
}<cmr8.pfb>] )
1 output file written: MPT-05-005.svg
Transcript written on MPT-05-005.log.
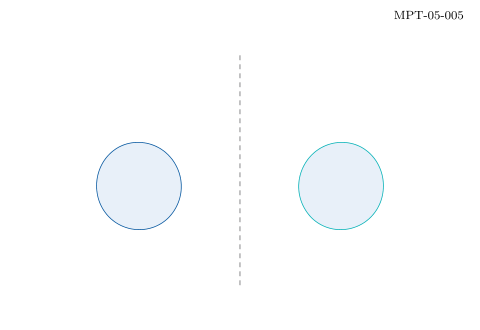
Command or parameter
Meaning
xscaled -1
Reflect across the local vertical axis.
Asymmetry
A symmetric shape could conceal the effect.
Complete standalone MetaPost program
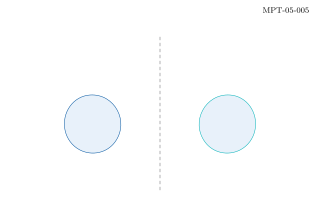
prologues:=3;outputformat:="svg";defaultfont:="cmr10";defaultscale:=1.1;colorBlue,Teal,Orange,Green,Grey,Light,Wash;Blue:=(0,84/255,159/255);Teal:=(0,177/255,183/255);Orange:=(246/255,168/255,0);Green:=(87/255,171/255,39/255);Grey:=(100/255,101/255,103/255);Light:=(236/255,236/255,237/255);Wash:=(232/255,241/255,250/255);% Format displayed numbers to hundredths using integer strings.vardefnumlabel(exprvalue)=saven,whole,frac;numericn,whole,frac;n:=round(100absvalue);whole:=floor(n/100);frac:=nmod100;(ifvalue<-.005:"-" & fidecimalwholeiffrac>0: & "." & iffrac<10:"0" & fidecimalfracfi)enddef;pickuppencirclescaled.9;outputtemplate:="MPT-05-005.svg";beginfig(1);fillunitsquarexscaled320yscaled220withcolorwhite;% BEGIN DRAWINGpathp;p:=(0,0)..(35,8)..(10,55)..(-15,20)..cycle;fillpshifted(80,70)withcolorWash;drawpshifted(80,70)withcolorBlue;fillpxscaled-1shifted(240,70)withcolorWash;drawpxscaled-1shifted(240,70)withcolorTeal;draw(160,30)--(160,185)dashedevenlywithcolorGrey;% END DRAWINGlabel.lft("MPT-05-005"infont"cmr8",(312,210));setboundscurrentpicturetounitsquarexscaled320yscaled220;endfig;end.
This is MetaPost, version 3.00 (TeX Live 2026) (kpathsea version 6.4.2)
(/usr/local/texlive/2026/texmf-dist/metapost/base/mpost.mp
(/usr/local/texlive/2026/texmf-dist/metapost/base/plain.mp
Preloading the plain mem file, version 1.005) ) (./MPT-05-006.mp [1{psfonts.map
}<cmr10.pfb><cmr8.pfb>] )
1 output file written: MPT-05-006.svg
Transcript written on MPT-05-006.log.
Command or parameter
Meaning
identity
Start from an unchanged coordinate system.
slanted
Apply a horizontal shear.
transformed T
Apply the named transformation in one operation.
Complete standalone MetaPost program
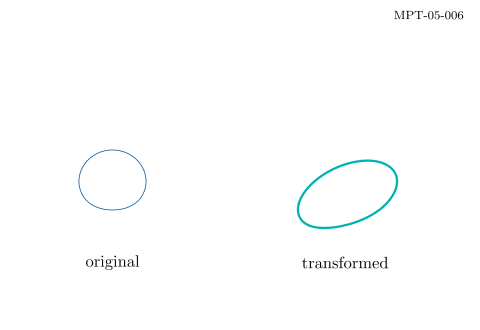
prologues:=3;outputformat:="svg";defaultfont:="cmr10";defaultscale:=1.1;colorBlue,Teal,Orange,Green,Grey,Light,Wash;Blue:=(0,84/255,159/255);Teal:=(0,177/255,183/255);Orange:=(246/255,168/255,0);Green:=(87/255,171/255,39/255);Grey:=(100/255,101/255,103/255);Light:=(236/255,236/255,237/255);Wash:=(232/255,241/255,250/255);% Format displayed numbers to hundredths using integer strings.vardefnumlabel(exprvalue)=saven,whole,frac;numericn,whole,frac;n:=round(100absvalue);whole:=floor(n/100);frac:=nmod100;(ifvalue<-.005:"-" & fidecimalwholeiffrac>0: & "." & iffrac<10:"0" & fidecimalfracfi)enddef;pickuppencirclescaled.9;outputtemplate:="MPT-05-006.svg";beginfig(1);fillunitsquarexscaled320yscaled220withcolorwhite;% BEGIN DRAWINGpathp;p:=(-20,0)..(0,30)..(20,0)..(0,-10)..cycle;transformT;T:=identityxscaled1.5slanted.4rotated12shifted(230,80);drawpshifted(75,90)withcolorBlue;drawptransformedTwithpenpencirclescaled1.5withcolorTeal;label("original",(75,45));label("transformed",(230,45));% END DRAWINGlabel.lft("MPT-05-006"infont"cmr8",(312,210));setboundscurrentpicturetounitsquarexscaled320yscaled220;endfig;end.
This is MetaPost, version 3.00 (TeX Live 2026) (kpathsea version 6.4.2)
(/usr/local/texlive/2026/texmf-dist/metapost/base/mpost.mp
(/usr/local/texlive/2026/texmf-dist/metapost/base/plain.mp
Preloading the plain mem file, version 1.005) ) (./MPT-06-001.mp [1{psfonts.map
}<cmr8.pfb>] )
1 output file written: MPT-06-001.svg
Transcript written on MPT-06-001.log.
Command or parameter
Meaning
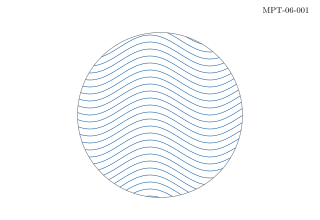
image(...)
Capture a group of drawing operations as a picture.
clip picture to path
Keep only the portion inside a closed boundary.
Complete standalone MetaPost program
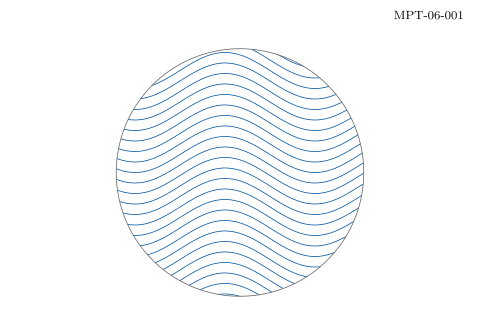
prologues:=3;outputformat:="svg";defaultfont:="cmr10";defaultscale:=1.1;colorBlue,Teal,Orange,Green,Grey,Light,Wash;Blue:=(0,84/255,159/255);Teal:=(0,177/255,183/255);Orange:=(246/255,168/255,0);Green:=(87/255,171/255,39/255);Grey:=(100/255,101/255,103/255);Light:=(236/255,236/255,237/255);Wash:=(232/255,241/255,250/255);% Format displayed numbers to hundredths using integer strings.vardefnumlabel(exprvalue)=saven,whole,frac;numericn,whole,frac;n:=round(100absvalue);whole:=floor(n/100);frac:=nmod100;(ifvalue<-.005:"-" & fidecimalwholeiffrac>0: & "." & iffrac<10:"0" & fidecimalfracfi)enddef;pickuppencirclescaled.9;outputtemplate:="MPT-06-001.svg";beginfig(1);fillunitsquarexscaled320yscaled220withcolorwhite;% BEGIN DRAWINGpicturewaves;waves:=image(forj=-30step7until230:drawfori=0step10until320:ifi>0:..fi(i,j+12sind(3i))endforwithcolorBlue;endfor);pathboundary;boundary:=fullcirclescaled165shifted(160,105);clipwavestoboundary;drawwaves;drawboundarywithcolorGrey;% END DRAWINGlabel.lft("MPT-06-001"infont"cmr8",(312,210));setboundscurrentpicturetounitsquarexscaled320yscaled220;endfig;end.
This is MetaPost, version 3.00 (TeX Live 2026) (kpathsea version 6.4.2)
(/usr/local/texlive/2026/texmf-dist/metapost/base/mpost.mp
(/usr/local/texlive/2026/texmf-dist/metapost/base/plain.mp
Preloading the plain mem file, version 1.005) ) (./MPT-06-002.mp [1{psfonts.map
}<cmr8.pfb>] )
1 output file written: MPT-06-002.svg
Transcript written on MPT-06-002.log.
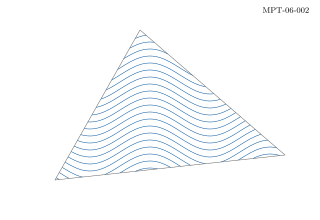
Command or parameter
Meaning
Different boundary
The drawing procedure is independent of the mask.
Closed triangle
Any suitable closed path can act as a clipping boundary.
Complete standalone MetaPost program
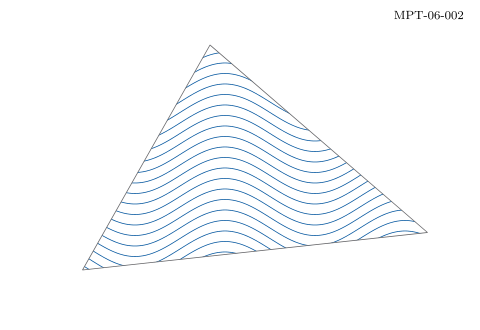
prologues:=3;outputformat:="svg";defaultfont:="cmr10";defaultscale:=1.1;colorBlue,Teal,Orange,Green,Grey,Light,Wash;Blue:=(0,84/255,159/255);Teal:=(0,177/255,183/255);Orange:=(246/255,168/255,0);Green:=(87/255,171/255,39/255);Grey:=(100/255,101/255,103/255);Light:=(236/255,236/255,237/255);Wash:=(232/255,241/255,250/255);% Format displayed numbers to hundredths using integer strings.vardefnumlabel(exprvalue)=saven,whole,frac;numericn,whole,frac;n:=round(100absvalue);whole:=floor(n/100);frac:=nmod100;(ifvalue<-.005:"-" & fidecimalwholeiffrac>0: & "." & iffrac<10:"0" & fidecimalfracfi)enddef;pickuppencirclescaled.9;outputtemplate:="MPT-06-002.svg";beginfig(1);fillunitsquarexscaled320yscaled220withcolorwhite;% BEGIN DRAWINGpicturewaves;waves:=image(forj=-30step7until230:drawfori=0step10until320:ifi>0:..fi(i,j+12sind(3i))endforwithcolorBlue;endfor);pathboundary;boundary:=(55,40)--(285,65)--(140,190)--cycle;clipwavestoboundary;drawwaves;drawboundarywithcolorGrey;% END DRAWINGlabel.lft("MPT-06-002"infont"cmr8",(312,210));setboundscurrentpicturetounitsquarexscaled320yscaled220;endfig;end.
This is MetaPost, version 3.00 (TeX Live 2026) (kpathsea version 6.4.2)
(/usr/local/texlive/2026/texmf-dist/metapost/base/mpost.mp
(/usr/local/texlive/2026/texmf-dist/metapost/base/plain.mp
Preloading the plain mem file, version 1.005) ) (./MPT-06-003.mp [1{psfonts.map
}<cmr8.pfb>] )
1 output file written: MPT-06-003.svg
Transcript written on MPT-06-003.log.
Command or parameter
Meaning
Later fills
Paint over earlier objects.
White cut-out
Matches this opaque canvas; it does not create transparency.
Complete standalone MetaPost program
prologues:=3;outputformat:="svg";defaultfont:="cmr10";defaultscale:=1.1;colorBlue,Teal,Orange,Green,Grey,Light,Wash;Blue:=(0,84/255,159/255);Teal:=(0,177/255,183/255);Orange:=(246/255,168/255,0);Green:=(87/255,171/255,39/255);Grey:=(100/255,101/255,103/255);Light:=(236/255,236/255,237/255);Wash:=(232/255,241/255,250/255);% Format displayed numbers to hundredths using integer strings.vardefnumlabel(exprvalue)=saven,whole,frac;numericn,whole,frac;n:=round(100absvalue);whole:=floor(n/100);frac:=nmod100;(ifvalue<-.005:"-" & fidecimalwholeiffrac>0: & "." & iffrac<10:"0" & fidecimalfracfi)enddef;pickuppencirclescaled.9;outputtemplate:="MPT-06-003.svg";beginfig(1);fillunitsquarexscaled320yscaled220withcolorwhite;% BEGIN DRAWINGfillfullcirclescaled130shifted(125,105)withcolorBlue;fillfullcirclescaled130shifted(195,105)withcolorTeal;fillfullcirclescaled78shifted(160,105)withcolorwhite;drawfullcirclescaled42shifted(160,105)withpenpencirclescaled4withcolorOrange;% END DRAWINGlabel.lft("MPT-06-003"infont"cmr8",(312,210));setboundscurrentpicturetounitsquarexscaled320yscaled220;endfig;end.
This is MetaPost, version 3.00 (TeX Live 2026) (kpathsea version 6.4.2)
(/usr/local/texlive/2026/texmf-dist/metapost/base/mpost.mp
(/usr/local/texlive/2026/texmf-dist/metapost/base/plain.mp
Preloading the plain mem file, version 1.005) ) (./MPT-06-004.mp [1{psfonts.map
}<cmr8.pfb>] )
1 output file written: MPT-06-004.svg
Transcript written on MPT-06-004.log.
Command or parameter
Meaning
reverse inner contour
Give the inner boundary the opposite winding.
subpath (0,8)
Use an open traversal of the complete circle before joining the boundaries.
Complete standalone MetaPost program
prologues:=3;outputformat:="svg";defaultfont:="cmr10";defaultscale:=1.1;colorBlue,Teal,Orange,Green,Grey,Light,Wash;Blue:=(0,84/255,159/255);Teal:=(0,177/255,183/255);Orange:=(246/255,168/255,0);Green:=(87/255,171/255,39/255);Grey:=(100/255,101/255,103/255);Light:=(236/255,236/255,237/255);Wash:=(232/255,241/255,250/255);% Format displayed numbers to hundredths using integer strings.vardefnumlabel(exprvalue)=saven,whole,frac;numericn,whole,frac;n:=round(100absvalue);whole:=floor(n/100);frac:=nmod100;(ifvalue<-.005:"-" & fidecimalwholeiffrac>0: & "." & iffrac<10:"0" & fidecimalfracfi)enddef;pickuppencirclescaled.9;outputtemplate:="MPT-06-004.svg";beginfig(1);fillunitsquarexscaled320yscaled220withcolorwhite;% BEGIN DRAWINGpicturestripes;pathring;fillunitsquarexscaled230yscaled165shifted(45,25)withcolorWash;stripes:=image(forx=30step9until290:draw(x,20)--(x+50,190)withpenpencirclescaled3withcolorTeal;endfor);ring:=((subpath(0,8)offullcirclescaled160)--reverse(subpath(0,8)offullcirclescaled85)--cycle)shifted(160,105);clipstripestoring;drawstripes;% END DRAWINGlabel.lft("MPT-06-004"infont"cmr8",(312,210));setboundscurrentpicturetounitsquarexscaled320yscaled220;endfig;end.
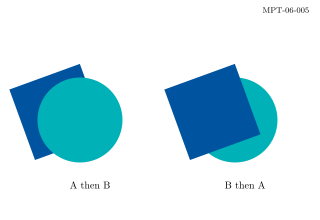
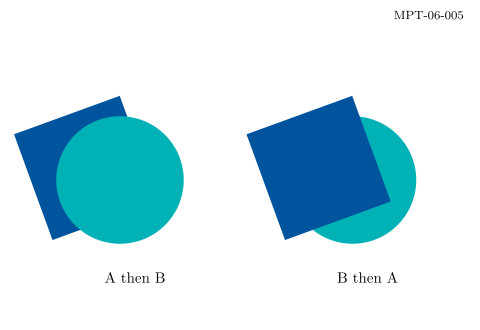
picturea,b;a:=image(fillunitsquarescaled75rotated20withcolorBlue;);b:=image(fillfullcirclescaled85shifted(45,40)withcolorTeal;);drawashifted(35,60);drawbshifted(35,60);drawbshifted(190,60);drawashifted(190,60);label(btex A then B etex,(90,35));label(btex B then A etex,(245,35));
Actual output
MPT-06-005 · Rendered by MetaPost
MetaPost · exit 0
Native compiler log
Standard output
This is MetaPost, version 3.00 (TeX Live 2026) (kpathsea version 6.4.2)
(/usr/local/texlive/2026/texmf-dist/metapost/base/mpost.mp
(/usr/local/texlive/2026/texmf-dist/metapost/base/plain.mp
Preloading the plain mem file, version 1.005) ) (./MPT-06-005.mp [1{psfonts.map
}<cmr10.pfb><cmr8.pfb>] )
1 output file written: MPT-06-005.svg
Transcript written on MPT-06-005.log.
Command or parameter
Meaning
picture
Store several drawings or fills as one reusable object.
draw order
The second picture covers the first in the overlapping area.
Complete standalone MetaPost program
prologues:=3;outputformat:="svg";defaultfont:="cmr10";defaultscale:=1.1;colorBlue,Teal,Orange,Green,Grey,Light,Wash;Blue:=(0,84/255,159/255);Teal:=(0,177/255,183/255);Orange:=(246/255,168/255,0);Green:=(87/255,171/255,39/255);Grey:=(100/255,101/255,103/255);Light:=(236/255,236/255,237/255);Wash:=(232/255,241/255,250/255);% Format displayed numbers to hundredths using integer strings.vardefnumlabel(exprvalue)=saven,whole,frac;numericn,whole,frac;n:=round(100absvalue);whole:=floor(n/100);frac:=nmod100;(ifvalue<-.005:"-" & fidecimalwholeiffrac>0: & "." & iffrac<10:"0" & fidecimalfracfi)enddef;pickuppencirclescaled.9;outputtemplate:="MPT-06-005.svg";beginfig(1);fillunitsquarexscaled320yscaled220withcolorwhite;% BEGIN DRAWINGpicturea,b;a:=image(fillunitsquarescaled75rotated20withcolorBlue;);b:=image(fillfullcirclescaled85shifted(45,40)withcolorTeal;);drawashifted(35,60);drawbshifted(35,60);drawbshifted(190,60);drawashifted(190,60);label(btex A then B etex,(90,35));label(btex B then A etex,(245,35));% END DRAWINGlabel.lft("MPT-06-005"infont"cmr8",(312,210));setboundscurrentpicturetounitsquarexscaled320yscaled220;endfig;end.
This is MetaPost, version 3.00 (TeX Live 2026) (kpathsea version 6.4.2)
(/usr/local/texlive/2026/texmf-dist/metapost/base/mpost.mp
(/usr/local/texlive/2026/texmf-dist/metapost/base/plain.mp
Preloading the plain mem file, version 1.005) ) (./MPT-06-006.mp [1{psfonts.map
}<cmr10.pfb><cmr8.pfb>] )
1 output file written: MPT-06-006.svg
Transcript written on MPT-06-006.log.
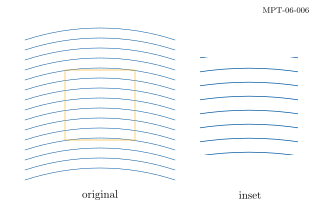
Command or parameter
Meaning
crop:=full
Copy a picture before changing its clipping state.
Translate before scaling
Move the crop to the origin, enlarge it, then place the inset.
Complete standalone MetaPost program
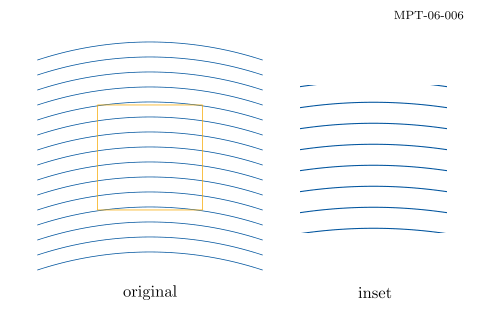
prologues:=3;outputformat:="svg";defaultfont:="cmr10";defaultscale:=1.1;colorBlue,Teal,Orange,Green,Grey,Light,Wash;Blue:=(0,84/255,159/255);Teal:=(0,177/255,183/255);Orange:=(246/255,168/255,0);Green:=(87/255,171/255,39/255);Grey:=(100/255,101/255,103/255);Light:=(236/255,236/255,237/255);Wash:=(232/255,241/255,250/255);% Format displayed numbers to hundredths using integer strings.vardefnumlabel(exprvalue)=saven,whole,frac;numericn,whole,frac;n:=round(100absvalue);whole:=floor(n/100);frac:=nmod100;(ifvalue<-.005:"-" & fidecimalwholeiffrac>0: & "." & iffrac<10:"0" & fidecimalfracfi)enddef;pickuppencirclescaled.9;outputtemplate:="MPT-06-006.svg";beginfig(1);fillunitsquarexscaled320yscaled220withcolorwhite;% BEGIN DRAWINGpicturefull,crop;full:=image(forj=0step10until140:draw(0,j)..(75,j+12)..(150,j)withcolorBlue;endfor);crop:=full;clipcroptounitsquarescaled70shifted(40,40);drawfullshifted(25,40);drawcropshifted(-40,-40)scaled1.4shifted(200,65);drawunitsquarescaled70shifted(65,80)withcolorOrange;label("original",(100,25));label("inset",(250,25));% END DRAWINGlabel.lft("MPT-06-006"infont"cmr8",(312,210));setboundscurrentpicturetounitsquarexscaled320yscaled220;endfig;end.
This is MetaPost, version 3.00 (TeX Live 2026) (kpathsea version 6.4.2)
(/usr/local/texlive/2026/texmf-dist/metapost/base/mpost.mp
(/usr/local/texlive/2026/texmf-dist/metapost/base/plain.mp
Preloading the plain mem file, version 1.005) ) (./MPT-07-001.mp [1{psfonts.map
}<cmr8.pfb>] )
1 output file written: MPT-07-001.svg
Transcript written on MPT-07-001.log.
Command or parameter
Meaning
quartercircle
Use a circular arc as a tile motif.
mod 2
Choose one of two orientations deterministically.
Centre before rotation
Keep each tile within its cell.
Complete standalone MetaPost program
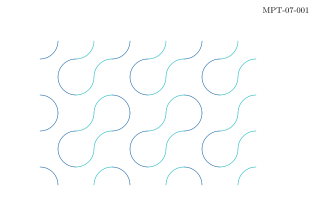
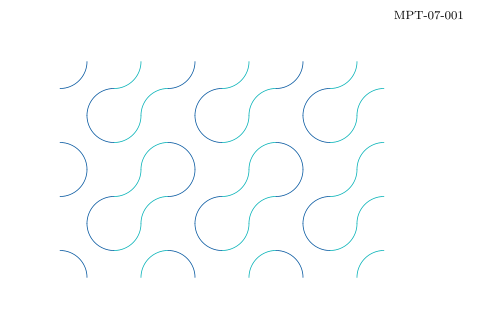
prologues:=3;outputformat:="svg";defaultfont:="cmr10";defaultscale:=1.1;colorBlue,Teal,Orange,Green,Grey,Light,Wash;Blue:=(0,84/255,159/255);Teal:=(0,177/255,183/255);Orange:=(246/255,168/255,0);Green:=(87/255,171/255,39/255);Grey:=(100/255,101/255,103/255);Light:=(236/255,236/255,237/255);Wash:=(232/255,241/255,250/255);% Format displayed numbers to hundredths using integer strings.vardefnumlabel(exprvalue)=saven,whole,frac;numericn,whole,frac;n:=round(100absvalue);whole:=floor(n/100);frac:=nmod100;(ifvalue<-.005:"-" & fidecimalwholeiffrac>0: & "." & iffrac<10:"0" & fidecimalfracfi)enddef;pickuppencirclescaled.9;outputtemplate:="MPT-07-001.svg";beginfig(1);fillunitsquarexscaled320yscaled220withcolorwhite;% BEGIN DRAWINGpicturetile;tile:=image(drawquartercirclescaled36;drawquartercirclescaled36rotated180shifted(36,36););fori=0upto5:forj=0upto3:drawtileshifted(-18,-18)rotated(90*((i+j+i*j)mod2))shifted(58+36i,53+36j)withcolor((imod2)[Blue,Teal]);endforendfor% END DRAWINGlabel.lft("MPT-07-001"infont"cmr8",(312,210));setboundscurrentpicturetounitsquarexscaled320yscaled220;endfig;end.
This is MetaPost, version 3.00 (TeX Live 2026) (kpathsea version 6.4.2)
(/usr/local/texlive/2026/texmf-dist/metapost/base/mpost.mp
(/usr/local/texlive/2026/texmf-dist/metapost/base/plain.mp
Preloading the plain mem file, version 1.005) ) (./MPT-07-002.mp [1{psfonts.map
}<cmr8.pfb>] )
1 output file written: MPT-07-002.svg
Transcript written on MPT-07-002.log.
Command or parameter
Meaning
rotated a
A full turn divided into eighteen copies.
One path
All petals share exactly the same local construction.
Complete standalone MetaPost program
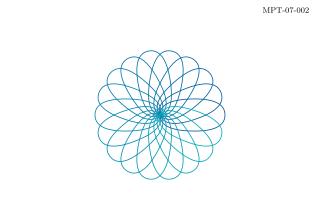
prologues:=3;outputformat:="svg";defaultfont:="cmr10";defaultscale:=1.1;colorBlue,Teal,Orange,Green,Grey,Light,Wash;Blue:=(0,84/255,159/255);Teal:=(0,177/255,183/255);Orange:=(246/255,168/255,0);Green:=(87/255,171/255,39/255);Grey:=(100/255,101/255,103/255);Light:=(236/255,236/255,237/255);Wash:=(232/255,241/255,250/255);% Format displayed numbers to hundredths using integer strings.vardefnumlabel(exprvalue)=saven,whole,frac;numericn,whole,frac;n:=round(100absvalue);whole:=floor(n/100);frac:=nmod100;(ifvalue<-.005:"-" & fidecimalwholeiffrac>0: & "." & iffrac<10:"0" & fidecimalfracfi)enddef;pickuppencirclescaled.9;outputtemplate:="MPT-07-002.svg";beginfig(1);fillunitsquarexscaled320yscaled220withcolorwhite;% BEGIN DRAWINGpathpetal;petal:=(0,0)..(30,16)..(65,0)..(30,-16)..cycle;fora=0step20until340:drawpetalrotatedashifted(160,105)withpenpencirclescaled.8withcolor(a/360)[Blue,Teal];endfor% END DRAWINGlabel.lft("MPT-07-002"infont"cmr8",(312,210));setboundscurrentpicturetounitsquarexscaled320yscaled220;endfig;end.
This is MetaPost, version 3.00 (TeX Live 2026) (kpathsea version 6.4.2)
(/usr/local/texlive/2026/texmf-dist/metapost/base/mpost.mp
(/usr/local/texlive/2026/texmf-dist/metapost/base/plain.mp
Preloading the plain mem file, version 1.005) ) (./MPT-07-003.mp [1{psfonts.map
}<cmr8.pfb>] )
1 output file written: MPT-07-003.svg
Transcript written on MPT-07-003.log.
Command or parameter
Meaning
vardef
Define a function returning a pair.
sind
Use degree-based trigonometry for the displacement.
Connectivity
Transform vertices while retaining the same row and column relationships.
Complete standalone MetaPost program
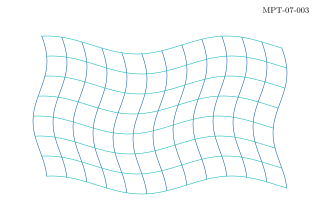
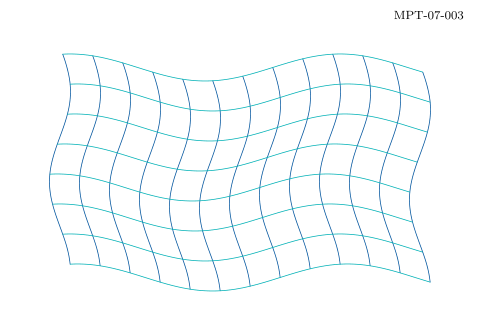
prologues:=3;outputformat:="svg";defaultfont:="cmr10";defaultscale:=1.1;colorBlue,Teal,Orange,Green,Grey,Light,Wash;Blue:=(0,84/255,159/255);Teal:=(0,177/255,183/255);Orange:=(246/255,168/255,0);Green:=(87/255,171/255,39/255);Grey:=(100/255,101/255,103/255);Light:=(236/255,236/255,237/255);Wash:=(232/255,241/255,250/255);% Format displayed numbers to hundredths using integer strings.vardefnumlabel(exprvalue)=saven,whole,frac;numericn,whole,frac;n:=round(100absvalue);whole:=floor(n/100);frac:=nmod100;(ifvalue<-.005:"-" & fidecimalwholeiffrac>0: & "." & iffrac<10:"0" & fidecimalfracfi)enddef;pickuppencirclescaled.9;outputtemplate:="MPT-07-003.svg";beginfig(1);fillunitsquarexscaled320yscaled220withcolorwhite;% BEGIN DRAWINGvardefwarp(exprx,y)=(x+7sind(3y),y+9sind(2x))enddef;fori=0upto12:drawforj=0upto14:ifj>0:..fiwarp(40+20i,35+10j)endforwithcolorBlue;endforforj=0upto7:drawfori=0upto24:ifi>0:..fiwarp(40+10i,35+20j)endforwithcolorTeal;endfor% END DRAWINGlabel.lft("MPT-07-003"infont"cmr8",(312,210));setboundscurrentpicturetounitsquarexscaled320yscaled220;endfig;end.
This is MetaPost, version 3.00 (TeX Live 2026) (kpathsea version 6.4.2)
(/usr/local/texlive/2026/texmf-dist/metapost/base/mpost.mp
(/usr/local/texlive/2026/texmf-dist/metapost/base/plain.mp
Preloading the plain mem file, version 1.005) ) (./MPT-07-004.mp [1{psfonts.map
}<cmr8.pfb>] )
1 output file written: MPT-07-004.svg
Transcript written on MPT-07-004.log.
Command or parameter
Meaning
Two centres
Offset identical families by forty drawing units.
Thin pens
Avoid filling the small spaces that form the visible bands.
Complete standalone MetaPost program
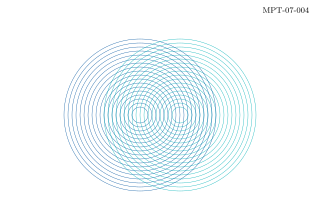
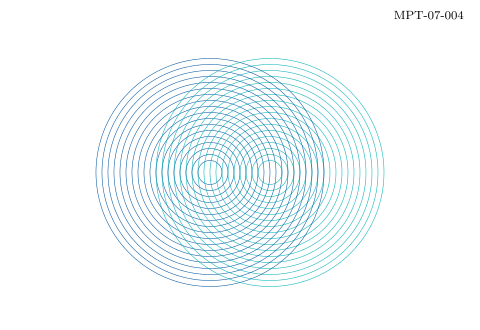
prologues:=3;outputformat:="svg";defaultfont:="cmr10";defaultscale:=1.1;colorBlue,Teal,Orange,Green,Grey,Light,Wash;Blue:=(0,84/255,159/255);Teal:=(0,177/255,183/255);Orange:=(246/255,168/255,0);Green:=(87/255,171/255,39/255);Grey:=(100/255,101/255,103/255);Light:=(236/255,236/255,237/255);Wash:=(232/255,241/255,250/255);% Format displayed numbers to hundredths using integer strings.vardefnumlabel(exprvalue)=saven,whole,frac;numericn,whole,frac;n:=round(100absvalue);whole:=floor(n/100);frac:=nmod100;(ifvalue<-.005:"-" & fidecimalwholeiffrac>0: & "." & iffrac<10:"0" & fidecimalfracfi)enddef;pickuppencirclescaled.9;outputtemplate:="MPT-07-004.svg";beginfig(1);fillunitsquarexscaled320yscaled220withcolorwhite;% BEGIN DRAWINGforr=8step4until76:drawfullcirclescaled(2r)shifted(140,105)withpenpencirclescaled.35withcolorBlue;drawfullcirclescaled(2r)shifted(180,105)withpenpencirclescaled.35withcolorTeal;endfor% END DRAWINGlabel.lft("MPT-07-004"infont"cmr8",(312,210));setboundscurrentpicturetounitsquarexscaled320yscaled220;endfig;end.
This is MetaPost, version 3.00 (TeX Live 2026) (kpathsea version 6.4.2)
(/usr/local/texlive/2026/texmf-dist/metapost/base/mpost.mp
(/usr/local/texlive/2026/texmf-dist/metapost/base/plain.mp
Preloading the plain mem file, version 1.005) ) (./MPT-07-005.mp [1{psfonts.map
}<cmr8.pfb>] )
1 output file written: MPT-07-005.svg
Transcript written on MPT-07-005.log.
Command or parameter
Meaning
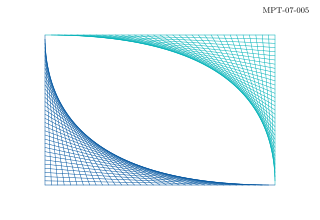
One parameter
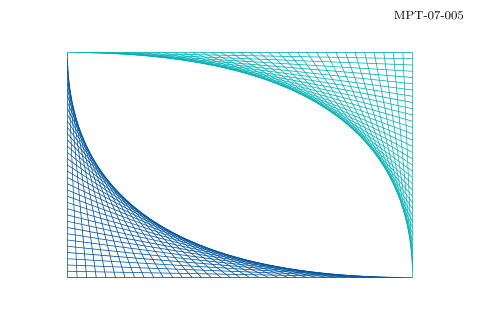
Move two endpoints at the same rate along different edges.
Straight segments
The curved appearance comes from the family, not a spline primitive.
Complete standalone MetaPost program
prologues:=3;outputformat:="svg";defaultfont:="cmr10";defaultscale:=1.1;colorBlue,Teal,Orange,Green,Grey,Light,Wash;Blue:=(0,84/255,159/255);Teal:=(0,177/255,183/255);Orange:=(246/255,168/255,0);Green:=(87/255,171/255,39/255);Grey:=(100/255,101/255,103/255);Light:=(236/255,236/255,237/255);Wash:=(232/255,241/255,250/255);% Format displayed numbers to hundredths using integer strings.vardefnumlabel(exprvalue)=saven,whole,frac;numericn,whole,frac;n:=round(100absvalue);whole:=floor(n/100);frac:=nmod100;(ifvalue<-.005:"-" & fidecimalwholeiffrac>0: & "." & iffrac<10:"0" & fidecimalfracfi)enddef;pickuppencirclescaled.9;outputtemplate:="MPT-07-005.svg";beginfig(1);fillunitsquarexscaled320yscaled220withcolorwhite;% BEGIN DRAWINGfork=0upto36:t:=k/36;draw(45+230t,35)--(45,185-150t)withpenpencirclescaled.5withcolorBlue;draw(275-230t,185)--(275,35+150t)withpenpencirclescaled.5withcolorTeal;endfor% END DRAWINGlabel.lft("MPT-07-005"infont"cmr8",(312,210));setboundscurrentpicturetounitsquarexscaled320yscaled220;endfig;end.
This is MetaPost, version 3.00 (TeX Live 2026) (kpathsea version 6.4.2)
(/usr/local/texlive/2026/texmf-dist/metapost/base/mpost.mp
(/usr/local/texlive/2026/texmf-dist/metapost/base/plain.mp
Preloading the plain mem file, version 1.005) ) (./MPT-07-006.mp [1{psfonts.map
}<cmr8.pfb>] )
1 output file written: MPT-07-006.svg
Transcript written on MPT-07-006.log.
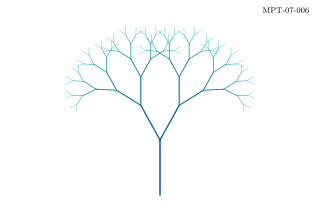
Command or parameter
Meaning
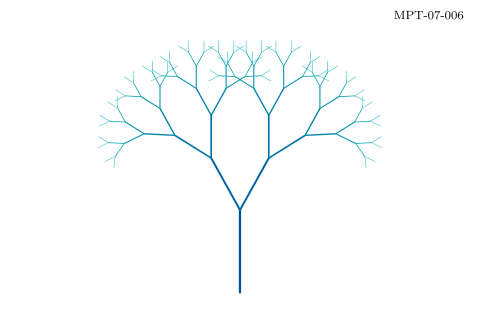
begingroup / save
Give each recursive call its own temporary point.
depth-1
Guarantee termination.
Scaled length
The geometric decay controls the overall size of the tree.
Complete standalone MetaPost program
prologues:=3;outputformat:="svg";defaultfont:="cmr10";defaultscale:=1.1;colorBlue,Teal,Orange,Green,Grey,Light,Wash;Blue:=(0,84/255,159/255);Teal:=(0,177/255,183/255);Orange:=(246/255,168/255,0);Green:=(87/255,171/255,39/255);Grey:=(100/255,101/255,103/255);Light:=(236/255,236/255,237/255);Wash:=(232/255,241/255,250/255);% Format displayed numbers to hundredths using integer strings.vardefnumlabel(exprvalue)=saven,whole,frac;numericn,whole,frac;n:=round(100absvalue);whole:=floor(n/100);frac:=nmod100;(ifvalue<-.005:"-" & fidecimalwholeiffrac>0: & "." & iffrac<10:"0" & fidecimalfracfi)enddef;pickuppencirclescaled.9;outputtemplate:="MPT-07-006.svg";beginfig(1);fillunitsquarexscaled320yscaled220withcolorwhite;% BEGIN DRAWINGdefbranch(exprbase,ang,len,depth)=begingroupsavetip;pairtip;tip:=base+len*dirang;drawbase--tipwithpenpencirclescaled(.2depth+.3)withcolor(depth/6)[Teal,Blue];ifdepth>0:branch(tip,ang+29,.72len,depth-1);branch(tip,ang-29,.72len,depth-1);fiendgroupenddef;branch((160,25),90,55,6);% END DRAWINGlabel.lft("MPT-07-006"infont"cmr8",(312,210));setboundscurrentpicturetounitsquarexscaled320yscaled220;endfig;end.
This is MetaPost, version 3.00 (TeX Live 2026) (kpathsea version 6.4.2)
(/usr/local/texlive/2026/texmf-dist/metapost/base/mpost.mp
(/usr/local/texlive/2026/texmf-dist/metapost/base/plain.mp
Preloading the plain mem file, version 1.005) ) (./MPT-08-001.mp [1{psfonts.map
}<cmr10.pfb><cmr8.pfb>] )
1 output file written: MPT-08-001.svg
Transcript written on MPT-08-001.log.
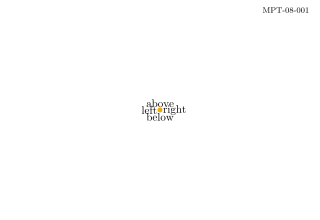
Command or parameter
Meaning
label suffix
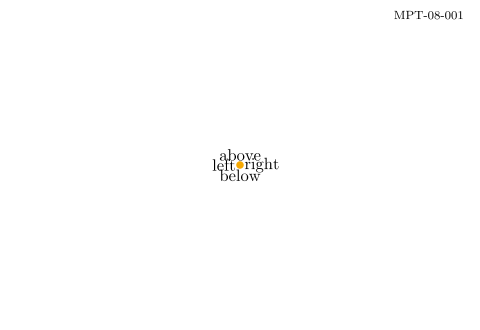
Select top, bottom, left or right placement.
Shared anchor
Text alignment can change without moving the anchor.
Complete standalone MetaPost program
prologues:=3;outputformat:="svg";defaultfont:="cmr10";defaultscale:=1.1;colorBlue,Teal,Orange,Green,Grey,Light,Wash;Blue:=(0,84/255,159/255);Teal:=(0,177/255,183/255);Orange:=(246/255,168/255,0);Green:=(87/255,171/255,39/255);Grey:=(100/255,101/255,103/255);Light:=(236/255,236/255,237/255);Wash:=(232/255,241/255,250/255);% Format displayed numbers to hundredths using integer strings.vardefnumlabel(exprvalue)=saven,whole,frac;numericn,whole,frac;n:=round(100absvalue);whole:=floor(n/100);frac:=nmod100;(ifvalue<-.005:"-" & fidecimalwholeiffrac>0: & "." & iffrac<10:"0" & fidecimalfracfi)enddef;pickuppencirclescaled.9;outputtemplate:="MPT-08-001.svg";beginfig(1);fillunitsquarexscaled320yscaled220withcolorwhite;% BEGIN DRAWINGfillfullcirclescaled5shifted(160,110)withcolorOrange;label.top("above",(160,110));label.bot("below",(160,110));label.lft("left",(160,110));label.rt("right",(160,110));% END DRAWINGlabel.lft("MPT-08-001"infont"cmr8",(312,210));setboundscurrentpicturetounitsquarexscaled320yscaled220;endfig;end.
This is MetaPost, version 3.00 (TeX Live 2026) (kpathsea version 6.4.2)
(/usr/local/texlive/2026/texmf-dist/metapost/base/mpost.mp
(/usr/local/texlive/2026/texmf-dist/metapost/base/plain.mp
Preloading the plain mem file, version 1.005) ) (./MPT-08-002.mp [1{psfonts.map
}<cmmi10.pfb><cmr7.pfb><cmr10.pfb><cmex10.pfb><cmmi7.pfb><cmr8.pfb>] )
1 output file written: MPT-08-002.svg
Transcript written on MPT-08-002.log.
Command or parameter
Meaning
btex ... etex
Create a TeX typeset picture.
Outlined glyphs
prologues=3 preserves the native letterforms in the SVG.
Complete standalone MetaPost program
prologues:=3;outputformat:="svg";defaultfont:="cmr10";defaultscale:=1.1;colorBlue,Teal,Orange,Green,Grey,Light,Wash;Blue:=(0,84/255,159/255);Teal:=(0,177/255,183/255);Orange:=(246/255,168/255,0);Green:=(87/255,171/255,39/255);Grey:=(100/255,101/255,103/255);Light:=(236/255,236/255,237/255);Wash:=(232/255,241/255,250/255);% Format displayed numbers to hundredths using integer strings.vardefnumlabel(exprvalue)=saven,whole,frac;numericn,whole,frac;n:=round(100absvalue);whole:=floor(n/100);frac:=nmod100;(ifvalue<-.005:"-" & fidecimalwholeiffrac>0: & "." & iffrac<10:"0" & fidecimalfracfi)enddef;pickuppencirclescaled.9;outputtemplate:="MPT-08-002.svg";beginfig(1);fillunitsquarexscaled320yscaled220withcolorwhite;% BEGIN DRAWINGlabel(btex $a^2+b^2=c^2$ etex,(160,145));label(btex $\int_0^\pi \sin(t)\,dt=2$ etex,(160,85));draw(55,110)--(265,110)withcolorLight;% END DRAWINGlabel.lft("MPT-08-002"infont"cmr8",(312,210));setboundscurrentpicturetounitsquarexscaled320yscaled220;endfig;end.
picturecaption;caption:=btex A measured label etexscaled1.6;caption:=captionshifted((160,110)-.5[llcornercaption,urcornercaption]);bboxmargin:=9;fillbboxcaptionwithcolorWash;drawbboxcaptionwithcolorBlue;drawcaption;
Actual output
MPT-08-003 · Rendered by MetaPost
MetaPost · exit 0
Native compiler log
Standard output
This is MetaPost, version 3.00 (TeX Live 2026) (kpathsea version 6.4.2)
(/usr/local/texlive/2026/texmf-dist/metapost/base/mpost.mp
(/usr/local/texlive/2026/texmf-dist/metapost/base/plain.mp
Preloading the plain mem file, version 1.005) ) (./MPT-08-003.mp [1{psfonts.map
}<cmr10.pfb><cmr8.pfb>] )
1 output file written: MPT-08-003.svg
Transcript written on MPT-08-003.log.
Command or parameter
Meaning
infont
Turn text into a picture with the selected font.
llcorner / urcorner
Read the actual picture bounds.
bboxmargin
Add a consistent margin around its bounding box.
Complete standalone MetaPost program
prologues:=3;outputformat:="svg";defaultfont:="cmr10";defaultscale:=1.1;colorBlue,Teal,Orange,Green,Grey,Light,Wash;Blue:=(0,84/255,159/255);Teal:=(0,177/255,183/255);Orange:=(246/255,168/255,0);Green:=(87/255,171/255,39/255);Grey:=(100/255,101/255,103/255);Light:=(236/255,236/255,237/255);Wash:=(232/255,241/255,250/255);% Format displayed numbers to hundredths using integer strings.vardefnumlabel(exprvalue)=saven,whole,frac;numericn,whole,frac;n:=round(100absvalue);whole:=floor(n/100);frac:=nmod100;(ifvalue<-.005:"-" & fidecimalwholeiffrac>0: & "." & iffrac<10:"0" & fidecimalfracfi)enddef;pickuppencirclescaled.9;outputtemplate:="MPT-08-003.svg";beginfig(1);fillunitsquarexscaled320yscaled220withcolorwhite;% BEGIN DRAWINGpicturecaption;caption:=btex A measured label etexscaled1.6;caption:=captionshifted((160,110)-.5[llcornercaption,urcornercaption]);bboxmargin:=9;fillbboxcaptionwithcolorWash;drawbboxcaptionwithcolorBlue;drawcaption;% END DRAWINGlabel.lft("MPT-08-003"infont"cmr8",(312,210));setboundscurrentpicturetounitsquarexscaled320yscaled220;endfig;end.
This is MetaPost, version 3.00 (TeX Live 2026) (kpathsea version 6.4.2)
(/usr/local/texlive/2026/texmf-dist/metapost/base/mpost.mp
(/usr/local/texlive/2026/texmf-dist/metapost/base/plain.mp
Preloading the plain mem file, version 1.005) ) (./MPT-08-004.mp [1{psfonts.map
}<cmr10.pfb><cmr8.pfb>] )
1 output file written: MPT-08-004.svg
Transcript written on MPT-08-004.log.
Command or parameter
Meaning
cutbefore / cutafter
Trim an open path where it meets the node boundaries.
ahlength
Choose arrowhead length.
Node paths
Reuse the boundaries for both drawing and intersection calculations.
Complete standalone MetaPost program
prologues:=3;outputformat:="svg";defaultfont:="cmr10";defaultscale:=1.1;colorBlue,Teal,Orange,Green,Grey,Light,Wash;Blue:=(0,84/255,159/255);Teal:=(0,177/255,183/255);Orange:=(246/255,168/255,0);Green:=(87/255,171/255,39/255);Grey:=(100/255,101/255,103/255);Light:=(236/255,236/255,237/255);Wash:=(232/255,241/255,250/255);% Format displayed numbers to hundredths using integer strings.vardefnumlabel(exprvalue)=saven,whole,frac;numericn,whole,frac;n:=round(100absvalue);whole:=floor(n/100);frac:=nmod100;(ifvalue<-.005:"-" & fidecimalwholeiffrac>0: & "." & iffrac<10:"0" & fidecimalfracfi)enddef;pickuppencirclescaled.9;outputtemplate:="MPT-08-004.svg";beginfig(1);fillunitsquarexscaled320yscaled220withcolorwhite;% BEGIN DRAWINGpaira,b,c;pathna,nb,nc;a:=(60,140);b:=(260,140);c:=(160,50);na:=fullcirclescaled48shifteda;nb:=fullcirclescaled48shiftedb;nc:=fullcirclescaled48shiftedc;forp=na,nb,nc:fillpwithcolorWash;drawpwithcolorBlue;endforahlength:=5;drawarrow((a--b)cutbeforenacutafternb)withcolorBlue;drawarrow((b--c)cutbeforenbcutafternc)withcolorBlue;drawarrow((c--a)cutbeforenccutafterna)withcolorBlue;drawarrow(60,164)..(160,195)..(260,164)withcolorTeal;label("observe",a);label("model",b);label("test",c);% END DRAWINGlabel.lft("MPT-08-004"infont"cmr8",(312,210));setboundscurrentpicturetounitsquarexscaled320yscaled220;endfig;end.
This is MetaPost, version 3.00 (TeX Live 2026) (kpathsea version 6.4.2)
(/usr/local/texlive/2026/texmf-dist/metapost/base/mpost.mp
(/usr/local/texlive/2026/texmf-dist/metapost/base/plain.mp
Preloading the plain mem file, version 1.005) ) (./MPT-08-005.mp [1{psfonts.map
}<cmr10.pfb><cmr8.pfb>] )
1 output file written: MPT-08-005.svg
Transcript written on MPT-08-005.log.
Command or parameter
Meaning
drawdblarrow
Put an arrowhead at both ends of a dimension line.
abs(b-a)
Calculate the displayed length from the original geometry.
Complete standalone MetaPost program
prologues:=3;outputformat:="svg";defaultfont:="cmr10";defaultscale:=1.1;colorBlue,Teal,Orange,Green,Grey,Light,Wash;Blue:=(0,84/255,159/255);Teal:=(0,177/255,183/255);Orange:=(246/255,168/255,0);Green:=(87/255,171/255,39/255);Grey:=(100/255,101/255,103/255);Light:=(236/255,236/255,237/255);Wash:=(232/255,241/255,250/255);% Format displayed numbers to hundredths using integer strings.vardefnumlabel(exprvalue)=saven,whole,frac;numericn,whole,frac;n:=round(100absvalue);whole:=floor(n/100);frac:=nmod100;(ifvalue<-.005:"-" & fidecimalwholeiffrac>0: & "." & iffrac<10:"0" & fidecimalfracfi)enddef;pickuppencirclescaled.9;outputtemplate:="MPT-08-005.svg";beginfig(1);fillunitsquarexscaled320yscaled220withcolorwhite;% BEGIN DRAWINGpaira,b;a:=(60,75);b:=(260,75);drawa--bwithpenpencirclescaled2withcolorBlue;draw(a-(0,10))--(a+(0,70))withcolorGrey;draw(b-(0,10))--(b+(0,70))withcolorGrey;drawdblarrow(a+(0,50))--(b+(0,50))withcolorTeal;label.top(decimal(abs(b-a))&"u",.5[a,b]+(0,55));% END DRAWINGlabel.lft("MPT-08-005"infont"cmr8",(312,210));setboundscurrentpicturetounitsquarexscaled320yscaled220;endfig;end.
pathp;numerict;pairanchor,tangent;p:=(40,40)..(150,175)..(280,55);t:=arctime(.32arclengthp)ofp;anchor:=pointtofp;tangent:=unitvector(directiontofp);drawarrowpwithpenpencirclescaled1.5withcolorBlue;label(btex along the curve etexrotated(angletangent),anchor+14*(tangentrotated90));fillfullcirclescaled4shiftedanchorwithcolorOrange;
Actual output
MPT-08-006 · Rendered by MetaPost
MetaPost · exit 0
Native compiler log
Standard output
This is MetaPost, version 3.00 (TeX Live 2026) (kpathsea version 6.4.2)
(/usr/local/texlive/2026/texmf-dist/metapost/base/mpost.mp
(/usr/local/texlive/2026/texmf-dist/metapost/base/plain.mp
Preloading the plain mem file, version 1.005) ) (./MPT-08-006.mp [1{psfonts.map
}<cmr10.pfb><cmr8.pfb>] )
1 output file written: MPT-08-006.svg
Transcript written on MPT-08-006.log.
Command or parameter
Meaning
angle tangent
Obtain the tangent angle in degrees.
Normal offset
Rotate the unit tangent by ninety degrees to place the caption beside the path.
Complete standalone MetaPost program
prologues:=3;outputformat:="svg";defaultfont:="cmr10";defaultscale:=1.1;colorBlue,Teal,Orange,Green,Grey,Light,Wash;Blue:=(0,84/255,159/255);Teal:=(0,177/255,183/255);Orange:=(246/255,168/255,0);Green:=(87/255,171/255,39/255);Grey:=(100/255,101/255,103/255);Light:=(236/255,236/255,237/255);Wash:=(232/255,241/255,250/255);% Format displayed numbers to hundredths using integer strings.vardefnumlabel(exprvalue)=saven,whole,frac;numericn,whole,frac;n:=round(100absvalue);whole:=floor(n/100);frac:=nmod100;(ifvalue<-.005:"-" & fidecimalwholeiffrac>0: & "." & iffrac<10:"0" & fidecimalfracfi)enddef;pickuppencirclescaled.9;outputtemplate:="MPT-08-006.svg";beginfig(1);fillunitsquarexscaled320yscaled220withcolorwhite;% BEGIN DRAWINGpathp;numerict;pairanchor,tangent;p:=(40,40)..(150,175)..(280,55);t:=arctime(.32arclengthp)ofp;anchor:=pointtofp;tangent:=unitvector(directiontofp);drawarrowpwithpenpencirclescaled1.5withcolorBlue;label(btex along the curve etexrotated(angletangent),anchor+14*(tangentrotated90));fillfullcirclescaled4shiftedanchorwithcolorOrange;% END DRAWINGlabel.lft("MPT-08-006"infont"cmr8",(312,210));setboundscurrentpicturetounitsquarexscaled320yscaled220;endfig;end.
This is MetaPost, version 3.00 (TeX Live 2026) (kpathsea version 6.4.2)
(/usr/local/texlive/2026/texmf-dist/metapost/base/mpost.mp
(/usr/local/texlive/2026/texmf-dist/metapost/base/plain.mp
Preloading the plain mem file, version 1.005) ) (./MPT-09-001.mp [1{psfonts.map
}<cmr10.pfb><cmr8.pfb>] )
1 output file written: MPT-09-001.svg
Transcript written on MPT-09-001.log.
Command or parameter
Meaning
P(x,y)
Map data values onto the plot rectangle.
Sampling step
Three-degree samples approximate the analytic sine curve.
sind
Evaluate sine in degrees.
Complete standalone MetaPost program
prologues:=3;outputformat:="svg";defaultfont:="cmr10";defaultscale:=1.1;colorBlue,Teal,Orange,Green,Grey,Light,Wash;Blue:=(0,84/255,159/255);Teal:=(0,177/255,183/255);Orange:=(246/255,168/255,0);Green:=(87/255,171/255,39/255);Grey:=(100/255,101/255,103/255);Light:=(236/255,236/255,237/255);Wash:=(232/255,241/255,250/255);% Format displayed numbers to hundredths using integer strings.vardefnumlabel(exprvalue)=saven,whole,frac;numericn,whole,frac;n:=round(100absvalue);whole:=floor(n/100);frac:=nmod100;(ifvalue<-.005:"-" & fidecimalwholeiffrac>0: & "." & iffrac<10:"0" & fidecimalfracfi)enddef;pickuppencirclescaled.9;outputtemplate:="MPT-09-001.svg";beginfig(1);fillunitsquarexscaled320yscaled220withcolorwhite;% BEGIN DRAWINGnumericxmin,xmax,ymin,ymax,xx,yy;xmin:=0;xmax:=360;ymin:=-1.2;ymax:=1.2;vardefP(exprx,y)=(40+250*(x-xmin)/(xmax-xmin),35+145*(y-ymin)/(ymax-ymin))enddef;fori=0upto4:xx:=xmin+i*(xmax-xmin)/4;yy:=ymin+i*(ymax-ymin)/4;drawP(xx,ymin)--P(xx,ymax)withcolorLight;drawP(xmin,yy)--P(xmax,yy)withcolorLight;label.bot(numlabel(xx),P(xx,ymin));label.lft(numlabel(yy),P(xmin,yy));endfordrawP(xmin,ymax)--P(xmin,ymin)--P(xmax,ymin)withcolorGrey;drawfora=0step3until360:ifa>0:--fiP(a,sinda)endforwithpenpencirclescaled1.6withcolorBlue;% END DRAWINGlabel.lft("MPT-09-001"infont"cmr8",(312,210));setboundscurrentpicturetounitsquarexscaled320yscaled220;endfig;end.
This is MetaPost, version 3.00 (TeX Live 2026) (kpathsea version 6.4.2)
(/usr/local/texlive/2026/texmf-dist/metapost/base/mpost.mp
(/usr/local/texlive/2026/texmf-dist/metapost/base/plain.mp
Preloading the plain mem file, version 1.005) ) (./MPT-09-002.mp [1{psfonts.map
}<cmr10.pfb><cmr8.pfb>] )
1 output file written: MPT-09-002.svg
Transcript written on MPT-09-002.log.
Command or parameter
Meaning
Shared ranges
Make both curves use the same coordinate map.
cosd
The cosine counterpart of sind.
Colour and dashes
Use redundant visual distinctions for the two series.
Complete standalone MetaPost program
prologues:=3;outputformat:="svg";defaultfont:="cmr10";defaultscale:=1.1;colorBlue,Teal,Orange,Green,Grey,Light,Wash;Blue:=(0,84/255,159/255);Teal:=(0,177/255,183/255);Orange:=(246/255,168/255,0);Green:=(87/255,171/255,39/255);Grey:=(100/255,101/255,103/255);Light:=(236/255,236/255,237/255);Wash:=(232/255,241/255,250/255);% Format displayed numbers to hundredths using integer strings.vardefnumlabel(exprvalue)=saven,whole,frac;numericn,whole,frac;n:=round(100absvalue);whole:=floor(n/100);frac:=nmod100;(ifvalue<-.005:"-" & fidecimalwholeiffrac>0: & "." & iffrac<10:"0" & fidecimalfracfi)enddef;pickuppencirclescaled.9;outputtemplate:="MPT-09-002.svg";beginfig(1);fillunitsquarexscaled320yscaled220withcolorwhite;% BEGIN DRAWINGnumericxmin,xmax,ymin,ymax,xx,yy;xmin:=0;xmax:=360;ymin:=-1.2;ymax:=1.2;vardefP(exprx,y)=(40+250*(x-xmin)/(xmax-xmin),35+145*(y-ymin)/(ymax-ymin))enddef;fori=0upto4:xx:=xmin+i*(xmax-xmin)/4;yy:=ymin+i*(ymax-ymin)/4;drawP(xx,ymin)--P(xx,ymax)withcolorLight;drawP(xmin,yy)--P(xmax,yy)withcolorLight;label.bot(numlabel(xx),P(xx,ymin));label.lft(numlabel(yy),P(xmin,yy));endfordrawP(xmin,ymax)--P(xmin,ymin)--P(xmax,ymin)withcolorGrey;drawfora=0step3until360:ifa>0:--fiP(a,sinda)endforwithpenpencirclescaled1.6withcolorBlue;drawfora=0step3until360:ifa>0:--fiP(a,cosda)endfordashedevenlywithpenpencirclescaled1.4withcolorTeal;label("sin",(95,195))withcolorBlue;label("cos",(225,195))withcolorTeal;% END DRAWINGlabel.lft("MPT-09-002"infont"cmr8",(312,210));setboundscurrentpicturetounitsquarexscaled320yscaled220;endfig;end.
This is MetaPost, version 3.00 (TeX Live 2026) (kpathsea version 6.4.2)
(/usr/local/texlive/2026/texmf-dist/metapost/base/mpost.mp
(/usr/local/texlive/2026/texmf-dist/metapost/base/plain.mp
Preloading the plain mem file, version 1.005) ) (./MPT-09-003.mp [1{psfonts.map
}<cmr10.pfb><cmr8.pfb>] )
1 output file written: MPT-09-003.svg
Transcript written on MPT-09-003.log.
Command or parameter
Meaning
.. between samples
Interpolate the knots with MetaPost cubic curves.
Dense analytic samples
Provide a reference rather than claiming interpolation recovers the original function.
Complete standalone MetaPost program
prologues:=3;outputformat:="svg";defaultfont:="cmr10";defaultscale:=1.1;colorBlue,Teal,Orange,Green,Grey,Light,Wash;Blue:=(0,84/255,159/255);Teal:=(0,177/255,183/255);Orange:=(246/255,168/255,0);Green:=(87/255,171/255,39/255);Grey:=(100/255,101/255,103/255);Light:=(236/255,236/255,237/255);Wash:=(232/255,241/255,250/255);% Format displayed numbers to hundredths using integer strings.vardefnumlabel(exprvalue)=saven,whole,frac;numericn,whole,frac;n:=round(100absvalue);whole:=floor(n/100);frac:=nmod100;(ifvalue<-.005:"-" & fidecimalwholeiffrac>0: & "." & iffrac<10:"0" & fidecimalfracfi)enddef;pickuppencirclescaled.9;outputtemplate:="MPT-09-003.svg";beginfig(1);fillunitsquarexscaled320yscaled220withcolorwhite;% BEGIN DRAWINGnumericxmin,xmax,ymin,ymax,xx,yy;xmin:=0;xmax:=360;ymin:=-1.2;ymax:=1.2;vardefP(exprx,y)=(40+250*(x-xmin)/(xmax-xmin),35+145*(y-ymin)/(ymax-ymin))enddef;fori=0upto4:xx:=xmin+i*(xmax-xmin)/4;yy:=ymin+i*(ymax-ymin)/4;drawP(xx,ymin)--P(xx,ymax)withcolorLight;drawP(xmin,yy)--P(xmax,yy)withcolorLight;label.bot(numlabel(xx),P(xx,ymin));label.lft(numlabel(yy),P(xmin,yy));endfordrawP(xmin,ymax)--P(xmin,ymin)--P(xmax,ymin)withcolorGrey;drawfora=0step60until360:ifa>0:..fiP(a,sinda)endfordashedevenlywithpenpencirclescaled1.5withcolorTeal;drawfora=0step3until360:ifa>0:--fiP(a,sinda)endforwithcolorBlue;fora=0step60until360:fillfullcirclescaled4shiftedP(a,sinda)withcolorOrange;endfor% END DRAWINGlabel.lft("MPT-09-003"infont"cmr8",(312,210));setboundscurrentpicturetounitsquarexscaled320yscaled220;endfig;end.
This synthetic band is an illustrative pair of bounds, not a statistical confidence interval. Construct its upper edge forward and its lower edge backwards.
This is MetaPost, version 3.00 (TeX Live 2026) (kpathsea version 6.4.2)
(/usr/local/texlive/2026/texmf-dist/metapost/base/mpost.mp
(/usr/local/texlive/2026/texmf-dist/metapost/base/plain.mp
Preloading the plain mem file, version 1.005) ) (./MPT-09-004.mp [1{psfonts.map
}<cmr10.pfb><cmr8.pfb>] )
1 output file written: MPT-09-004.svg
Transcript written on MPT-09-004.log.
Command or parameter
Meaning
Reversed lower edge
Close a polygon around the band without crossing diagonally through it.
m / w
Keep the centre and half-width as independent functions.
Complete standalone MetaPost program
prologues:=3;outputformat:="svg";defaultfont:="cmr10";defaultscale:=1.1;colorBlue,Teal,Orange,Green,Grey,Light,Wash;Blue:=(0,84/255,159/255);Teal:=(0,177/255,183/255);Orange:=(246/255,168/255,0);Green:=(87/255,171/255,39/255);Grey:=(100/255,101/255,103/255);Light:=(236/255,236/255,237/255);Wash:=(232/255,241/255,250/255);% Format displayed numbers to hundredths using integer strings.vardefnumlabel(exprvalue)=saven,whole,frac;numericn,whole,frac;n:=round(100absvalue);whole:=floor(n/100);frac:=nmod100;(ifvalue<-.005:"-" & fidecimalwholeiffrac>0: & "." & iffrac<10:"0" & fidecimalfracfi)enddef;pickuppencirclescaled.9;outputtemplate:="MPT-09-004.svg";beginfig(1);fillunitsquarexscaled320yscaled220withcolorwhite;% BEGIN DRAWINGnumericxmin,xmax,ymin,ymax,xx,yy;xmin:=0;xmax:=10;ymin:=0;ymax:=10;vardefP(exprx,y)=(40+250*(x-xmin)/(xmax-xmin),35+145*(y-ymin)/(ymax-ymin))enddef;fori=0upto4:xx:=xmin+i*(xmax-xmin)/4;yy:=ymin+i*(ymax-ymin)/4;drawP(xx,ymin)--P(xx,ymax)withcolorLight;drawP(xmin,yy)--P(xmax,yy)withcolorLight;label.bot(numlabel(xx),P(xx,ymin));label.lft(numlabel(yy),P(xmin,yy));endfordrawP(xmin,ymax)--P(xmin,ymin)--P(xmax,ymin)withcolorGrey;vardefm(exprx)=4+1.8sind(30x)enddef;vardefw(exprx)=.6+.2cosd(40x)enddef;pathupper,lower;upper:=fori=0upto100:ifi>0:--fiP(i/10,m(i/10)+w(i/10))endfor;lower:=fori=100downto0:ifi<100:--fiP(i/10,m(i/10)-w(i/10))endfor;fillupper--lower--cyclewithcolorWash;drawfori=0upto100:ifi>0:--fiP(i/10,m(i/10))endforwithpenpencirclescaled1.8withcolorBlue;% END DRAWINGlabel.lft("MPT-09-004"infont"cmr8",(312,210));setboundscurrentpicturetounitsquarexscaled320yscaled220;endfig;end.
This is MetaPost, version 3.00 (TeX Live 2026) (kpathsea version 6.4.2)
(/usr/local/texlive/2026/texmf-dist/metapost/base/mpost.mp
(/usr/local/texlive/2026/texmf-dist/metapost/base/plain.mp
Preloading the plain mem file, version 1.005) ) (./MPT-09-005.mp [1{psfonts.map
}<cmr10.pfb><cmr8.pfb>] )
1 output file written: MPT-09-005.svg
Transcript written on MPT-09-005.log.
Command or parameter
Meaning
Parametric coordinates
x and y are separate periodic functions of a.
Phase shift
The second coordinate is offset by forty-five degrees.
Complete standalone MetaPost program
prologues:=3;outputformat:="svg";defaultfont:="cmr10";defaultscale:=1.1;colorBlue,Teal,Orange,Green,Grey,Light,Wash;Blue:=(0,84/255,159/255);Teal:=(0,177/255,183/255);Orange:=(246/255,168/255,0);Green:=(87/255,171/255,39/255);Grey:=(100/255,101/255,103/255);Light:=(236/255,236/255,237/255);Wash:=(232/255,241/255,250/255);% Format displayed numbers to hundredths using integer strings.vardefnumlabel(exprvalue)=saven,whole,frac;numericn,whole,frac;n:=round(100absvalue);whole:=floor(n/100);frac:=nmod100;(ifvalue<-.005:"-" & fidecimalwholeiffrac>0: & "." & iffrac<10:"0" & fidecimalfracfi)enddef;pickuppencirclescaled.9;outputtemplate:="MPT-09-005.svg";beginfig(1);fillunitsquarexscaled320yscaled220withcolorwhite;% BEGIN DRAWINGnumericxmin,xmax,ymin,ymax,xx,yy;xmin:=-1.2;xmax:=1.2;ymin:=-1.2;ymax:=1.2;vardefP(exprx,y)=(40+250*(x-xmin)/(xmax-xmin),35+145*(y-ymin)/(ymax-ymin))enddef;fori=0upto4:xx:=xmin+i*(xmax-xmin)/4;yy:=ymin+i*(ymax-ymin)/4;drawP(xx,ymin)--P(xx,ymax)withcolorLight;drawP(xmin,yy)--P(xmax,yy)withcolorLight;label.bot(numlabel(xx),P(xx,ymin));label.lft(numlabel(yy),P(xmin,yy));endfordrawP(xmin,ymax)--P(xmin,ymin)--P(xmax,ymin)withcolorGrey;pathp;p:=fora=0step2until358:ifa>0:--fiP(sind(3a),sind(2a+45))endfor--cycle;drawpwithpenpencirclescaled1.3withcolorBlue;fork=0step60until120:drawarrowsubpath(k,k+8)ofpwithcolorOrange;endfor% END DRAWINGlabel.lft("MPT-09-005"infont"cmr8",(312,210));setboundscurrentpicturetounitsquarexscaled320yscaled220;endfig;end.
This is MetaPost, version 3.00 (TeX Live 2026) (kpathsea version 6.4.2)
(/usr/local/texlive/2026/texmf-dist/metapost/base/mpost.mp
(/usr/local/texlive/2026/texmf-dist/metapost/base/plain.mp
Preloading the plain mem file, version 1.005) ) (./MPT-09-006.mp
check: area=3.0000000000000004 [1{psfonts.map}<cmr10.pfb><cmr8.pfb>] )
1 output file written: MPT-09-006.svg
Transcript written on MPT-09-006.log.
Command or parameter
Meaning
Closed area path
Join the sampled function to its zero baseline.
Trapezoidal rule
Add interval width times the mean of each pair of endpoint heights.
Complete standalone MetaPost program
prologues:=3;outputformat:="svg";defaultfont:="cmr10";defaultscale:=1.1;colorBlue,Teal,Orange,Green,Grey,Light,Wash;Blue:=(0,84/255,159/255);Teal:=(0,177/255,183/255);Orange:=(246/255,168/255,0);Green:=(87/255,171/255,39/255);Grey:=(100/255,101/255,103/255);Light:=(236/255,236/255,237/255);Wash:=(232/255,241/255,250/255);% Format displayed numbers to hundredths using integer strings.vardefnumlabel(exprvalue)=saven,whole,frac;numericn,whole,frac;n:=round(100absvalue);whole:=floor(n/100);frac:=nmod100;(ifvalue<-.005:"-" & fidecimalwholeiffrac>0: & "." & iffrac<10:"0" & fidecimalfracfi)enddef;pickuppencirclescaled.9;outputtemplate:="MPT-09-006.svg";beginfig(1);fillunitsquarexscaled320yscaled220withcolorwhite;% BEGIN DRAWINGnumericxmin,xmax,ymin,ymax,xx,yy;xmin:=0;xmax:=4;ymin:=0;ymax:=2;vardefP(exprx,y)=(40+250*(x-xmin)/(xmax-xmin),35+145*(y-ymin)/(ymax-ymin))enddef;fori=0upto4:xx:=xmin+i*(xmax-xmin)/4;yy:=ymin+i*(ymax-ymin)/4;drawP(xx,ymin)--P(xx,ymax)withcolorLight;drawP(xmin,yy)--P(xmax,yy)withcolorLight;label.bot(numlabel(xx),P(xx,ymin));label.lft(numlabel(yy),P(xmin,yy));endfordrawP(xmin,ymax)--P(xmin,ymin)--P(xmax,ymin)withcolorGrey;vardeff(exprx)=.3+.9*(sind(45x))*(sind(45x))enddef;pathp;numericarea;p:=P(0,0)--fori=0upto80:ifi>0:--fiP(i/20,f(i/20))endfor--P(4,0)--cycle;fillpwithcolorWash;drawfori=0upto80:ifi>0:--fiP(i/20,f(i/20))endforwithcolorBlue;area:=0;fori=1upto80:area:=area+(f((i-1)/20)+f(i/20))/40;endforlabel("Area="&numlabel(area),(165,195));message"check: area="&decimalarea;% END DRAWINGlabel.lft("MPT-09-006"infont"cmr8",(312,210));setboundscurrentpicturetounitsquarexscaled320yscaled220;endfig;end.
This is MetaPost, version 3.00 (TeX Live 2026) (kpathsea version 6.4.2)
(/usr/local/texlive/2026/texmf-dist/metapost/base/mpost.mp
(/usr/local/texlive/2026/texmf-dist/metapost/base/plain.mp
Preloading the plain mem file, version 1.005) ) (./MPT-10-001.mp [1{psfonts.map
}<cmr10.pfb><cmr8.pfb>] )
1 output file written: MPT-10-001.svg
Transcript written on MPT-10-001.log.
Command or parameter
Meaning
Rectangle bounds
Compute bar width in data units before mapping coordinates.
substring
Choose the category letter from a short string.
Complete standalone MetaPost program
prologues:=3;outputformat:="svg";defaultfont:="cmr10";defaultscale:=1.1;colorBlue,Teal,Orange,Green,Grey,Light,Wash;Blue:=(0,84/255,159/255);Teal:=(0,177/255,183/255);Orange:=(246/255,168/255,0);Green:=(87/255,171/255,39/255);Grey:=(100/255,101/255,103/255);Light:=(236/255,236/255,237/255);Wash:=(232/255,241/255,250/255);% Format displayed numbers to hundredths using integer strings.vardefnumlabel(exprvalue)=saven,whole,frac;numericn,whole,frac;n:=round(100absvalue);whole:=floor(n/100);frac:=nmod100;(ifvalue<-.005:"-" & fidecimalwholeiffrac>0: & "." & iffrac<10:"0" & fidecimalfracfi)enddef;pickuppencirclescaled.9;outputtemplate:="MPT-10-001.svg";beginfig(1);fillunitsquarexscaled320yscaled220withcolorwhite;% BEGIN DRAWINGnumericxmin,xmax,ymin,ymax,xx,yy;xmin:=0.5;xmax:=6.5;ymin:=0;ymax:=10;vardefP(exprx,y)=(40+250*(x-xmin)/(xmax-xmin),35+145*(y-ymin)/(ymax-ymin))enddef;fori=0upto4:xx:=xmin+i*(xmax-xmin)/4;yy:=ymin+i*(ymax-ymin)/4;drawP(xx,ymin)--P(xx,ymax)withcolorLight;drawP(xmin,yy)--P(xmax,yy)withcolorLight;label.lft(numlabel(yy),P(xmin,yy));endfordrawP(xmin,ymax)--P(xmin,ymin)--P(xmax,ymin)withcolorGrey;numericv[];v[1]:=3;v[2]:=7;v[3]:=5;v[4]:=9;v[5]:=6;v[6]:=8;fori=1upto6:fillP(i-.32,0)--P(i+.32,0)--P(i+.32,v[i])--P(i-.32,v[i])--cyclewithcolorBlue;label.bot(substring(i-1,i)of"ABCDEF",P(i,0));label.top(decimalv[i],P(i,v[i]));endfor% END DRAWINGlabel.lft("MPT-10-001"infont"cmr8",(312,210));setboundscurrentpicturetounitsquarexscaled320yscaled220;endfig;end.
numericxmin,xmax,ymin,ymax,xx,yy;xmin:=0;xmax:=9;ymin:=0;ymax:=9;vardefP(exprx,y)=(40+250*(x-xmin)/(xmax-xmin),35+145*(y-ymin)/(ymax-ymin))enddef;fori=0upto4:xx:=xmin+i*(xmax-xmin)/4;yy:=ymin+i*(ymax-ymin)/4;drawP(xx,ymin)--P(xx,ymax)withcolorLight;drawP(xmin,yy)--P(xmax,yy)withcolorLight;label.bot(numlabel(xx),P(xx,ymin));label.lft(numlabel(yy),P(xmin,yy));endfordrawP(xmin,ymax)--P(xmin,ymin)--P(xmax,ymin)withcolorGrey;numericv[];v[1]:=2.1;v[2]:=2.8;v[3]:=4.2;v[4]:=4.0;v[5]:=5.6;v[6]:=6.8;v[7]:=6.6;v[8]:=8.1;numericN,sx,sy,sxx,sxy,slope,intercept;N:=8;sx:=sy:=sxx:=sxy:=0;fori=1uptoN:sx:=sx+i;sy:=sy+v[i];sxx:=sxx+i*i;sxy:=sxy+i*v[i];fillfullcirclescaled5shiftedP(i,v[i])withcolorOrange;endforslope:=(N*sxy-sx*sy)/(N*sxx-sx*sx);intercept:=(sy-slope*sx)/N;drawP(0,intercept)--P(9,intercept+9slope)withcolorBlue;label(btex Least-squares fit etex,(165,195));message"check: slope="&decimalslope;
Actual output
MPT-10-002 · Rendered by MetaPost
MetaPost · exit 0
Native compiler log
Standard output
This is MetaPost, version 3.00 (TeX Live 2026) (kpathsea version 6.4.2)
(/usr/local/texlive/2026/texmf-dist/metapost/base/mpost.mp
(/usr/local/texlive/2026/texmf-dist/metapost/base/plain.mp
Preloading the plain mem file, version 1.005) ) (./MPT-10-002.mp
check: slope=0.83809523809523712 [1{psfonts.map}<cmr10.pfb><cmr8.pfb>] )
1 output file written: MPT-10-002.svg
Transcript written on MPT-10-002.log.
Command or parameter
Meaning
Summary sums
Accumulate x, y, x squared and x times y from the observations.
Slope / intercept
Use the standard straight-line least-squares formulas.
Complete standalone MetaPost program
prologues:=3;outputformat:="svg";defaultfont:="cmr10";defaultscale:=1.1;colorBlue,Teal,Orange,Green,Grey,Light,Wash;Blue:=(0,84/255,159/255);Teal:=(0,177/255,183/255);Orange:=(246/255,168/255,0);Green:=(87/255,171/255,39/255);Grey:=(100/255,101/255,103/255);Light:=(236/255,236/255,237/255);Wash:=(232/255,241/255,250/255);% Format displayed numbers to hundredths using integer strings.vardefnumlabel(exprvalue)=saven,whole,frac;numericn,whole,frac;n:=round(100absvalue);whole:=floor(n/100);frac:=nmod100;(ifvalue<-.005:"-" & fidecimalwholeiffrac>0: & "." & iffrac<10:"0" & fidecimalfracfi)enddef;pickuppencirclescaled.9;outputtemplate:="MPT-10-002.svg";beginfig(1);fillunitsquarexscaled320yscaled220withcolorwhite;% BEGIN DRAWINGnumericxmin,xmax,ymin,ymax,xx,yy;xmin:=0;xmax:=9;ymin:=0;ymax:=9;vardefP(exprx,y)=(40+250*(x-xmin)/(xmax-xmin),35+145*(y-ymin)/(ymax-ymin))enddef;fori=0upto4:xx:=xmin+i*(xmax-xmin)/4;yy:=ymin+i*(ymax-ymin)/4;drawP(xx,ymin)--P(xx,ymax)withcolorLight;drawP(xmin,yy)--P(xmax,yy)withcolorLight;label.bot(numlabel(xx),P(xx,ymin));label.lft(numlabel(yy),P(xmin,yy));endfordrawP(xmin,ymax)--P(xmin,ymin)--P(xmax,ymin)withcolorGrey;numericv[];v[1]:=2.1;v[2]:=2.8;v[3]:=4.2;v[4]:=4.0;v[5]:=5.6;v[6]:=6.8;v[7]:=6.6;v[8]:=8.1;numericN,sx,sy,sxx,sxy,slope,intercept;N:=8;sx:=sy:=sxx:=sxy:=0;fori=1uptoN:sx:=sx+i;sy:=sy+v[i];sxx:=sxx+i*i;sxy:=sxy+i*v[i];fillfullcirclescaled5shiftedP(i,v[i])withcolorOrange;endforslope:=(N*sxy-sx*sy)/(N*sxx-sx*sx);intercept:=(sy-slope*sx)/N;drawP(0,intercept)--P(9,intercept+9slope)withcolorBlue;label(btex Least-squares fit etex,(165,195));message"check: slope="&decimalslope;% END DRAWINGlabel.lft("MPT-10-002"infont"cmr8",(312,210));setboundscurrentpicturetounitsquarexscaled320yscaled220;endfig;end.
This is MetaPost, version 3.00 (TeX Live 2026) (kpathsea version 6.4.2)
(/usr/local/texlive/2026/texmf-dist/metapost/base/mpost.mp
(/usr/local/texlive/2026/texmf-dist/metapost/base/plain.mp
Preloading the plain mem file, version 1.005) ) (./MPT-10-003.mp
check: histogram-total=18 [1{psfonts.map}<cmr10.pfb><cmr8.pfb>] )
1 output file written: MPT-10-003.svg
Transcript written on MPT-10-003.log.
Command or parameter
Meaning
floor(value/2)+1
Assign these values to left-closed width-two bins.
Counts
The five frequencies sum to eighteen.
Complete standalone MetaPost program
prologues:=3;outputformat:="svg";defaultfont:="cmr10";defaultscale:=1.1;colorBlue,Teal,Orange,Green,Grey,Light,Wash;Blue:=(0,84/255,159/255);Teal:=(0,177/255,183/255);Orange:=(246/255,168/255,0);Green:=(87/255,171/255,39/255);Grey:=(100/255,101/255,103/255);Light:=(236/255,236/255,237/255);Wash:=(232/255,241/255,250/255);% Format displayed numbers to hundredths using integer strings.vardefnumlabel(exprvalue)=saven,whole,frac;numericn,whole,frac;n:=round(100absvalue);whole:=floor(n/100);frac:=nmod100;(ifvalue<-.005:"-" & fidecimalwholeiffrac>0: & "." & iffrac<10:"0" & fidecimalfracfi)enddef;pickuppencirclescaled.9;outputtemplate:="MPT-10-003.svg";beginfig(1);fillunitsquarexscaled320yscaled220withcolorwhite;% BEGIN DRAWINGnumericxmin,xmax,ymin,ymax,xx,yy;xmin:=0;xmax:=10;ymin:=0;ymax:=8;vardefP(exprx,y)=(40+250*(x-xmin)/(xmax-xmin),35+145*(y-ymin)/(ymax-ymin))enddef;fori=0upto4:xx:=xmin+i*(xmax-xmin)/4;yy:=ymin+i*(ymax-ymin)/4;drawP(xx,ymin)--P(xx,ymax)withcolorLight;drawP(xmin,yy)--P(xmax,yy)withcolorLight;label.bot(numlabel(xx),P(xx,ymin));label.lft(numlabel(yy),P(xmin,yy));endfordrawP(xmin,ymax)--P(xmin,ymin)--P(xmax,ymin)withcolorGrey;numericv[];v[1]:=1;v[2]:=2;v[3]:=2;v[4]:=2;v[5]:=3;v[6]:=3;v[7]:=4;v[8]:=4;v[9]:=4;v[10]:=5;v[11]:=5;v[12]:=5;v[13]:=5;v[14]:=6;v[15]:=7;v[16]:=8;v[17]:=8;v[18]:=9;numericcount[],total;forb=1upto5:count[b]:=0;endforfori=1upto18:b:=floor(v[i]/2)+1;count[b]:=count[b]+1;endfortotal:=0;forb=1upto5:total:=total+count[b];fillP(2b-2,0)--P(2b,0)--P(2b,count[b])--P(2b-2,count[b])--cyclewithcolor(b/6)[Blue,Teal];label.top(decimalcount[b],P(2b-1,count[b]));endformessage"check: histogram-total="&decimaltotal;% END DRAWINGlabel.lft("MPT-10-003"infont"cmr8",(312,210));setboundscurrentpicturetounitsquarexscaled320yscaled220;endfig;end.
This is MetaPost, version 3.00 (TeX Live 2026) (kpathsea version 6.4.2)
(/usr/local/texlive/2026/texmf-dist/metapost/base/mpost.mp
(/usr/local/texlive/2026/texmf-dist/metapost/base/plain.mp
Preloading the plain mem file, version 1.005) ) (./MPT-10-004.mp
check: quartiles=3.5,5.5,8 [1{psfonts.map}<cmr10.pfb><cmr8.pfb>] )
1 output file written: MPT-10-004.svg
Transcript written on MPT-10-004.log.
Command or parameter
Meaning
Sorting
Exchange neighbouring values until the sample is ordered.
Quartiles
This convention gives 3.5, 5.5 and 8.
Whiskers
Explicitly use minimum 2 and maximum 11.
Complete standalone MetaPost program
prologues:=3;outputformat:="svg";defaultfont:="cmr10";defaultscale:=1.1;colorBlue,Teal,Orange,Green,Grey,Light,Wash;Blue:=(0,84/255,159/255);Teal:=(0,177/255,183/255);Orange:=(246/255,168/255,0);Green:=(87/255,171/255,39/255);Grey:=(100/255,101/255,103/255);Light:=(236/255,236/255,237/255);Wash:=(232/255,241/255,250/255);% Format displayed numbers to hundredths using integer strings.vardefnumlabel(exprvalue)=saven,whole,frac;numericn,whole,frac;n:=round(100absvalue);whole:=floor(n/100);frac:=nmod100;(ifvalue<-.005:"-" & fidecimalwholeiffrac>0: & "." & iffrac<10:"0" & fidecimalfracfi)enddef;pickuppencirclescaled.9;outputtemplate:="MPT-10-004.svg";beginfig(1);fillunitsquarexscaled320yscaled220withcolorwhite;% BEGIN DRAWINGnumericv[];v[1]:=8;v[2]:=2;v[3]:=5;v[4]:=11;v[5]:=3;v[6]:=7;v[7]:=9;v[8]:=4;v[9]:=8;v[10]:=6;v[11]:=3;v[12]:=5;numericN,temp,qone,median,qthree;N:=12;forpass=1uptoN-1:fori=1uptoN-pass:ifv[i]>v[i+1]:temp:=v[i];v[i]:=v[i+1];v[i+1]:=temp;fiendforendforqone:=(v[3]+v[4])/2;median:=(v[6]+v[7])/2;qthree:=(v[9]+v[10])/2;vardefX(exprx)=40+20xenddef;draw(X(0),50)--(X(12),50)withcolorGrey;forx=0step3until12:label.bot(decimalx,(X(x),47));endfordraw(X(v[1]),110)--(X(v[N]),110)withcolorBlue;fill(X(qone),85)--(X(qthree),85)--(X(qthree),135)--(X(qone),135)--cyclewithcolorWash;draw(X(qone),85)--(X(qthree),85)--(X(qthree),135)--(X(qone),135)--cyclewithcolorBlue;draw(X(median),85)--(X(median),135)withpenpencirclescaled2withcolorOrange;draw(X(v[1]),100)--(X(v[1]),120)withcolorBlue;draw(X(v[N]),100)--(X(v[N]),120)withcolorBlue;fori=1uptoN:fillfullcirclescaled3shifted(X(v[i]),165+3*(imod2))withcolorTeal;endformessage"check: quartiles="&decimalqone&","&decimalmedian&","&decimalqthree;% END DRAWINGlabel.lft("MPT-10-004"infont"cmr8",(312,210));setboundscurrentpicturetounitsquarexscaled320yscaled220;endfig;end.
A staircase accumulates the sorted observations. Repeated values produce a combined vertical jump and the curve reaches one after the last observation.
This is MetaPost, version 3.00 (TeX Live 2026) (kpathsea version 6.4.2)
(/usr/local/texlive/2026/texmf-dist/metapost/base/mpost.mp
(/usr/local/texlive/2026/texmf-dist/metapost/base/plain.mp
Preloading the plain mem file, version 1.005) ) (./MPT-10-005.mp
check: ecdf-final=1 [1{psfonts.map}<cmr10.pfb><cmr8.pfb>] )
1 output file written: MPT-10-005.svg
Transcript written on MPT-10-005.log.
Command or parameter
Meaning
No bins
Each record contributes mass 1/N at its own value.
Vertical then horizontal
Keep the cumulative fraction constant between observations.
Complete standalone MetaPost program
prologues:=3;outputformat:="svg";defaultfont:="cmr10";defaultscale:=1.1;colorBlue,Teal,Orange,Green,Grey,Light,Wash;Blue:=(0,84/255,159/255);Teal:=(0,177/255,183/255);Orange:=(246/255,168/255,0);Green:=(87/255,171/255,39/255);Grey:=(100/255,101/255,103/255);Light:=(236/255,236/255,237/255);Wash:=(232/255,241/255,250/255);% Format displayed numbers to hundredths using integer strings.vardefnumlabel(exprvalue)=saven,whole,frac;numericn,whole,frac;n:=round(100absvalue);whole:=floor(n/100);frac:=nmod100;(ifvalue<-.005:"-" & fidecimalwholeiffrac>0: & "." & iffrac<10:"0" & fidecimalfracfi)enddef;pickuppencirclescaled.9;outputtemplate:="MPT-10-005.svg";beginfig(1);fillunitsquarexscaled320yscaled220withcolorwhite;% BEGIN DRAWINGnumericxmin,xmax,ymin,ymax,xx,yy;xmin:=0;xmax:=12;ymin:=0;ymax:=1;vardefP(exprx,y)=(40+250*(x-xmin)/(xmax-xmin),35+145*(y-ymin)/(ymax-ymin))enddef;fori=0upto4:xx:=xmin+i*(xmax-xmin)/4;yy:=ymin+i*(ymax-ymin)/4;drawP(xx,ymin)--P(xx,ymax)withcolorLight;drawP(xmin,yy)--P(xmax,yy)withcolorLight;label.bot(numlabel(xx),P(xx,ymin));label.lft(numlabel(yy),P(xmin,yy));endfordrawP(xmin,ymax)--P(xmin,ymin)--P(xmax,ymin)withcolorGrey;numericv[];v[1]:=8;v[2]:=2;v[3]:=5;v[4]:=11;v[5]:=3;v[6]:=7;v[7]:=9;v[8]:=4;v[9]:=8;v[10]:=6;v[11]:=3;v[12]:=5;numericN,temp;N:=12;forpass=1uptoN-1:fori=1uptoN-pass:ifv[i]>v[i+1]:temp:=v[i];v[i]:=v[i+1];v[i+1]:=temp;fiendforendforpathp;p:=P(0,0);fori=1uptoN:p:=p--P(v[i],(i-1)/N)--P(v[i],i/N);endforp:=p--P(12,1);drawpwithpenpencirclescaled1.6withcolorBlue;message"check: ecdf-final="&decimal(N/N);% END DRAWINGlabel.lft("MPT-10-005"infont"cmr8",(312,210));setboundscurrentpicturetounitsquarexscaled320yscaled220;endfig;end.
numericv[];v[1]:=2;v[2]:=2.4;v[3]:=3;v[4]:=3.2;v[5]:=3.4;v[6]:=5.7;v[7]:=6;v[8]:=6.4;v[9]:=7;v[10]:=7.5;numericN,h;N:=10;h:=.45;vardefdensity(exprx)=saves,z;numerics,z;s:=0;forj=1uptoN:z:=(x-v[j])/h;ifabsz<6:s:=s+mexp(-128*z*z);fiendfors/(N*h*sqrt(2*3.141592654))enddef;pathp;numericvalue;p:=(160,35);fork=0upto90:value:=k/10;p:=p--(160+80density(value),35+18value);endforfork=90downto0:value:=k/10;p:=p--(160-80density(value),35+18value);endforp:=p--cycle;fillpwithcolorWash;drawpwithcolorBlue;fori=1uptoN:fillfullcirclescaled4shifted(160+4*((imod3)-1),35+18v[i])withcolorOrange;endforforvalue=0step2until8:label.lft(decimalvalue,(85,35+18value));endforlabel(btex KDE bandwidth 0.45 etex,(160,18));
Actual output
MPT-10-006 · Rendered by MetaPost
MetaPost · exit 0
Native compiler log
Standard output
This is MetaPost, version 3.00 (TeX Live 2026) (kpathsea version 6.4.2)
(/usr/local/texlive/2026/texmf-dist/metapost/base/mpost.mp
(/usr/local/texlive/2026/texmf-dist/metapost/base/plain.mp
Preloading the plain mem file, version 1.005) ) (./MPT-10-006.mp [1{psfonts.map
}<cmr10.pfb><cmr8.pfb>] )
1 output file written: MPT-10-006.svg
Transcript written on MPT-10-006.log.
Command or parameter
Meaning
mexp(-128*z*z)
MetaPost mexp(t) means exp(t/256), giving the Gaussian kernel.
h=0.45
A common bandwidth in data units.
Mirrored boundaries
Trace one density edge upwards and the other downwards before closing.
Complete standalone MetaPost program
prologues:=3;outputformat:="svg";defaultfont:="cmr10";defaultscale:=1.1;colorBlue,Teal,Orange,Green,Grey,Light,Wash;Blue:=(0,84/255,159/255);Teal:=(0,177/255,183/255);Orange:=(246/255,168/255,0);Green:=(87/255,171/255,39/255);Grey:=(100/255,101/255,103/255);Light:=(236/255,236/255,237/255);Wash:=(232/255,241/255,250/255);% Format displayed numbers to hundredths using integer strings.vardefnumlabel(exprvalue)=saven,whole,frac;numericn,whole,frac;n:=round(100absvalue);whole:=floor(n/100);frac:=nmod100;(ifvalue<-.005:"-" & fidecimalwholeiffrac>0: & "." & iffrac<10:"0" & fidecimalfracfi)enddef;pickuppencirclescaled.9;outputtemplate:="MPT-10-006.svg";beginfig(1);fillunitsquarexscaled320yscaled220withcolorwhite;% BEGIN DRAWINGnumericv[];v[1]:=2;v[2]:=2.4;v[3]:=3;v[4]:=3.2;v[5]:=3.4;v[6]:=5.7;v[7]:=6;v[8]:=6.4;v[9]:=7;v[10]:=7.5;numericN,h;N:=10;h:=.45;vardefdensity(exprx)=saves,z;numerics,z;s:=0;forj=1uptoN:z:=(x-v[j])/h;ifabsz<6:s:=s+mexp(-128*z*z);fiendfors/(N*h*sqrt(2*3.141592654))enddef;pathp;numericvalue;p:=(160,35);fork=0upto90:value:=k/10;p:=p--(160+80density(value),35+18value);endforfork=90downto0:value:=k/10;p:=p--(160-80density(value),35+18value);endforp:=p--cycle;fillpwithcolorWash;drawpwithcolorBlue;fori=1uptoN:fillfullcirclescaled4shifted(160+4*((imod3)-1),35+18v[i])withcolorOrange;endforforvalue=0step2until8:label.lft(decimalvalue,(85,35+18value));endforlabel(btex KDE bandwidth 0.45 etex,(160,18));% END DRAWINGlabel.lft("MPT-10-006"infont"cmr8",(312,210));setboundscurrentpicturetounitsquarexscaled320yscaled220;endfig;end.
This is MetaPost, version 3.00 (TeX Live 2026) (kpathsea version 6.4.2)
(/usr/local/texlive/2026/texmf-dist/metapost/base/mpost.mp
(/usr/local/texlive/2026/texmf-dist/metapost/base/plain.mp
Preloading the plain mem file, version 1.005) ) (./MPT-11-001.mp [1{psfonts.map
}<cmr8.pfb>] )
1 output file written: MPT-11-001.svg
Transcript written on MPT-11-001.log.
Command or parameter
Meaning
Circular subpath
Use less than one eighth of the circle to leave gaps.
Reverse the inner arc
Join the inner boundary back in the opposite direction.
Complete standalone MetaPost program
prologues:=3;outputformat:="svg";defaultfont:="cmr10";defaultscale:=1.1;colorBlue,Teal,Orange,Green,Grey,Light,Wash;Blue:=(0,84/255,159/255);Teal:=(0,177/255,183/255);Orange:=(246/255,168/255,0);Green:=(87/255,171/255,39/255);Grey:=(100/255,101/255,103/255);Light:=(236/255,236/255,237/255);Wash:=(232/255,241/255,250/255);% Format displayed numbers to hundredths using integer strings.vardefnumlabel(exprvalue)=saven,whole,frac;numericn,whole,frac;n:=round(100absvalue);whole:=floor(n/100);frac:=nmod100;(ifvalue<-.005:"-" & fidecimalwholeiffrac>0: & "." & iffrac<10:"0" & fidecimalfracfi)enddef;pickuppencirclescaled.9;outputtemplate:="MPT-11-001.svg";beginfig(1);fillunitsquarexscaled320yscaled220withcolorwhite;% BEGIN DRAWINGpathsegment;segment:=(subpath(0,.9)offullcirclescaled155)--reverse(subpath(0,.9)offullcirclescaled90)--cycle;fori=0upto7:fillsegmentrotated(45i)shifted(160,105)withcolor(i/8)[Blue,Teal];endfor% END DRAWINGlabel.lft("MPT-11-001"infont"cmr8",(312,210));setboundscurrentpicturetounitsquarexscaled320yscaled220;endfig;end.
This is MetaPost, version 3.00 (TeX Live 2026) (kpathsea version 6.4.2)
(/usr/local/texlive/2026/texmf-dist/metapost/base/mpost.mp
(/usr/local/texlive/2026/texmf-dist/metapost/base/plain.mp
Preloading the plain mem file, version 1.005) ) (./MPT-11-002.mp [1{psfonts.map
}<cmr10.pfb><cmr8.pfb>] )
1 output file written: MPT-11-002.svg
Transcript written on MPT-11-002.log.
Command or parameter
Meaning
360*value/total
Compute angular share from data.
Two-degree arc sampling
Use explicit points rather than assuming Bezier path time is proportional to angle.
Complete standalone MetaPost program
prologues:=3;outputformat:="svg";defaultfont:="cmr10";defaultscale:=1.1;colorBlue,Teal,Orange,Green,Grey,Light,Wash;Blue:=(0,84/255,159/255);Teal:=(0,177/255,183/255);Orange:=(246/255,168/255,0);Green:=(87/255,171/255,39/255);Grey:=(100/255,101/255,103/255);Light:=(236/255,236/255,237/255);Wash:=(232/255,241/255,250/255);% Format displayed numbers to hundredths using integer strings.vardefnumlabel(exprvalue)=saven,whole,frac;numericn,whole,frac;n:=round(100absvalue);whole:=floor(n/100);frac:=nmod100;(ifvalue<-.005:"-" & fidecimalwholeiffrac>0: & "." & iffrac<10:"0" & fidecimalfracfi)enddef;pickuppencirclescaled.9;outputtemplate:="MPT-11-002.svg";beginfig(1);fillunitsquarexscaled320yscaled220withcolorwhite;% BEGIN DRAWINGnumericv[];v[1]:=22;v[2]:=34;v[3]:=16;v[4]:=28;numerictotal,start,finish;total:=0;start:=0;fori=1upto4:total:=total+v[i];endforpathsector;fori=1upto4:finish:=start+360v[i]/total;sector:=origin--75dirstart;fora=start+2step2untilfinish:sector:=sector--75dira;endforsector:=sector--75dirfinish--cycle;fillsectorshifted(160,105)withcolor((i-1)/4)[Blue,Teal];label(decimalv[i],(160,105)+94dir(.5[start,finish]));start:=finish;endfor% END DRAWINGlabel.lft("MPT-11-002"infont"cmr8",(312,210));setboundscurrentpicturetounitsquarexscaled320yscaled220;endfig;end.
This is MetaPost, version 3.00 (TeX Live 2026) (kpathsea version 6.4.2)
(/usr/local/texlive/2026/texmf-dist/metapost/base/mpost.mp
(/usr/local/texlive/2026/texmf-dist/metapost/base/plain.mp
Preloading the plain mem file, version 1.005) ) (./MPT-11-003.mp [1{psfonts.map
}<cmr8.pfb>] )
1 output file written: MPT-11-003.svg
Transcript written on MPT-11-003.log.
Command or parameter
Meaning
r(angle)
Radius is 50+20*cos(5*angle), always positive here.
dir a
Convert polar radius and angle into a pair.
Complete standalone MetaPost program
prologues:=3;outputformat:="svg";defaultfont:="cmr10";defaultscale:=1.1;colorBlue,Teal,Orange,Green,Grey,Light,Wash;Blue:=(0,84/255,159/255);Teal:=(0,177/255,183/255);Orange:=(246/255,168/255,0);Green:=(87/255,171/255,39/255);Grey:=(100/255,101/255,103/255);Light:=(236/255,236/255,237/255);Wash:=(232/255,241/255,250/255);% Format displayed numbers to hundredths using integer strings.vardefnumlabel(exprvalue)=saven,whole,frac;numericn,whole,frac;n:=round(100absvalue);whole:=floor(n/100);frac:=nmod100;(ifvalue<-.005:"-" & fidecimalwholeiffrac>0: & "." & iffrac<10:"0" & fidecimalfracfi)enddef;pickuppencirclescaled.9;outputtemplate:="MPT-11-003.svg";beginfig(1);fillunitsquarexscaled320yscaled220withcolorwhite;% BEGIN DRAWINGpathp;numericr;forradius=30step20until70:drawfullcirclescaled(2radius)shifted(160,105)withcolorLight;endforp:=fora=0step2until358:ifa>0:--fi(160,105)+(50+20cosd(5a))*diraendfor--cycle;drawpwithpenpencirclescaled1.5withcolorBlue;% END DRAWINGlabel.lft("MPT-11-003"infont"cmr8",(312,210));setboundscurrentpicturetounitsquarexscaled320yscaled220;endfig;end.
This is MetaPost, version 3.00 (TeX Live 2026) (kpathsea version 6.4.2)
(/usr/local/texlive/2026/texmf-dist/metapost/base/mpost.mp
(/usr/local/texlive/2026/texmf-dist/metapost/base/plain.mp
Preloading the plain mem file, version 1.005) ) (./MPT-11-004.mp [1{psfonts.map
}<cmr10.pfb><cmr8.pfb>] )
1 output file written: MPT-11-004.svg
Transcript written on MPT-11-004.log.
Command or parameter
Meaning
Shared normalization
All values are fractions of the same maximum.
90-72*(i-1)
Place five spokes clockwise, starting at the top.
Complete standalone MetaPost program
prologues:=3;outputformat:="svg";defaultfont:="cmr10";defaultscale:=1.1;colorBlue,Teal,Orange,Green,Grey,Light,Wash;Blue:=(0,84/255,159/255);Teal:=(0,177/255,183/255);Orange:=(246/255,168/255,0);Green:=(87/255,171/255,39/255);Grey:=(100/255,101/255,103/255);Light:=(236/255,236/255,237/255);Wash:=(232/255,241/255,250/255);% Format displayed numbers to hundredths using integer strings.vardefnumlabel(exprvalue)=saven,whole,frac;numericn,whole,frac;n:=round(100absvalue);whole:=floor(n/100);frac:=nmod100;(ifvalue<-.005:"-" & fidecimalwholeiffrac>0: & "." & iffrac<10:"0" & fidecimalfracfi)enddef;pickuppencirclescaled.9;outputtemplate:="MPT-11-004.svg";beginfig(1);fillunitsquarexscaled320yscaled220withcolorwhite;% BEGIN DRAWINGnumericv[];v[1]:=0.8;v[2]:=0.5;v[3]:=0.9;v[4]:=0.65;v[5]:=0.7;pathp;pairo;o:=(160,105);forlevel=.25step.25until1:drawfori=1upto5:ifi>1:--fio+75level*dir(90-72*(i-1))endfor--cyclewithcolorLight;endforfori=1upto5:drawo--(o+75dir(90-72*(i-1)))withcolorLight;label(substring(i-1,i)of"ABCDE",o+91dir(90-72*(i-1)));endforp:=fori=1upto5:ifi>1:--fio+75v[i]*dir(90-72*(i-1))endfor--cycle;drawpwithpenpencirclescaled2withcolorBlue;% END DRAWINGlabel.lft("MPT-11-004"infont"cmr8",(312,210));setboundscurrentpicturetounitsquarexscaled320yscaled220;endfig;end.
This is MetaPost, version 3.00 (TeX Live 2026) (kpathsea version 6.4.2)
(/usr/local/texlive/2026/texmf-dist/metapost/base/mpost.mp
(/usr/local/texlive/2026/texmf-dist/metapost/base/plain.mp
Preloading the plain mem file, version 1.005) ) (./MPT-11-005.mp [1{psfonts.map
}<cmr8.pfb>] )
1 output file written: MPT-11-005.svg
Transcript written on MPT-11-005.log.
Command or parameter
Meaning
Vector displacement
Rotate the position vector ninety degrees.
One scale
Use the same conversion for every vector magnitude.
Complete standalone MetaPost program
prologues:=3;outputformat:="svg";defaultfont:="cmr10";defaultscale:=1.1;colorBlue,Teal,Orange,Green,Grey,Light,Wash;Blue:=(0,84/255,159/255);Teal:=(0,177/255,183/255);Orange:=(246/255,168/255,0);Green:=(87/255,171/255,39/255);Grey:=(100/255,101/255,103/255);Light:=(236/255,236/255,237/255);Wash:=(232/255,241/255,250/255);% Format displayed numbers to hundredths using integer strings.vardefnumlabel(exprvalue)=saven,whole,frac;numericn,whole,frac;n:=round(100absvalue);whole:=floor(n/100);frac:=nmod100;(ifvalue<-.005:"-" & fidecimalwholeiffrac>0: & "." & iffrac<10:"0" & fidecimalfracfi)enddef;pickuppencirclescaled.9;outputtemplate:="MPT-11-005.svg";beginfig(1);fillunitsquarexscaled320yscaled220withcolorwhite;% BEGIN DRAWINGpairbase,delta;ahlength:=3;fori=-4upto4:forj=-2upto2:base:=(160+25i,105+25j);delta:=6*(-j,i);ifabsdelta>0:drawarrowbase--(base+delta)withpenpencirclescaled.8withcolorBlue;fiendforendfor% END DRAWINGlabel.lft("MPT-11-005"infont"cmr8",(312,210));setboundscurrentpicturetounitsquarexscaled320yscaled220;endfig;end.
An explicit affine projection turns three coordinates into a drawing pair. This is a transparent wireframe illustration, without automatic hidden-line removal.
This is MetaPost, version 3.00 (TeX Live 2026) (kpathsea version 6.4.2)
(/usr/local/texlive/2026/texmf-dist/metapost/base/mpost.mp
(/usr/local/texlive/2026/texmf-dist/metapost/base/plain.mp
Preloading the plain mem file, version 1.005) ) (./MPT-11-006.mp [1{psfonts.map
}<cmr8.pfb>] )
1 output file written: MPT-11-006.svg
Transcript written on MPT-11-006.log.
Command or parameter
Meaning
project(x,y,z)
A pair-valued function implements the chosen view.
Two line families
Sample rows and columns of the same surface.
No visibility solver
All grid strokes remain visible.
Complete standalone MetaPost program
prologues:=3;outputformat:="svg";defaultfont:="cmr10";defaultscale:=1.1;colorBlue,Teal,Orange,Green,Grey,Light,Wash;Blue:=(0,84/255,159/255);Teal:=(0,177/255,183/255);Orange:=(246/255,168/255,0);Green:=(87/255,171/255,39/255);Grey:=(100/255,101/255,103/255);Light:=(236/255,236/255,237/255);Wash:=(232/255,241/255,250/255);% Format displayed numbers to hundredths using integer strings.vardefnumlabel(exprvalue)=saven,whole,frac;numericn,whole,frac;n:=round(100absvalue);whole:=floor(n/100);frac:=nmod100;(ifvalue<-.005:"-" & fidecimalwholeiffrac>0: & "." & iffrac<10:"0" & fidecimalfracfi)enddef;pickuppencirclescaled.9;outputtemplate:="MPT-11-006.svg";beginfig(1);fillunitsquarexscaled320yscaled220withcolorwhite;% BEGIN DRAWINGvardefproject(exprx,y,z)=(160+40*(x-y),55+22*(x+y)+35z)enddef;vardefheight(exprx,y)=.8+.35*(sind(90x)+cosd(90y))enddef;fori=0upto8:drawforj=0upto20:ifj>0:--fiproject(i/4,j/10,height(i/4,j/10))endforwithcolorBlue;endforforj=0upto8:drawfori=0upto20:ifi>0:--fiproject(i/10,j/4,height(i/10,j/4))endforwithcolorTeal;endfor% END DRAWINGlabel.lft("MPT-11-006"infont"cmr8",(312,210));setboundscurrentpicturetounitsquarexscaled320yscaled220;endfig;end.
This is MetaPost, version 3.00 (TeX Live 2026) (kpathsea version 6.4.2)
(/usr/local/texlive/2026/texmf-dist/metapost/base/mpost.mp
(/usr/local/texlive/2026/texmf-dist/metapost/base/plain.mp
Preloading the plain mem file, version 1.005) ) (./MPT-12-001.mp
(/usr/local/texlive/2026/texmf-dist/metapost/base/graph.mp
(/usr/local/texlive/2026/texmf-dist/metapost/base/marith.mp
(/usr/local/texlive/2026/texmf-dist/metapost/base/string.mp))
(/usr/local/texlive/2026/texmf-dist/metapost/base/format.mp
(/usr/local/texlive/2026/texmf-dist/metapost/base/string.mp)
(/usr/local/texlive/2026/texmf-dist/metapost/base/texnum.mp))) [1{psfonts.map}<
cmr10.pfb><cmmi10.pfb><cmr8.pfb>] )
1 output file written: MPT-12-001.svg
Transcript written on MPT-12-001.log.
Command or parameter
Meaning
input graph
Load MetaPost standard plotting macros.
begingraph(width,height)
Specify the plotting rectangle, not data ranges.
gdraw
Map the supplied data path into the current graph coordinates.
Complete standalone MetaPost program
prologues:=3;outputformat:="svg";defaultfont:="cmr10";defaultscale:=1.1;colorBlue,Teal,Orange,Green,Grey,Light,Wash;Blue:=(0,84/255,159/255);Teal:=(0,177/255,183/255);Orange:=(246/255,168/255,0);Green:=(87/255,171/255,39/255);Grey:=(100/255,101/255,103/255);Light:=(236/255,236/255,237/255);Wash:=(232/255,241/255,250/255);% Format displayed numbers to hundredths using integer strings.vardefnumlabel(exprvalue)=saven,whole,frac;numericn,whole,frac;n:=round(100absvalue);whole:=floor(n/100);frac:=nmod100;(ifvalue<-.005:"-" & fidecimalwholeiffrac>0: & "." & iffrac<10:"0" & fidecimalfracfi)enddef;pickuppencirclescaled.9;outputtemplate:="MPT-12-001.svg";beginfig(1);fillunitsquarexscaled320yscaled220withcolorwhite;% BEGIN DRAWINGinputgraph;drawbegingraph(240,140);gdraw(0,1)--(1,2)--(2,1.5)--(3,3.4)--(4,2.5)--(6,3.8)withpenpencirclescaled1.4withcolorBlue;glabel.lft(btex $y$ etex,OUT);glabel.bot(btex $x$ etex,OUT);endgraphshifted(50,40);% END DRAWINGlabel.lft("MPT-12-001"infont"cmr8",(312,210));setboundscurrentpicturetounitsquarexscaled320yscaled220;endfig;end.
This is MetaPost, version 3.00 (TeX Live 2026) (kpathsea version 6.4.2)
(/usr/local/texlive/2026/texmf-dist/metapost/base/mpost.mp
(/usr/local/texlive/2026/texmf-dist/metapost/base/plain.mp
Preloading the plain mem file, version 1.005) ) (./MPT-12-002.mp
(/usr/local/texlive/2026/texmf-dist/metapost/base/graph.mp
(/usr/local/texlive/2026/texmf-dist/metapost/base/marith.mp
(/usr/local/texlive/2026/texmf-dist/metapost/base/string.mp))
(/usr/local/texlive/2026/texmf-dist/metapost/base/format.mp
(/usr/local/texlive/2026/texmf-dist/metapost/base/string.mp)
(/usr/local/texlive/2026/texmf-dist/metapost/base/texnum.mp))) [1{psfonts.map}<
cmr10.pfb><cmmi10.pfb><cmr8.pfb>] )
1 output file written: MPT-12-002.svg
Transcript written on MPT-12-002.log.
Command or parameter
Meaning
setrange(xmin,ymin,xmax,ymax)
Choose explicit ranges before the data are drawn.
OUT labels
Place axis labels relative to the entire graph.
Complete standalone MetaPost program
prologues:=3;outputformat:="svg";defaultfont:="cmr10";defaultscale:=1.1;colorBlue,Teal,Orange,Green,Grey,Light,Wash;Blue:=(0,84/255,159/255);Teal:=(0,177/255,183/255);Orange:=(246/255,168/255,0);Green:=(87/255,171/255,39/255);Grey:=(100/255,101/255,103/255);Light:=(236/255,236/255,237/255);Wash:=(232/255,241/255,250/255);% Format displayed numbers to hundredths using integer strings.vardefnumlabel(exprvalue)=saven,whole,frac;numericn,whole,frac;n:=round(100absvalue);whole:=floor(n/100);frac:=nmod100;(ifvalue<-.005:"-" & fidecimalwholeiffrac>0: & "." & iffrac<10:"0" & fidecimalfracfi)enddef;pickuppencirclescaled.9;outputtemplate:="MPT-12-002.svg";beginfig(1);fillunitsquarexscaled320yscaled220withcolorwhite;% BEGIN DRAWINGinputgraph;drawbegingraph(240,140);setrange(0,0,6,5);gdraw(0,1)--(1,2)--(2,1.5)--(3,3.4)--(4,2.5)--(6,3.8)withpenpencirclescaled1.4withcolorBlue;glabel.lft(btex $y$ etex,OUT);glabel.bot(btex $x$ etex,OUT);endgraphshifted(50,40);% END DRAWINGlabel.lft("MPT-12-002"infont"cmr8",(312,210));setboundscurrentpicturetounitsquarexscaled320yscaled220;endfig;end.
This is MetaPost, version 3.00 (TeX Live 2026) (kpathsea version 6.4.2)
(/usr/local/texlive/2026/texmf-dist/metapost/base/mpost.mp
(/usr/local/texlive/2026/texmf-dist/metapost/base/plain.mp
Preloading the plain mem file, version 1.005) ) (./MPT-12-003.mp
(/usr/local/texlive/2026/texmf-dist/metapost/base/graph.mp
(/usr/local/texlive/2026/texmf-dist/metapost/base/marith.mp
(/usr/local/texlive/2026/texmf-dist/metapost/base/string.mp))
(/usr/local/texlive/2026/texmf-dist/metapost/base/format.mp
(/usr/local/texlive/2026/texmf-dist/metapost/base/string.mp)
(/usr/local/texlive/2026/texmf-dist/metapost/base/texnum.mp))) [1{psfonts.map}<
cmr10.pfb><cmmi10.pfb><cmr8.pfb>] )
1 output file written: MPT-12-003.svg
Transcript written on MPT-12-003.log.
Command or parameter
Meaning
setcoords(linear,log)
Keep x linear and transform the positive y values logarithmically.
Positive range
The requested logarithmic axis begins at one.
Complete standalone MetaPost program
prologues:=3;outputformat:="svg";defaultfont:="cmr10";defaultscale:=1.1;colorBlue,Teal,Orange,Green,Grey,Light,Wash;Blue:=(0,84/255,159/255);Teal:=(0,177/255,183/255);Orange:=(246/255,168/255,0);Green:=(87/255,171/255,39/255);Grey:=(100/255,101/255,103/255);Light:=(236/255,236/255,237/255);Wash:=(232/255,241/255,250/255);% Format displayed numbers to hundredths using integer strings.vardefnumlabel(exprvalue)=saven,whole,frac;numericn,whole,frac;n:=round(100absvalue);whole:=floor(n/100);frac:=nmod100;(ifvalue<-.005:"-" & fidecimalwholeiffrac>0: & "." & iffrac<10:"0" & fidecimalfracfi)enddef;pickuppencirclescaled.9;outputtemplate:="MPT-12-003.svg";beginfig(1);fillunitsquarexscaled320yscaled220withcolorwhite;% BEGIN DRAWINGinputgraph;drawbegingraph(240,140);setcoords(linear,log);setrange(0,1,4,100);gdraw(0,1)--(1,3)--(2,10)--(3,30)--(4,100)withpenpencirclescaled1.4withcolorBlue;glabel.lft(btex $y$ etex,OUT);glabel.bot(btex $x$ etex,OUT);endgraphshifted(50,40);% END DRAWINGlabel.lft("MPT-12-003"infont"cmr8",(312,210));setboundscurrentpicturetounitsquarexscaled320yscaled220;endfig;end.
This is MetaPost, version 3.00 (TeX Live 2026) (kpathsea version 6.4.2)
(/usr/local/texlive/2026/texmf-dist/metapost/base/mpost.mp
(/usr/local/texlive/2026/texmf-dist/metapost/base/plain.mp
Preloading the plain mem file, version 1.005) ) (./MPT-12-004.mp
(/usr/local/texlive/2026/texmf-dist/metapost/base/graph.mp
(/usr/local/texlive/2026/texmf-dist/metapost/base/marith.mp
(/usr/local/texlive/2026/texmf-dist/metapost/base/string.mp))
(/usr/local/texlive/2026/texmf-dist/metapost/base/format.mp
(/usr/local/texlive/2026/texmf-dist/metapost/base/string.mp)
(/usr/local/texlive/2026/texmf-dist/metapost/base/texnum.mp))) [1{psfonts.map}<
cmr10.pfb><cmmi10.pfb><cmr8.pfb>] )
1 output file written: MPT-12-004.svg
Transcript written on MPT-12-004.log.
Command or parameter
Meaning
gfill
Fill a closed path expressed in data coordinates.
Same mapping
Use the same graph range for the fill and the line.
Complete standalone MetaPost program
prologues:=3;outputformat:="svg";defaultfont:="cmr10";defaultscale:=1.1;colorBlue,Teal,Orange,Green,Grey,Light,Wash;Blue:=(0,84/255,159/255);Teal:=(0,177/255,183/255);Orange:=(246/255,168/255,0);Green:=(87/255,171/255,39/255);Grey:=(100/255,101/255,103/255);Light:=(236/255,236/255,237/255);Wash:=(232/255,241/255,250/255);% Format displayed numbers to hundredths using integer strings.vardefnumlabel(exprvalue)=saven,whole,frac;numericn,whole,frac;n:=round(100absvalue);whole:=floor(n/100);frac:=nmod100;(ifvalue<-.005:"-" & fidecimalwholeiffrac>0: & "." & iffrac<10:"0" & fidecimalfracfi)enddef;pickuppencirclescaled.9;outputtemplate:="MPT-12-004.svg";beginfig(1);fillunitsquarexscaled320yscaled220withcolorwhite;% BEGIN DRAWINGinputgraph;drawbegingraph(240,140);setrange(0,0,6,5);gfill(0,0)--(0,1)--(1,2)--(2,1.5)--(3,3.4)--(4,2.5)--(6,3.8)--(6,0)--cyclewithcolorWash;gdraw(0,1)--(1,2)--(2,1.5)--(3,3.4)--(4,2.5)--(6,3.8)withpenpencirclescaled1.4withcolorBlue;glabel.lft(btex $y$ etex,OUT);glabel.bot(btex $x$ etex,OUT);endgraphshifted(50,40);% END DRAWINGlabel.lft("MPT-12-004"infont"cmr8",(312,210));setboundscurrentpicturetounitsquarexscaled320yscaled220;endfig;end.
This is MetaPost, version 3.00 (TeX Live 2026) (kpathsea version 6.4.2)
(/usr/local/texlive/2026/texmf-dist/metapost/base/mpost.mp
(/usr/local/texlive/2026/texmf-dist/metapost/base/plain.mp
Preloading the plain mem file, version 1.005) ) (./MPT-12-005.mp
(/usr/local/texlive/2026/texmf-dist/metapost/base/graph.mp
(/usr/local/texlive/2026/texmf-dist/metapost/base/marith.mp
(/usr/local/texlive/2026/texmf-dist/metapost/base/string.mp))
(/usr/local/texlive/2026/texmf-dist/metapost/base/format.mp
(/usr/local/texlive/2026/texmf-dist/metapost/base/string.mp)
(/usr/local/texlive/2026/texmf-dist/metapost/base/texnum.mp))) [1{psfonts.map}<
cmr10.pfb><cmmi10.pfb><cmr8.pfb>] )
1 output file written: MPT-12-005.svg
Transcript written on MPT-12-005.log.
Command or parameter
Meaning
autogrid
Iterate the automatically selected axis positions.
grid.bot / grid.lft
Draw grid lines and labels for the bottom and left axes.
Complete standalone MetaPost program
prologues:=3;outputformat:="svg";defaultfont:="cmr10";defaultscale:=1.1;colorBlue,Teal,Orange,Green,Grey,Light,Wash;Blue:=(0,84/255,159/255);Teal:=(0,177/255,183/255);Orange:=(246/255,168/255,0);Green:=(87/255,171/255,39/255);Grey:=(100/255,101/255,103/255);Light:=(236/255,236/255,237/255);Wash:=(232/255,241/255,250/255);% Format displayed numbers to hundredths using integer strings.vardefnumlabel(exprvalue)=saven,whole,frac;numericn,whole,frac;n:=round(100absvalue);whole:=floor(n/100);frac:=nmod100;(ifvalue<-.005:"-" & fidecimalwholeiffrac>0: & "." & iffrac<10:"0" & fidecimalfracfi)enddef;pickuppencirclescaled.9;outputtemplate:="MPT-12-005.svg";beginfig(1);fillunitsquarexscaled320yscaled220withcolorwhite;% BEGIN DRAWINGinputgraph;drawbegingraph(240,140);setrange(0,0,6,5);autogrid(grid.bot,grid.lft)withcolorLight;gdraw(0,1)--(1,2)--(2,1.5)--(3,3.4)--(4,2.5)--(6,3.8)withpenpencirclescaled1.4withcolorBlue;glabel.lft(btex $y$ etex,OUT);glabel.bot(btex $x$ etex,OUT);endgraphshifted(50,40);% END DRAWINGlabel.lft("MPT-12-005"infont"cmr8",(312,210));setboundscurrentpicturetounitsquarexscaled320yscaled220;endfig;end.
inputgraph;patha,b;a:=fori=0upto12:ifi>0:--fi(i/2,1+.4*(i/2)+.4sind(50i))endfor;b:=fori=0upto12:ifi>0:--fi(i/2,3.6-.3*(i/2)+.3cosd(35i))endfor;drawbegingraph(240,140);setrange(0,0,6,5);gdrawawithpenpencirclescaled1.4withcolorBlue;gdrawbdashedevenlywithpenpencirclescaled1.4withcolorTeal;glabel.lft(btex $y$ etex,OUT);glabel.bot(btex $x$ etex,OUT);endgraphshifted(50,40);draw(75,195)--(95,195)withcolorBlue;label.rt(btex series A etex,(100,195));draw(205,195)--(225,195)dashedevenlywithcolorTeal;label.rt(btex series B etex,(230,195));
Actual output
MPT-12-006 · Rendered by MetaPost
MetaPost · exit 0
Native compiler log
Standard output
This is MetaPost, version 3.00 (TeX Live 2026) (kpathsea version 6.4.2)
(/usr/local/texlive/2026/texmf-dist/metapost/base/mpost.mp
(/usr/local/texlive/2026/texmf-dist/metapost/base/plain.mp
Preloading the plain mem file, version 1.005) ) (./MPT-12-006.mp
(/usr/local/texlive/2026/texmf-dist/metapost/base/graph.mp
(/usr/local/texlive/2026/texmf-dist/metapost/base/marith.mp
(/usr/local/texlive/2026/texmf-dist/metapost/base/string.mp))
(/usr/local/texlive/2026/texmf-dist/metapost/base/format.mp
(/usr/local/texlive/2026/texmf-dist/metapost/base/string.mp)
(/usr/local/texlive/2026/texmf-dist/metapost/base/texnum.mp))) [1{psfonts.map}<
cmr10.pfb><cmmi10.pfb><cmr8.pfb>] )
1 output file written: MPT-12-006.svg
Transcript written on MPT-12-006.log.
Command or parameter
Meaning
Two paths
Keep series identity separate from the shared coordinate system.
Manual legend
Compose the graph with the same text and geometry tools used elsewhere.
Complete standalone MetaPost program
prologues:=3;outputformat:="svg";defaultfont:="cmr10";defaultscale:=1.1;colorBlue,Teal,Orange,Green,Grey,Light,Wash;Blue:=(0,84/255,159/255);Teal:=(0,177/255,183/255);Orange:=(246/255,168/255,0);Green:=(87/255,171/255,39/255);Grey:=(100/255,101/255,103/255);Light:=(236/255,236/255,237/255);Wash:=(232/255,241/255,250/255);% Format displayed numbers to hundredths using integer strings.vardefnumlabel(exprvalue)=saven,whole,frac;numericn,whole,frac;n:=round(100absvalue);whole:=floor(n/100);frac:=nmod100;(ifvalue<-.005:"-" & fidecimalwholeiffrac>0: & "." & iffrac<10:"0" & fidecimalfracfi)enddef;pickuppencirclescaled.9;outputtemplate:="MPT-12-006.svg";beginfig(1);fillunitsquarexscaled320yscaled220withcolorwhite;% BEGIN DRAWINGinputgraph;patha,b;a:=fori=0upto12:ifi>0:--fi(i/2,1+.4*(i/2)+.4sind(50i))endfor;b:=fori=0upto12:ifi>0:--fi(i/2,3.6-.3*(i/2)+.3cosd(35i))endfor;drawbegingraph(240,140);setrange(0,0,6,5);gdrawawithpenpencirclescaled1.4withcolorBlue;gdrawbdashedevenlywithpenpencirclescaled1.4withcolorTeal;glabel.lft(btex $y$ etex,OUT);glabel.bot(btex $x$ etex,OUT);endgraphshifted(50,40);draw(75,195)--(95,195)withcolorBlue;label.rt(btex series A etex,(100,195));draw(205,195)--(225,195)dashedevenlywithcolorTeal;label.rt(btex series B etex,(230,195));% END DRAWINGlabel.lft("MPT-12-006"infont"cmr8",(312,210));setboundscurrentpicturetounitsquarexscaled320yscaled220;endfig;end.
Keep measurements separate from drawing instructions. The source-and-data ZIP
preserves relative filenames; extract the whole archive before running its .mp
program. The bundled data/README.md defines columns, units and provenance.
All measurements here are synthetic. Bounds are illustrative display intervals,
not confidence intervals. The validity flag distinguishes an absent observation
from a measured zero. graph.mp expects numeric whitespace-separated fields and
stops at a blank line; remove headers and separators deliberately before use.
The explicit readfrom example instead shows how to skip an empty line.
Pass a filename directly to gdraw. The first column is time in seconds; the second is response in arbitrary units. Explicit ranges make subsequent comparisons honest.
inputgraph;drawbegingraph(240,140);setrange(0,0,8,6);gdraw"data/calibration.dat"withcolorBluewithpenpencirclescaled1.5;glabel.bot(btex Time (s) etex,OUT);glabel.lft(btex Response (a.u.) etexrotated90,OUT);endgraphshifted(55,42);
Actual output
MPT-13-001 · Rendered by MetaPost
MetaPost · exit 0
Native compiler log
Standard output
This is MetaPost, version 3.00 (TeX Live 2026) (kpathsea version 6.4.2)
(/usr/local/texlive/2026/texmf-dist/metapost/base/mpost.mp
(/usr/local/texlive/2026/texmf-dist/metapost/base/plain.mp
Preloading the plain mem file, version 1.005) ) (./MPT-13-001.mp
(/usr/local/texlive/2026/texmf-dist/metapost/base/graph.mp
(/usr/local/texlive/2026/texmf-dist/metapost/base/marith.mp
(/usr/local/texlive/2026/texmf-dist/metapost/base/string.mp))
(/usr/local/texlive/2026/texmf-dist/metapost/base/format.mp
(/usr/local/texlive/2026/texmf-dist/metapost/base/string.mp)
(/usr/local/texlive/2026/texmf-dist/metapost/base/texnum.mp))) [1{psfonts.map}<
cmr10.pfb><cmr8.pfb>] )
1 output file written: MPT-13-001.svg
Transcript written on MPT-13-001.log.
Command or parameter
Meaning
gdraw "filename"
Read consecutive x/y pairs from a two-column numeric file.
setrange(0,0,8,6)
Fix both axes rather than letting each dataset choose a range.
Complete standalone MetaPost program
prologues:=3;outputformat:="svg";defaultfont:="cmr10";defaultscale:=1.1;colorBlue,Teal,Orange,Green,Grey,Light,Wash;Blue:=(0,84/255,159/255);Teal:=(0,177/255,183/255);Orange:=(246/255,168/255,0);Green:=(87/255,171/255,39/255);Grey:=(100/255,101/255,103/255);Light:=(236/255,236/255,237/255);Wash:=(232/255,241/255,250/255);% Format displayed numbers to hundredths using integer strings.vardefnumlabel(exprvalue)=saven,whole,frac;numericn,whole,frac;n:=round(100absvalue);whole:=floor(n/100);frac:=nmod100;(ifvalue<-.005:"-" & fidecimalwholeiffrac>0: & "." & iffrac<10:"0" & fidecimalfracfi)enddef;pickuppencirclescaled.9;outputtemplate:="MPT-13-001.svg";beginfig(1);fillunitsquarexscaled320yscaled220withcolorwhite;% BEGIN DRAWINGinputgraph;drawbegingraph(240,140);setrange(0,0,8,6);gdraw"data/calibration.dat"withcolorBluewithpenpencirclescaled1.5;glabel.bot(btex Time (s) etex,OUT);glabel.lft(btex Response (a.u.) etexrotated90,OUT);endgraphshifted(55,42);% END DRAWINGlabel.lft("MPT-13-001"infont"cmr8",(312,210));setboundscurrentpicturetounitsquarexscaled320yscaled220;endfig;end.
readings.dat has six fields per row: time, observation, model, lower bound, upper bound and validity. Select time and model here; the model is defined even where the observation is absent.
inputgraph;pathmodelpath;gdata("data/readings.dat",row,ifi=1:modelpath:=(scantokensrow1,scantokensrow3);else:augment.modelpath(scantokensrow1,scantokensrow3);fi);drawbegingraph(240,140);setrange(0,0,8,6);gdrawmodelpathwithcolorTealwithpenpencirclescaled1.5;glabel.bot(btex Time (s) etex,OUT);glabel.lft(btex Model (a.u.) etexrotated90,OUT);endgraphshifted(55,42);
Actual output
MPT-13-002 · Rendered by MetaPost
MetaPost · exit 0
Native compiler log
Standard output
This is MetaPost, version 3.00 (TeX Live 2026) (kpathsea version 6.4.2)
(/usr/local/texlive/2026/texmf-dist/metapost/base/mpost.mp
(/usr/local/texlive/2026/texmf-dist/metapost/base/plain.mp
Preloading the plain mem file, version 1.005) ) (./MPT-13-002.mp
(/usr/local/texlive/2026/texmf-dist/metapost/base/graph.mp
(/usr/local/texlive/2026/texmf-dist/metapost/base/marith.mp
(/usr/local/texlive/2026/texmf-dist/metapost/base/string.mp))
(/usr/local/texlive/2026/texmf-dist/metapost/base/format.mp
(/usr/local/texlive/2026/texmf-dist/metapost/base/string.mp)
(/usr/local/texlive/2026/texmf-dist/metapost/base/texnum.mp))) [1{psfonts.map}<
cmr10.pfb><cmr8.pfb>] )
1 output file written: MPT-13-002.svg
Transcript written on MPT-13-002.log.
Command or parameter
Meaning
gdata(file,row,commands)
Execute commands for each row; row1, row2, etc. are strings.
scantokens row3
Convert a reviewed numeric field into a number.
augment.modelpath
Append a selected coordinate pair to the existing path.
Complete standalone MetaPost program
prologues:=3;outputformat:="svg";defaultfont:="cmr10";defaultscale:=1.1;colorBlue,Teal,Orange,Green,Grey,Light,Wash;Blue:=(0,84/255,159/255);Teal:=(0,177/255,183/255);Orange:=(246/255,168/255,0);Green:=(87/255,171/255,39/255);Grey:=(100/255,101/255,103/255);Light:=(236/255,236/255,237/255);Wash:=(232/255,241/255,250/255);% Format displayed numbers to hundredths using integer strings.vardefnumlabel(exprvalue)=saven,whole,frac;numericn,whole,frac;n:=round(100absvalue);whole:=floor(n/100);frac:=nmod100;(ifvalue<-.005:"-" & fidecimalwholeiffrac>0: & "." & iffrac<10:"0" & fidecimalfracfi)enddef;pickuppencirclescaled.9;outputtemplate:="MPT-13-002.svg";beginfig(1);fillunitsquarexscaled320yscaled220withcolorwhite;% BEGIN DRAWINGinputgraph;pathmodelpath;gdata("data/readings.dat",row,ifi=1:modelpath:=(scantokensrow1,scantokensrow3);else:augment.modelpath(scantokensrow1,scantokensrow3);fi);drawbegingraph(240,140);setrange(0,0,8,6);gdrawmodelpathwithcolorTealwithpenpencirclescaled1.5;glabel.bot(btex Time (s) etex,OUT);glabel.lft(btex Model (a.u.) etexrotated90,OUT);endgraphshifted(55,42);% END DRAWINGlabel.lft("MPT-13-002"infont"cmr8",(312,210));setboundscurrentpicturetounitsquarexscaled320yscaled220;endfig;end.
readfrom returns one string per physical line. Stop at EOF and skip the deliberately empty line in points.dat. scantokens parses the reviewed pair notation; it is not a general CSV reader.
This is MetaPost, version 3.00 (TeX Live 2026) (kpathsea version 6.4.2)
(/usr/local/texlive/2026/texmf-dist/metapost/base/mpost.mp
(/usr/local/texlive/2026/texmf-dist/metapost/base/plain.mp
Preloading the plain mem file, version 1.005) ) (./MPT-13-003.mp [1{psfonts.map
}<cmr10.pfb><cmr8.pfb>] )
1 output file written: MPT-13-003.svg
Transcript written on MPT-13-003.log.
Command or parameter
Meaning
readfrom / EOF
Read each physical line once; stop before another read restarts the file.
line<>""
Skip an empty line explicitly.
scantokens line
Parse trusted numeric pairs; arbitrary text may contain executable tokens.
Complete standalone MetaPost program
prologues:=3;outputformat:="svg";defaultfont:="cmr10";defaultscale:=1.1;colorBlue,Teal,Orange,Green,Grey,Light,Wash;Blue:=(0,84/255,159/255);Teal:=(0,177/255,183/255);Orange:=(246/255,168/255,0);Green:=(87/255,171/255,39/255);Grey:=(100/255,101/255,103/255);Light:=(236/255,236/255,237/255);Wash:=(232/255,241/255,250/255);% Format displayed numbers to hundredths using integer strings.vardefnumlabel(exprvalue)=saven,whole,frac;numericn,whole,frac;n:=round(100absvalue);whole:=floor(n/100);frac:=nmod100;(ifvalue<-.005:"-" & fidecimalwholeiffrac>0: & "." & iffrac<10:"0" & fidecimalfracfi)enddef;pickuppencirclescaled.9;outputtemplate:="MPT-13-003.svg";beginfig(1);fillunitsquarexscaled320yscaled220withcolorwhite;% BEGIN DRAWINGstringline;pairp;pathcurve;booleanstarted;started:=false;forever:line:=readfrom"data/points.dat";exitifline=EOF;ifline<>"":p:=scantokensline;p:=(45+30*xpartp,40+26*ypartp);ifstarted:curve:=curve--p;else:curve:=p;fistarted:=true;fiendfor;draw(45,196)--(45,40)--(285,40)withcolorGrey;drawcurvewithpenpencirclescaled1.5withcolorBlue;label.bot("Time (s)",(165,30));label.lft("0",(40,40));label.lft("6",(40,196));forx=0upto8:label.bot(decimalx,(45+30x,40));endfor;label.top("Response (a.u.)",(165,181));% END DRAWINGlabel.lft("MPT-13-003"infont"cmr8",(312,210));setboundscurrentpicturetounitsquarexscaled320yscaled220;endfig;end.
Ignore the placeholder at t = 3 and reset the connection flag. A measured zero would still be drawn when validity = 1. Joining every valid point would misleadingly bridge the missing observation.
inputgraph;numericx,y;pairp,previous;booleanconnected;connected:=false;draw(45,196)--(45,40)--(285,40)withcolorGrey;gdata("data/readings.dat",row,ifscantokensrow6=1:x:=scantokensrow1;y:=scantokensrow2;p:=(45+30x,40+26y);ifconnected:drawprevious--pwithcolorBlue;fifillfullcirclescaled4shiftedpwithcolorBlue;previous:=p;connected:=true;else:connected:=false;fi);label.bot("Time (s)",(165,30));label.top("Response (a.u.); missing at t = 3",(165,181));forx=0upto8:label.bot(decimalx,(45+30x,40));endfor;fory=0step2until6:label.lft(decimaly,(42,40+26y));endfor;
Actual output
MPT-13-004 · Rendered by MetaPost
MetaPost · exit 0
Native compiler log
Standard output
This is MetaPost, version 3.00 (TeX Live 2026) (kpathsea version 6.4.2)
(/usr/local/texlive/2026/texmf-dist/metapost/base/mpost.mp
(/usr/local/texlive/2026/texmf-dist/metapost/base/plain.mp
Preloading the plain mem file, version 1.005) ) (./MPT-13-004.mp
(/usr/local/texlive/2026/texmf-dist/metapost/base/graph.mp
(/usr/local/texlive/2026/texmf-dist/metapost/base/marith.mp
(/usr/local/texlive/2026/texmf-dist/metapost/base/string.mp))
(/usr/local/texlive/2026/texmf-dist/metapost/base/format.mp
(/usr/local/texlive/2026/texmf-dist/metapost/base/string.mp)
(/usr/local/texlive/2026/texmf-dist/metapost/base/texnum.mp))) [1{psfonts.map}<
cmr10.pfb><cmr8.pfb>] )
1 output file written: MPT-13-004.svg
Transcript written on MPT-13-004.log.
Command or parameter
Meaning
row6=1
Use the explicit validity flag, never the placeholder value.
connected:=false
Break the line at a missing row.
previous--p
Draw segments only between consecutive observed rows.
Complete standalone MetaPost program
prologues:=3;outputformat:="svg";defaultfont:="cmr10";defaultscale:=1.1;colorBlue,Teal,Orange,Green,Grey,Light,Wash;Blue:=(0,84/255,159/255);Teal:=(0,177/255,183/255);Orange:=(246/255,168/255,0);Green:=(87/255,171/255,39/255);Grey:=(100/255,101/255,103/255);Light:=(236/255,236/255,237/255);Wash:=(232/255,241/255,250/255);% Format displayed numbers to hundredths using integer strings.vardefnumlabel(exprvalue)=saven,whole,frac;numericn,whole,frac;n:=round(100absvalue);whole:=floor(n/100);frac:=nmod100;(ifvalue<-.005:"-" & fidecimalwholeiffrac>0: & "." & iffrac<10:"0" & fidecimalfracfi)enddef;pickuppencirclescaled.9;outputtemplate:="MPT-13-004.svg";beginfig(1);fillunitsquarexscaled320yscaled220withcolorwhite;% BEGIN DRAWINGinputgraph;numericx,y;pairp,previous;booleanconnected;connected:=false;draw(45,196)--(45,40)--(285,40)withcolorGrey;gdata("data/readings.dat",row,ifscantokensrow6=1:x:=scantokensrow1;y:=scantokensrow2;p:=(45+30x,40+26y);ifconnected:drawprevious--pwithcolorBlue;fifillfullcirclescaled4shiftedpwithcolorBlue;previous:=p;connected:=true;else:connected:=false;fi);label.bot("Time (s)",(165,30));label.top("Response (a.u.); missing at t = 3",(165,181));forx=0upto8:label.bot(decimalx,(45+30x,40));endfor;fory=0step2until6:label.lft(decimaly,(42,40+26y));endfor;% END DRAWINGlabel.lft("MPT-13-004"infont"cmr8",(312,210));setboundscurrentpicturetounitsquarexscaled320yscaled220;endfig;end.
Read the lower and upper endpoints independently. The observation need not sit at their midpoint. Skip the absent row and use a short horizontal cap at each endpoint; these synthetic bounds have no confidence-level interpretation.
This is MetaPost, version 3.00 (TeX Live 2026) (kpathsea version 6.4.2)
(/usr/local/texlive/2026/texmf-dist/metapost/base/mpost.mp
(/usr/local/texlive/2026/texmf-dist/metapost/base/plain.mp
Preloading the plain mem file, version 1.005) ) (./MPT-13-005.mp
(/usr/local/texlive/2026/texmf-dist/metapost/base/graph.mp
(/usr/local/texlive/2026/texmf-dist/metapost/base/marith.mp
(/usr/local/texlive/2026/texmf-dist/metapost/base/string.mp))
(/usr/local/texlive/2026/texmf-dist/metapost/base/format.mp
(/usr/local/texlive/2026/texmf-dist/metapost/base/string.mp)
(/usr/local/texlive/2026/texmf-dist/metapost/base/texnum.mp))) [1{psfonts.map}<
cmr10.pfb><cmr8.pfb>] )
1 output file written: MPT-13-005.svg
Transcript written on MPT-13-005.log.
Command or parameter
Meaning
row4 / row5
Store actual interval endpoints, not a symmetric plus/minus width.
Short caps
Keep interval ends visible without obscuring the points.
row6
Apply the same validity rule to the point and both endpoints.
Complete standalone MetaPost program
prologues:=3;outputformat:="svg";defaultfont:="cmr10";defaultscale:=1.1;colorBlue,Teal,Orange,Green,Grey,Light,Wash;Blue:=(0,84/255,159/255);Teal:=(0,177/255,183/255);Orange:=(246/255,168/255,0);Green:=(87/255,171/255,39/255);Grey:=(100/255,101/255,103/255);Light:=(236/255,236/255,237/255);Wash:=(232/255,241/255,250/255);% Format displayed numbers to hundredths using integer strings.vardefnumlabel(exprvalue)=saven,whole,frac;numericn,whole,frac;n:=round(100absvalue);whole:=floor(n/100);frac:=nmod100;(ifvalue<-.005:"-" & fidecimalwholeiffrac>0: & "." & iffrac<10:"0" & fidecimalfracfi)enddef;pickuppencirclescaled.9;outputtemplate:="MPT-13-005.svg";beginfig(1);fillunitsquarexscaled320yscaled220withcolorwhite;% BEGIN DRAWINGinputgraph;numericx,y,lo,hi;draw(45,196)--(45,40)--(285,40)withcolorGrey;gdata("data/readings.dat",row,ifscantokensrow6=1:x:=45+30*(scantokensrow1);y:=40+26*(scantokensrow2);lo:=40+26*(scantokensrow4);hi:=40+26*(scantokensrow5);draw(x,lo)--(x,hi)withcolorGrey;draw(x-3,lo)--(x+3,lo)withcolorGrey;draw(x-3,hi)--(x+3,hi)withcolorGrey;fillfullcirclescaled4shifted(x,y)withcolorBlue;fi);label.bot("Time (s)",(165,30));label.top("Response (a.u.); illustrative bounds",(165,181));forx=0upto8:label.bot(decimalx,(45+30x,40));endfor;fory=0step2until6:label.lft(decimaly,(42,40+26y));endfor;% END DRAWINGlabel.lft("MPT-13-005"infont"cmr8",(312,210));setboundscurrentpicturetounitsquarexscaled320yscaled220;endfig;end.
Read the complete calibration series into arrays. Average each interior triple and plot the result at its middle time. Omit the two endpoints instead of silently padding them or changing the window width.
inputgraph;numericn,t[],v[];pathraw,smoothed;n:=0;gdata("data/calibration.dat",row,n:=n+1;t[n]:=scantokensrow1;v[n]:=scantokensrow2;);raw:=forj=1upton:ifj>1:--fi(t[j],v[j])endfor;smoothed:=forj=2upton-1:ifj>2:--fi(t[j],(v[j-1]+v[j]+v[j+1])/3)endfor;drawbegingraph(240,140);setrange(0,0,8,6);gdrawrawwithcolorGrey;gdrawsmoothedwithpenpencirclescaled1.8withcolorBlue;glabel.bot(btex Time (s) etex,OUT);glabel.lft(btex Response (a.u.) etexrotated90,OUT);endgraphshifted(55,42);message"MPT-13-006: rows=" & decimaln & "; centres=" & decimal(n-2);
Actual output
MPT-13-006 · Rendered by MetaPost
MetaPost · exit 0
Native compiler log
Standard output
This is MetaPost, version 3.00 (TeX Live 2026) (kpathsea version 6.4.2)
(/usr/local/texlive/2026/texmf-dist/metapost/base/mpost.mp
(/usr/local/texlive/2026/texmf-dist/metapost/base/plain.mp
Preloading the plain mem file, version 1.005) ) (./MPT-13-006.mp
(/usr/local/texlive/2026/texmf-dist/metapost/base/graph.mp
(/usr/local/texlive/2026/texmf-dist/metapost/base/marith.mp
(/usr/local/texlive/2026/texmf-dist/metapost/base/string.mp))
(/usr/local/texlive/2026/texmf-dist/metapost/base/format.mp
(/usr/local/texlive/2026/texmf-dist/metapost/base/string.mp)
(/usr/local/texlive/2026/texmf-dist/metapost/base/texnum.mp)))
MPT-13-006: rows=9; centres=7 [1{psfonts.map}<cmr10.pfb><cmr8.pfb>] )
1 output file written: MPT-13-006.svg
Transcript written on MPT-13-006.log.
Command or parameter
Meaning
v[j-1]+v[j]+v[j+1]
A three-observation centred mean; appropriate here for equally spaced times.
2 upto n-1
Draw only locations with a complete window.
message
Record nine input rows and seven computed centres in the compiler log.
Complete standalone MetaPost program
prologues:=3;outputformat:="svg";defaultfont:="cmr10";defaultscale:=1.1;colorBlue,Teal,Orange,Green,Grey,Light,Wash;Blue:=(0,84/255,159/255);Teal:=(0,177/255,183/255);Orange:=(246/255,168/255,0);Green:=(87/255,171/255,39/255);Grey:=(100/255,101/255,103/255);Light:=(236/255,236/255,237/255);Wash:=(232/255,241/255,250/255);% Format displayed numbers to hundredths using integer strings.vardefnumlabel(exprvalue)=saven,whole,frac;numericn,whole,frac;n:=round(100absvalue);whole:=floor(n/100);frac:=nmod100;(ifvalue<-.005:"-" & fidecimalwholeiffrac>0: & "." & iffrac<10:"0" & fidecimalfracfi)enddef;pickuppencirclescaled.9;outputtemplate:="MPT-13-006.svg";beginfig(1);fillunitsquarexscaled320yscaled220withcolorwhite;% BEGIN DRAWINGinputgraph;numericn,t[],v[];pathraw,smoothed;n:=0;gdata("data/calibration.dat",row,n:=n+1;t[n]:=scantokensrow1;v[n]:=scantokensrow2;);raw:=forj=1upton:ifj>1:--fi(t[j],v[j])endfor;smoothed:=forj=2upton-1:ifj>2:--fi(t[j],(v[j-1]+v[j]+v[j+1])/3)endfor;drawbegingraph(240,140);setrange(0,0,8,6);gdrawrawwithcolorGrey;gdrawsmoothedwithpenpencirclescaled1.8withcolorBlue;glabel.bot(btex Time (s) etex,OUT);glabel.lft(btex Response (a.u.) etexrotated90,OUT);endgraphshifted(55,42);message"MPT-13-006: rows=" & decimaln & "; centres=" & decimal(n-2);% END DRAWINGlabel.lft("MPT-13-006"infont"cmr8",(312,210));setboundscurrentpicturetounitsquarexscaled320yscaled220;endfig;end.
Input data: data/calibration.dat. Extract the source + data ZIP before running the program.
14 · Complete publication figures
Use the same synthetic readings in several compositions. Each complete program
loads the six columns into t, observed, model, low, high and valid arrays before
drawing; expand its source to see that reader. All panels use explicit scales,
shared units and the same Computer Modern typography. Ordinary MetaPost pairs,
pictures and transformations are sufficient for layout. Keep the published
figure's physical size in mind: resizing a complete picture also resizes its
lettering and pen widths. The capstone specifies a 420 by 280 bp canvas.
Draw observation and model in equal panels. Both share x = 0..8 and y = 0..6; the observed panel omits the missing observation. Different automatic ranges would exaggerate or suppress their visual difference.
This is MetaPost, version 3.00 (TeX Live 2026) (kpathsea version 6.4.2)
(/usr/local/texlive/2026/texmf-dist/metapost/base/mpost.mp
(/usr/local/texlive/2026/texmf-dist/metapost/base/plain.mp
Preloading the plain mem file, version 1.005) ) (./MPT-14-001.mp
(/usr/local/texlive/2026/texmf-dist/metapost/base/graph.mp
(/usr/local/texlive/2026/texmf-dist/metapost/base/marith.mp
(/usr/local/texlive/2026/texmf-dist/metapost/base/string.mp))
(/usr/local/texlive/2026/texmf-dist/metapost/base/format.mp
(/usr/local/texlive/2026/texmf-dist/metapost/base/string.mp)
(/usr/local/texlive/2026/texmf-dist/metapost/base/texnum.mp))) [1{psfonts.map}<
cmr10.pfb><cmr8.pfb>] )
1 output file written: MPT-14-001.svg
Transcript written on MPT-14-001.log.
Command or parameter
Meaning
panel(origin,which)
Reuse one panel geometry; select only the displayed data.
14t[j],20y
Use identical units per point in both panels.
valid[j]
Omit the missing observation in panel (a).
Complete standalone MetaPost program
prologues:=3;outputformat:="svg";defaultfont:="cmr10";defaultscale:=1.1;colorBlue,Teal,Orange,Green,Grey,Light,Wash;Blue:=(0,84/255,159/255);Teal:=(0,177/255,183/255);Orange:=(246/255,168/255,0);Green:=(87/255,171/255,39/255);Grey:=(100/255,101/255,103/255);Light:=(236/255,236/255,237/255);Wash:=(232/255,241/255,250/255);% Format displayed numbers to hundredths using integer strings.vardefnumlabel(exprvalue)=saven,whole,frac;numericn,whole,frac;n:=round(100absvalue);whole:=floor(n/100);frac:=nmod100;(ifvalue<-.005:"-" & fidecimalwholeiffrac>0: & "." & iffrac<10:"0" & fidecimalfracfi)enddef;pickuppencirclescaled.9;outputtemplate:="MPT-14-001.svg";inputgraph;numericn,t[],observed[],model[],low[],high[],valid[];n:=0;gdata("data/readings.dat",row,n:=n+1;t[n]:=scantokensrow1;observed[n]:=scantokensrow2;model[n]:=scantokensrow3;low[n]:=scantokensrow4;high[n]:=scantokensrow5;valid[n]:=scantokensrow6;);beginfig(1);fillunitsquarexscaled320yscaled220withcolorwhite;% BEGIN DRAWINGvardefpanel(exprorigin,which)=draw(origin+(0,120))--origin--(origin+(112,0))withcolorGrey;forj=1upton:if(which=2)or(valid[j]=1):fillfullcirclescaled3shifted(origin+(14t[j],20*(ifwhich=1:observed[j]else:model[j]fi)))withcolorifwhich=1:Blueelse:Tealfi;fiendfor;label.lft("0",origin);label.lft("6",origin+(0,120));label.bot("0",origin);label.bot("8",origin+(112,0));label.bot("Time (s)",origin+(56,-13));enddef;panel((40,47),1);panel((188,47),2);label.top("(a) Observed",(96,176));label.top("(b) Model",(244,176));label("Response (a.u.); identical axes"infont"cmr8",(165,196));% END DRAWINGlabel.lft("MPT-14-001"infont"cmr8",(312,210));setboundscurrentpicturetounitsquarexscaled320yscaled220;endfig;end.
Use one x mapping for an upper response panel and a lower residual panel. Residual means observed minus model, so positive residuals appear above zero. The missing observation contributes to neither panel.
This is MetaPost, version 3.00 (TeX Live 2026) (kpathsea version 6.4.2)
(/usr/local/texlive/2026/texmf-dist/metapost/base/mpost.mp
(/usr/local/texlive/2026/texmf-dist/metapost/base/plain.mp
Preloading the plain mem file, version 1.005) ) (./MPT-14-002.mp
(/usr/local/texlive/2026/texmf-dist/metapost/base/graph.mp
(/usr/local/texlive/2026/texmf-dist/metapost/base/marith.mp
(/usr/local/texlive/2026/texmf-dist/metapost/base/string.mp))
(/usr/local/texlive/2026/texmf-dist/metapost/base/format.mp
(/usr/local/texlive/2026/texmf-dist/metapost/base/string.mp)
(/usr/local/texlive/2026/texmf-dist/metapost/base/texnum.mp))) [1{psfonts.map}<
cmr10.pfb><cmr8.pfb>] )
1 output file written: MPT-14-002.svg
Transcript written on MPT-14-002.log.
Command or parameter
Meaning
xx(x)
Share exactly the same horizontal transform between panels.
observed[j]-model[j]
Define the residual and its sign explicitly.
Dashed zero line
Provide a visual reference for positive and negative residuals.
Complete standalone MetaPost program
prologues:=3;outputformat:="svg";defaultfont:="cmr10";defaultscale:=1.1;colorBlue,Teal,Orange,Green,Grey,Light,Wash;Blue:=(0,84/255,159/255);Teal:=(0,177/255,183/255);Orange:=(246/255,168/255,0);Green:=(87/255,171/255,39/255);Grey:=(100/255,101/255,103/255);Light:=(236/255,236/255,237/255);Wash:=(232/255,241/255,250/255);% Format displayed numbers to hundredths using integer strings.vardefnumlabel(exprvalue)=saven,whole,frac;numericn,whole,frac;n:=round(100absvalue);whole:=floor(n/100);frac:=nmod100;(ifvalue<-.005:"-" & fidecimalwholeiffrac>0: & "." & iffrac<10:"0" & fidecimalfracfi)enddef;pickuppencirclescaled.9;outputtemplate:="MPT-14-002.svg";inputgraph;numericn,t[],observed[],model[],low[],high[],valid[];n:=0;gdata("data/readings.dat",row,n:=n+1;t[n]:=scantokensrow1;observed[n]:=scantokensrow2;model[n]:=scantokensrow3;low[n]:=scantokensrow4;high[n]:=scantokensrow5;valid[n]:=scantokensrow6;);beginfig(1);fillunitsquarexscaled320yscaled220withcolorwhite;% BEGIN DRAWINGvardefxx(exprx)=45+30xenddef;draw(45,190)--(45,110)--(285,110)withcolorGrey;draw(45,90)--(45,42)--(285,42)withcolorGrey;draw(45,66)--(285,66)dashedevenlywithcolorGrey;forj=1upton:ifvalid[j]=1:fillfullcirclescaled4shifted(xx(t[j]),110+13observed[j])withcolorBlue;fillfullcirclescaled4shifted(xx(t[j]),66+40*(observed[j]-model[j]))withcolorTeal;fiendfor;draw(xx(0),123)--(xx(8),110+13model[n])withcolorOrange;label.lft("0",(42,110));label.lft("6",(42,188));fory=-.6step.6until.6:label.lft(numlabel(y),(42,66+40y));endfor;label.top("(a) Response (a.u.)",(165,190));label.top("(b) Residual (a.u.)",(165,88));forj=0upto8:label.bot(decimalj,(xx(j),42));endfor;label.bot("Time (s)",(165,25));% END DRAWINGlabel.lft("MPT-14-002"infont"cmr8",(312,210));setboundscurrentpicturetounitsquarexscaled320yscaled220;endfig;end.
Capture a complete panel in a picture and move two copies. Shifting preserves font size and stroke width. A shared y label and matching axes keep the composition compact; panel letters distinguish the two views.
picturepanel;panel:=image(draw(0,115)--(0,0)--(112,0)withcolorGrey;forj=1upton:ifvalid[j]=1:draw(14t[j],19low[j])--(14t[j],19high[j])withcolorGrey;fillfullcirclescaled3shifted(14t[j],19observed[j])withcolorBlue;fiendfor;label.lft("0",(0,0));label.lft("6",(0,114));label.bot("0",(0,0));label.bot("8",(112,0));label.bot("Time (s)",(56,-13)););drawpanelshifted(40,48);drawpanelshifted(188,48);label.top("(a) Intervals",(96,176));label.top("(b) With model",(244,176));draw(188,67)--(300,48+19model[n])dashedevenlywithcolorOrange;label("Response (a.u.)"infont"cmr8",(165,196));
Actual output
MPT-14-003 · Rendered by MetaPost
MetaPost · exit 0
Native compiler log
Standard output
This is MetaPost, version 3.00 (TeX Live 2026) (kpathsea version 6.4.2)
(/usr/local/texlive/2026/texmf-dist/metapost/base/mpost.mp
(/usr/local/texlive/2026/texmf-dist/metapost/base/plain.mp
Preloading the plain mem file, version 1.005) ) (./MPT-14-003.mp
(/usr/local/texlive/2026/texmf-dist/metapost/base/graph.mp
(/usr/local/texlive/2026/texmf-dist/metapost/base/marith.mp
(/usr/local/texlive/2026/texmf-dist/metapost/base/string.mp))
(/usr/local/texlive/2026/texmf-dist/metapost/base/format.mp
(/usr/local/texlive/2026/texmf-dist/metapost/base/string.mp)
(/usr/local/texlive/2026/texmf-dist/metapost/base/texnum.mp))) [1{psfonts.map}<
cmr10.pfb><cmr8.pfb>] )
1 output file written: MPT-14-003.svg
Transcript written on MPT-14-003.log.
Command or parameter
Meaning
image(...)
Collect axes, marks and labels in one reusable picture.
shifted
Translate a panel while preserving physical type and pen sizes.
Overlay after placement
Add the model only to the second translated panel.
Complete standalone MetaPost program
prologues:=3;outputformat:="svg";defaultfont:="cmr10";defaultscale:=1.1;colorBlue,Teal,Orange,Green,Grey,Light,Wash;Blue:=(0,84/255,159/255);Teal:=(0,177/255,183/255);Orange:=(246/255,168/255,0);Green:=(87/255,171/255,39/255);Grey:=(100/255,101/255,103/255);Light:=(236/255,236/255,237/255);Wash:=(232/255,241/255,250/255);% Format displayed numbers to hundredths using integer strings.vardefnumlabel(exprvalue)=saven,whole,frac;numericn,whole,frac;n:=round(100absvalue);whole:=floor(n/100);frac:=nmod100;(ifvalue<-.005:"-" & fidecimalwholeiffrac>0: & "." & iffrac<10:"0" & fidecimalfracfi)enddef;pickuppencirclescaled.9;outputtemplate:="MPT-14-003.svg";inputgraph;numericn,t[],observed[],model[],low[],high[],valid[];n:=0;gdata("data/readings.dat",row,n:=n+1;t[n]:=scantokensrow1;observed[n]:=scantokensrow2;model[n]:=scantokensrow3;low[n]:=scantokensrow4;high[n]:=scantokensrow5;valid[n]:=scantokensrow6;);beginfig(1);fillunitsquarexscaled320yscaled220withcolorwhite;% BEGIN DRAWINGpicturepanel;panel:=image(draw(0,115)--(0,0)--(112,0)withcolorGrey;forj=1upton:ifvalid[j]=1:draw(14t[j],19low[j])--(14t[j],19high[j])withcolorGrey;fillfullcirclescaled3shifted(14t[j],19observed[j])withcolorBlue;fiendfor;label.lft("0",(0,0));label.lft("6",(0,114));label.bot("0",(0,0));label.bot("8",(112,0));label.bot("Time (s)",(56,-13)););drawpanelshifted(40,48);drawpanelshifted(188,48);label.top("(a) Intervals",(96,176));label.top("(b) With model",(244,176));draw(188,67)--(300,48+19model[n])dashedevenlywithcolorOrange;label("Response (a.u.)"infont"cmr8",(165,196));% END DRAWINGlabel.lft("MPT-14-003"infont"cmr8",(312,210));setboundscurrentpicturetounitsquarexscaled320yscaled220;endfig;end.
Divide each observed and model response by its own value at t = 0. Both start at one. The dimensionless ratios compare relative change, rather than making different starting values disappear without explanation.
vardefxy(exprx,y)=(45+30x,40+32y)enddef;numerica,b;a:=observed[1];b:=model[1];draw(45,194)--(45,40)--(285,40)withcolorGrey;drawxy(0,1)--xy(8,1)dashedevenlywithcolorGrey;forj=1upton:ifvalid[j]=1:fillfullcirclescaled4shiftedxy(t[j],observed[j]/a)withcolorBlue;fiendfor;drawxy(0,model[1]/b)--xy(8,model[n]/b)withcolorTeal;label.lft("1",xy(0,1));label.lft("4",xy(0,4));forj=0upto8:label.bot(decimalj,xy(j,0));endfor;label.bot("Time (s)",(165,26));label.top("Ratio to own t = 0 baseline",(165,181));message"MPT-14-004: observed baseline=" & numlabel(a)
& "; model baseline=" & numlabel(b);
Actual output
MPT-14-004 · Rendered by MetaPost
MetaPost · exit 0
Native compiler log
Standard output
This is MetaPost, version 3.00 (TeX Live 2026) (kpathsea version 6.4.2)
(/usr/local/texlive/2026/texmf-dist/metapost/base/mpost.mp
(/usr/local/texlive/2026/texmf-dist/metapost/base/plain.mp
Preloading the plain mem file, version 1.005) ) (./MPT-14-004.mp
(/usr/local/texlive/2026/texmf-dist/metapost/base/graph.mp
(/usr/local/texlive/2026/texmf-dist/metapost/base/marith.mp
(/usr/local/texlive/2026/texmf-dist/metapost/base/string.mp))
(/usr/local/texlive/2026/texmf-dist/metapost/base/format.mp
(/usr/local/texlive/2026/texmf-dist/metapost/base/string.mp)
(/usr/local/texlive/2026/texmf-dist/metapost/base/texnum.mp)))
MPT-14-004: observed baseline=1.20; model baseline=1 [1{psfonts.map}<cmr10.pfb>
<cmr8.pfb>] )
1 output file written: MPT-14-004.svg
Transcript written on MPT-14-004.log.
Command or parameter
Meaning
observed[1] / model[1]
Use each series' first valid, nonzero baseline; these fixtures provide both at t = 0.
Dimensionless ratio
State the transformation so the reader can recover its meaning.
Baseline reference
A ratio of one means no change from that series' starting value.
Complete standalone MetaPost program
prologues:=3;outputformat:="svg";defaultfont:="cmr10";defaultscale:=1.1;colorBlue,Teal,Orange,Green,Grey,Light,Wash;Blue:=(0,84/255,159/255);Teal:=(0,177/255,183/255);Orange:=(246/255,168/255,0);Green:=(87/255,171/255,39/255);Grey:=(100/255,101/255,103/255);Light:=(236/255,236/255,237/255);Wash:=(232/255,241/255,250/255);% Format displayed numbers to hundredths using integer strings.vardefnumlabel(exprvalue)=saven,whole,frac;numericn,whole,frac;n:=round(100absvalue);whole:=floor(n/100);frac:=nmod100;(ifvalue<-.005:"-" & fidecimalwholeiffrac>0: & "." & iffrac<10:"0" & fidecimalfracfi)enddef;pickuppencirclescaled.9;outputtemplate:="MPT-14-004.svg";inputgraph;numericn,t[],observed[],model[],low[],high[],valid[];n:=0;gdata("data/readings.dat",row,n:=n+1;t[n]:=scantokensrow1;observed[n]:=scantokensrow2;model[n]:=scantokensrow3;low[n]:=scantokensrow4;high[n]:=scantokensrow5;valid[n]:=scantokensrow6;);beginfig(1);fillunitsquarexscaled320yscaled220withcolorwhite;% BEGIN DRAWINGvardefxy(exprx,y)=(45+30x,40+32y)enddef;numerica,b;a:=observed[1];b:=model[1];draw(45,194)--(45,40)--(285,40)withcolorGrey;drawxy(0,1)--xy(8,1)dashedevenlywithcolorGrey;forj=1upton:ifvalid[j]=1:fillfullcirclescaled4shiftedxy(t[j],observed[j]/a)withcolorBlue;fiendfor;drawxy(0,model[1]/b)--xy(8,model[n]/b)withcolorTeal;label.lft("1",xy(0,1));label.lft("4",xy(0,4));forj=0upto8:label.bot(decimalj,xy(j,0));endfor;label.bot("Time (s)",(165,26));label.top("Ratio to own t = 0 baseline",(165,181));message"MPT-14-004: observed baseline=" & numlabel(a)
& "; model baseline=" & numlabel(b);% END DRAWINGlabel.lft("MPT-14-004"infont"cmr8",(312,210));setboundscurrentpicturetounitsquarexscaled320yscaled220;endfig;end.
Use hollow circles for observed values and a dashed line for the model. Shape and stroke carry series identity alongside colour. Draw the legend with those exact marks and keep it inside the canvas.
This is MetaPost, version 3.00 (TeX Live 2026) (kpathsea version 6.4.2)
(/usr/local/texlive/2026/texmf-dist/metapost/base/mpost.mp
(/usr/local/texlive/2026/texmf-dist/metapost/base/plain.mp
Preloading the plain mem file, version 1.005) ) (./MPT-14-005.mp
(/usr/local/texlive/2026/texmf-dist/metapost/base/graph.mp
(/usr/local/texlive/2026/texmf-dist/metapost/base/marith.mp
(/usr/local/texlive/2026/texmf-dist/metapost/base/string.mp))
(/usr/local/texlive/2026/texmf-dist/metapost/base/format.mp
(/usr/local/texlive/2026/texmf-dist/metapost/base/string.mp)
(/usr/local/texlive/2026/texmf-dist/metapost/base/texnum.mp))) [1{psfonts.map}<
cmr10.pfb><cmr8.pfb>] )
1 output file written: MPT-14-005.svg
Transcript written on MPT-14-005.log.
Command or parameter
Meaning
Hollow circle
Identify observations by shape as well as colour.
dashed evenly
Give the model a distinct stroke in colour and greyscale.
Matching legend marks
Use the same shape, dash and colour as the plotted series.
Complete standalone MetaPost program
prologues:=3;outputformat:="svg";defaultfont:="cmr10";defaultscale:=1.1;colorBlue,Teal,Orange,Green,Grey,Light,Wash;Blue:=(0,84/255,159/255);Teal:=(0,177/255,183/255);Orange:=(246/255,168/255,0);Green:=(87/255,171/255,39/255);Grey:=(100/255,101/255,103/255);Light:=(236/255,236/255,237/255);Wash:=(232/255,241/255,250/255);% Format displayed numbers to hundredths using integer strings.vardefnumlabel(exprvalue)=saven,whole,frac;numericn,whole,frac;n:=round(100absvalue);whole:=floor(n/100);frac:=nmod100;(ifvalue<-.005:"-" & fidecimalwholeiffrac>0: & "." & iffrac<10:"0" & fidecimalfracfi)enddef;pickuppencirclescaled.9;outputtemplate:="MPT-14-005.svg";inputgraph;numericn,t[],observed[],model[],low[],high[],valid[];n:=0;gdata("data/readings.dat",row,n:=n+1;t[n]:=scantokensrow1;observed[n]:=scantokensrow2;model[n]:=scantokensrow3;low[n]:=scantokensrow4;high[n]:=scantokensrow5;valid[n]:=scantokensrow6;);beginfig(1);fillunitsquarexscaled320yscaled220withcolorwhite;% BEGIN DRAWINGvardefxy(exprx,y)=(45+30x,40+26y)enddef;draw(45,196)--(45,40)--(285,40)withcolorGrey;forj=1upton:ifvalid[j]=1:drawfullcirclescaled5shiftedxy(t[j],observed[j])withpenpencirclescaled1.1withcolorBlue;fiendfor;drawxy(0,model[1])--xy(8,model[n])dashedevenlywithpenpencirclescaled1.3withcolorTeal;drawfullcirclescaled5shifted(65,177)withcolorBlue;label.rt("Observed",(72,177));draw(183,177)--(205,177)dashedevenlywithcolorTeal;label.rt("Model",(212,177));forj=0upto8:label.bot(decimalj,xy(j,0));endfor;label.bot("Time (s)",(165,26));label.lft("0",xy(0,0));label.lft("6",xy(0,6));label("Response (a.u.)",(165,195));% END DRAWINGlabel.lft("MPT-14-005"infont"cmr8",(312,210));setboundscurrentpicturetounitsquarexscaled320yscaled220;endfig;end.
Combine asymmetric bounds, a dashed model, aligned residuals, physical units, panel letters and a concise caption. The expanded program contains the file reader and panel helpers. Its log records the eight valid observations and mean residual; the downloadable PDF embeds the exact source and inputs.
publication_axes;forj=1upton:ifvalid[j]=1:interval_at(t[j],low[j],high[j]);drawfullcirclescaled5shiftedmainpoint(t[j],observed[j])withcolorBlue;fillfullcirclescaled4shiftedresidualpoint(t[j],observed[j]-model[j])withcolorTeal;fiendfor;drawmainpoint(0,model[1])--mainpoint(8,model[n])dashedevenlywithpenpencirclescaled1.3withcolorOrange;label("Synthetic response and model"infont"cmbx10",(220,257));drawfullcirclescaled5shifted(90,242)withcolorBlue;label.rt("Observed + bounds",(98,242));draw(263,242)--(283,242)dashedevenlywithcolorOrange;label.rt("Model",(291,242));label("Synthetic data; missing at 3 s. Bounds are illustrative."infont"cmr8",(220,14));message"MPT-14-006: valid=" & decimalcount
& "; residual sum=" & numlabel(total)
& "; mean=" & decimal(total/count);
Actual output
MPT-14-006 · Rendered by MetaPost
MetaPost · exit 0
Native compiler log
Standard output
This is MetaPost, version 3.00 (TeX Live 2026) (kpathsea version 6.4.2)
(/usr/local/texlive/2026/texmf-dist/metapost/base/mpost.mp
(/usr/local/texlive/2026/texmf-dist/metapost/base/plain.mp
Preloading the plain mem file, version 1.005) ) (./MPT-14-006.mp
(/usr/local/texlive/2026/texmf-dist/metapost/base/graph.mp
(/usr/local/texlive/2026/texmf-dist/metapost/base/marith.mp
(/usr/local/texlive/2026/texmf-dist/metapost/base/string.mp))
(/usr/local/texlive/2026/texmf-dist/metapost/base/format.mp
(/usr/local/texlive/2026/texmf-dist/metapost/base/string.mp)
(/usr/local/texlive/2026/texmf-dist/metapost/base/texnum.mp)))
MPT-14-006: valid=8; residual sum=1.55; mean=0.19374999999999998 [1{psfonts.map
}<cmr10.pfb><cmbx10.pfb><cmr8.pfb>] )
1 output file written: MPT-14-006.svg
Transcript written on MPT-14-006.log.
Command or parameter
Meaning
420 by 280 bp
Choose the final canvas before setting typography; bp means 1/72 inch.
mainpoint / residualpoint
Use shared x coordinates and separate explicit y ranges.
interval_at
Draw the stored lower and upper endpoints, with caps.
message
Capture numerical checks without drawing rounded values back into calculations.
Complete standalone MetaPost program
prologues:=3;outputformat:="svg";defaultfont:="cmr10";defaultscale:=1.1;colorBlue,Teal,Orange,Green,Grey,Light,Wash;Blue:=(0,84/255,159/255);Teal:=(0,177/255,183/255);Orange:=(246/255,168/255,0);Green:=(87/255,171/255,39/255);Grey:=(100/255,101/255,103/255);Light:=(236/255,236/255,237/255);Wash:=(232/255,241/255,250/255);% Format displayed numbers to hundredths using integer strings.vardefnumlabel(exprvalue)=saven,whole,frac;numericn,whole,frac;n:=round(100absvalue);whole:=floor(n/100);frac:=nmod100;(ifvalue<-.005:"-" & fidecimalwholeiffrac>0: & "." & iffrac<10:"0" & fidecimalfracfi)enddef;pickuppencirclescaled.9;outputtemplate:="MPT-14-006.svg";inputgraph;numericn,t[],observed[],model[],low[],high[],valid[];n:=0;gdata("data/readings.dat",row,n:=n+1;t[n]:=scantokensrow1;observed[n]:=scantokensrow2;model[n]:=scantokensrow3;low[n]:=scantokensrow4;high[n]:=scantokensrow5;valid[n]:=scantokensrow6;);vardefmainpoint(exprx,y)=(60+40x,120+16y)enddef;vardefresidualpoint(exprx,y)=(60+40x,77+30y)enddef;definterval_at(exprx,lo,hi)=drawmainpoint(x,lo)--mainpoint(x,hi)withcolorGrey;drawmainpoint(x,lo)+(-3,0)--mainpoint(x,lo)+(3,0)withcolorGrey;drawmainpoint(x,hi)+(-3,0)--mainpoint(x,hi)+(3,0)withcolorGrey;enddef;numericcount,total;count:=0;total:=0;forj=1upton:ifvalid[j]=1:count:=count+1;total:=total+observed[j]-model[j];fiendfor;defpublication_axes=drawmainpoint(0,6)--mainpoint(0,0)--mainpoint(8,0)withcolorGrey;drawresidualpoint(0,.8)--residualpoint(0,-.8)--residualpoint(8,-.8)withcolorGrey;drawresidualpoint(0,0)--residualpoint(8,0)dashedevenlywithcolorGrey;forx=0upto8:label.bot(decimalx,residualpoint(x,-.8));endfor;label.bot("Time (s)",(220,38));fory=0step2until6:label.lft(decimaly,mainpoint(0,y));endfor;fory=-.8step.8until.8:label.lft(numlabel(y),residualpoint(0,y));endfor;label.top("(a) Response (a.u.)",(220,213));label.top("(b) Residual (a.u.)",(220,100));enddef;beginfig(1);fillunitsquarexscaled420yscaled280withcolorwhite;% BEGIN DRAWINGpublication_axes;forj=1upton:ifvalid[j]=1:interval_at(t[j],low[j],high[j]);drawfullcirclescaled5shiftedmainpoint(t[j],observed[j])withcolorBlue;fillfullcirclescaled4shiftedresidualpoint(t[j],observed[j]-model[j])withcolorTeal;fiendfor;drawmainpoint(0,model[1])--mainpoint(8,model[n])dashedevenlywithpenpencirclescaled1.3withcolorOrange;label("Synthetic response and model"infont"cmbx10",(220,257));drawfullcirclescaled5shifted(90,242)withcolorBlue;label.rt("Observed + bounds",(98,242));draw(263,242)--(283,242)dashedevenlywithcolorOrange;label.rt("Model",(291,242));label("Synthetic data; missing at 3 s. Bounds are illustrative."infont"cmr8",(220,14));message"MPT-14-006: valid=" & decimalcount
& "; residual sum=" & numlabel(total)
& "; mean=" & decimal(total/count);% END DRAWINGlabel.lft("MPT-14-006"infont"cmr8",(412,270));setboundscurrentpicturetounitsquarexscaled420yscaled280;endfig;end.
This is MetaPost, version 3.00 (TeX Live 2026) (kpathsea version 6.4.2)
(/usr/local/texlive/2026/texmf-dist/metapost/base/mpost.mp
(/usr/local/texlive/2026/texmf-dist/metapost/base/plain.mp
Preloading the plain mem file, version 1.005) ) (./MPT-15-001.mp [1{psfonts.map
}<cmr8.pfb>] )
1 output file written: MPT-15-001.svg
Transcript written on MPT-15-001.log.
Command or parameter
Meaning
controls
Shape each side with its own cubic handles.
point t of leaf
Use times 0-1 for one side and 1-2 for the other.
Complete standalone MetaPost program
prologues:=3;outputformat:="svg";defaultfont:="cmr10";defaultscale:=1.1;colorBlue,Teal,Orange,Green,Grey,Light,Wash;Blue:=(0,84/255,159/255);Teal:=(0,177/255,183/255);Orange:=(246/255,168/255,0);Green:=(87/255,171/255,39/255);Grey:=(100/255,101/255,103/255);Light:=(236/255,236/255,237/255);Wash:=(232/255,241/255,250/255);% Format displayed numbers to hundredths using integer strings.vardefnumlabel(exprvalue)=saven,whole,frac;numericn,whole,frac;n:=round(100absvalue);whole:=floor(n/100);frac:=nmod100;(ifvalue<-.005:"-" & fidecimalwholeiffrac>0: & "." & iffrac<10:"0" & fidecimalfracfi)enddef;pickuppencirclescaled.9;outputtemplate:="MPT-15-001.svg";beginfig(1);fillunitsquarexscaled320yscaled220withcolorwhite;% BEGIN DRAWINGpathleaf,midrib;leaf:=(92,45)..controls(64,138)and(152,210)..(232,175)..controls(267,103)and(170,35)..cycle;midrib:=(92,45)..controls(143,92)and(187,132)..(232,175);fillleafwithcolor.82[Green,white];drawleafwithpenpencirclescaled1.5withcolorGreen;fori=1upto6:drawpoint(i/7)ofmidrib--point(i/7)ofleafwithcolorGreen;drawpoint(i/7)ofmidrib--point(2-i/7)ofleafwithcolorGreen;endfor;drawmidribwithpenpencirclescaled1.4withcolorBlue;draw(76,29)--(92,45)withpenpencirclescaled2withcolorBlue;% END DRAWINGlabel.lft("MPT-15-001"infont"cmr8",(312,210));setboundscurrentpicturetounitsquarexscaled320yscaled220;endfig;end.
Replace the filled silhouette with individual barbs. At each sample, the spine tangent supplies a local direction and its rotated unit vector supplies a normal. A sine envelope narrows the feather at both ends.
This is MetaPost, version 3.00 (TeX Live 2026) (kpathsea version 6.4.2)
(/usr/local/texlive/2026/texmf-dist/metapost/base/mpost.mp
(/usr/local/texlive/2026/texmf-dist/metapost/base/plain.mp
Preloading the plain mem file, version 1.005) ) (./MPT-15-002.mp [1{psfonts.map
}<cmr8.pfb>] )
1 output file written: MPT-15-002.svg
Transcript written on MPT-15-002.log.
Command or parameter
Meaning
unitvector direction t of spine
Normalise the tangent so barb widths use drawing units.
rotated 90
Construct a perpendicular local direction at each sample.
38sind(180t)
Use a bounded width envelope along the feather.
Complete standalone MetaPost program
prologues:=3;outputformat:="svg";defaultfont:="cmr10";defaultscale:=1.1;colorBlue,Teal,Orange,Green,Grey,Light,Wash;Blue:=(0,84/255,159/255);Teal:=(0,177/255,183/255);Orange:=(246/255,168/255,0);Green:=(87/255,171/255,39/255);Grey:=(100/255,101/255,103/255);Light:=(236/255,236/255,237/255);Wash:=(232/255,241/255,250/255);% Format displayed numbers to hundredths using integer strings.vardefnumlabel(exprvalue)=saven,whole,frac;numericn,whole,frac;n:=round(100absvalue);whole:=floor(n/100);frac:=nmod100;(ifvalue<-.005:"-" & fidecimalwholeiffrac>0: & "." & iffrac<10:"0" & fidecimalfracfi)enddef;pickuppencirclescaled.9;outputtemplate:="MPT-15-002.svg";beginfig(1);fillunitsquarexscaled320yscaled220withcolorwhite;% BEGIN DRAWINGpathspine;pairc,tangent,normal,lefttip,righttip;numericw;spine:=(94,42)..(142,110)..(217,181);fort=.06step.045until.96:c:=point(2t)ofspine;tangent:=unitvectordirection(2t)ofspine;normal:=tangentrotated90;w:=38sind(180t);lefttip:=c+w*normal+16t*tangent;righttip:=c-.78w*normal+13t*tangent;drawc..(.55[c,lefttip]+4tangent)..lefttipwithpenpencirclescaled1.1withcolorTeal;drawc..(.55[c,righttip]+4tangent)..righttipwithpenpencirclescaled1.1withcolorBlue;endfor;drawspinewithpenpencirclescaled1.8withcolorBlue;draw(84,28)--(94,42)withpenpencirclescaled1.8withcolorBlue;% END DRAWINGlabel.lft("MPT-15-002"infont"cmr8",(312,210));setboundscurrentpicturetounitsquarexscaled320yscaled220;endfig;end.
Layer tail and fins behind a smooth body. Repeated half circles make the scales in a separate picture, then a clip confines them to the body. Add the gill and eye last so they remain readable.
This is MetaPost, version 3.00 (TeX Live 2026) (kpathsea version 6.4.2)
(/usr/local/texlive/2026/texmf-dist/metapost/base/mpost.mp
(/usr/local/texlive/2026/texmf-dist/metapost/base/plain.mp
Preloading the plain mem file, version 1.005) ) (./MPT-15-003.mp [1{psfonts.map
}<cmr8.pfb>] )
1 output file written: MPT-15-003.svg
Transcript written on MPT-15-003.log.
Command or parameter
Meaning
image(...)
Collect texture strokes without clipping the fins or eye.
row mod 2
Offset alternate rows of scales.
clip scales to body
Retain only the texture inside the body silhouette.
Complete standalone MetaPost program
prologues:=3;outputformat:="svg";defaultfont:="cmr10";defaultscale:=1.1;colorBlue,Teal,Orange,Green,Grey,Light,Wash;Blue:=(0,84/255,159/255);Teal:=(0,177/255,183/255);Orange:=(246/255,168/255,0);Green:=(87/255,171/255,39/255);Grey:=(100/255,101/255,103/255);Light:=(236/255,236/255,237/255);Wash:=(232/255,241/255,250/255);% Format displayed numbers to hundredths using integer strings.vardefnumlabel(exprvalue)=saven,whole,frac;numericn,whole,frac;n:=round(100absvalue);whole:=floor(n/100);frac:=nmod100;(ifvalue<-.005:"-" & fidecimalwholeiffrac>0: & "." & iffrac<10:"0" & fidecimalfracfi)enddef;pickuppencirclescaled.9;outputtemplate:="MPT-15-003.svg";beginfig(1);fillunitsquarexscaled320yscaled220withcolorwhite;% BEGIN DRAWINGpathbody,tail;picturescales;body:=(77,106)..controls(119,170)and(225,169)..(271,109)..controls(229,46)and(125,48)..cycle;tail:=(91,107)--(41,151)--(52,105)--(41,63)--cycle;filltailwithcolor.25[Teal,white];drawtailwithcolorBlue;fill(139,151)--(174,184)--(209,151)--cyclewithcolorTeal;fill(148,67)--(184,40)--(206,68)--cyclewithcolorTeal;fillbodywithcolor.82[Teal,white];scales:=image(forrow=0upto7:forcol=0upto8:drawhalfcirclescaled22rotated-90shifted(87+20col+10(rowmod2),49+16row)withpenpencirclescaled.65withcolorTeal;endfor;endfor;);clipscalestobody;drawscales;drawbodywithpenpencirclescaled1.6withcolorBlue;draw(229,142)..(218,111)..(231,78)withcolorBlue;fillfullcirclescaled9shifted(244,121)withcolorBlue;fillfullcirclescaled3shifted(245,123)withcolorwhite;% END DRAWINGlabel.lft("MPT-15-003"infont"cmr8",(312,210));setboundscurrentpicturetounitsquarexscaled320yscaled220;endfig;end.
Ellipses establish the rim and saucer. The handle is a broad curve drawn behind the cup, while a smaller ellipse inside the rim suggests coffee. Open curves above it read as steam without a filled outline.
This is MetaPost, version 3.00 (TeX Live 2026) (kpathsea version 6.4.2)
(/usr/local/texlive/2026/texmf-dist/metapost/base/mpost.mp
(/usr/local/texlive/2026/texmf-dist/metapost/base/plain.mp
Preloading the plain mem file, version 1.005) ) (./MPT-15-004.mp [1{psfonts.map
}<cmr8.pfb>] )
1 output file written: MPT-15-004.svg
Transcript written on MPT-15-004.log.
Command or parameter
Meaning
xscaled / yscaled
Flatten a circle into a rim, coffee surface or saucer.
Two handle strokes
Place a narrow white stroke over a broad coloured stroke.
Layer order
Put the handle behind the cup and the rim above the body.
Complete standalone MetaPost program
prologues:=3;outputformat:="svg";defaultfont:="cmr10";defaultscale:=1.1;colorBlue,Teal,Orange,Green,Grey,Light,Wash;Blue:=(0,84/255,159/255);Teal:=(0,177/255,183/255);Orange:=(246/255,168/255,0);Green:=(87/255,171/255,39/255);Grey:=(100/255,101/255,103/255);Light:=(236/255,236/255,237/255);Wash:=(232/255,241/255,250/255);% Format displayed numbers to hundredths using integer strings.vardefnumlabel(exprvalue)=saven,whole,frac;numericn,whole,frac;n:=round(100absvalue);whole:=floor(n/100);frac:=nmod100;(ifvalue<-.005:"-" & fidecimalwholeiffrac>0: & "." & iffrac<10:"0" & fidecimalfracfi)enddef;pickuppencirclescaled.9;outputtemplate:="MPT-15-004.svg";beginfig(1);fillunitsquarexscaled320yscaled220withcolorwhite;% BEGIN DRAWINGpathcup,handle;fillfullcirclexscaled218yscaled24shifted(155,44)withcolorLight;drawfullcirclexscaled218yscaled24shifted(155,44)withcolorGrey;handle:=(221,128)..(270,134)..(269,86)..(219,79);drawhandlewithpenpencirclescaled13withcolorBlue;drawhandlewithpenpencirclescaled7withcolorwhite;cup:=(88,133)--(101,63)..(155,47)..(210,63)--(224,133)--cycle;fillcupwithcolor.87[Blue,white];drawcupwithpenpencirclescaled1.5withcolorBlue;fillfullcirclexscaled136yscaled33shifted(156,133)withcolorwhite;drawfullcirclexscaled136yscaled33shifted(156,133)withcolorBlue;fillfullcirclexscaled119yscaled21shifted(156,131)withcolor.35[Orange,Grey];draw(110,119)--(116,77)withpenpencirclescaled4withcolorwhite;forx=125step31until187:draw(x,157)..(x-6,170)..(x+5,184)..(x,196)withpenpencirclescaled1.5withcolorTeal;endfor;% END DRAWINGlabel.lft("MPT-15-004"infont"cmr8",(312,210));setboundscurrentpicturetounitsquarexscaled320yscaled220;endfig;end.
Compose an illustration from back to front: sky, beacon, water, distant headland, cliff and lighthouse. Clip the coloured bands to the tapering tower so one silhouette controls its entire facade.
This is MetaPost, version 3.00 (TeX Live 2026) (kpathsea version 6.4.2)
(/usr/local/texlive/2026/texmf-dist/metapost/base/mpost.mp
(/usr/local/texlive/2026/texmf-dist/metapost/base/plain.mp
Preloading the plain mem file, version 1.005) ) (./MPT-15-005.mp [1{psfonts.map
}<cmr8.pfb>] )
1 output file written: MPT-15-005.svg
Transcript written on MPT-15-005.log.
Command or parameter
Meaning
Back-to-front painting
Let later opaque shapes cover the layers behind them.
Tapered tower
Use a polygon as the shared boundary for facade and stripes.
clip bands to tower
Keep facade decoration aligned with the tower edges.
Complete standalone MetaPost program
prologues:=3;outputformat:="svg";defaultfont:="cmr10";defaultscale:=1.1;colorBlue,Teal,Orange,Green,Grey,Light,Wash;Blue:=(0,84/255,159/255);Teal:=(0,177/255,183/255);Orange:=(246/255,168/255,0);Green:=(87/255,171/255,39/255);Grey:=(100/255,101/255,103/255);Light:=(236/255,236/255,237/255);Wash:=(232/255,241/255,250/255);% Format displayed numbers to hundredths using integer strings.vardefnumlabel(exprvalue)=saven,whole,frac;numericn,whole,frac;n:=round(100absvalue);whole:=floor(n/100);frac:=nmod100;(ifvalue<-.005:"-" & fidecimalwholeiffrac>0: & "." & iffrac<10:"0" & fidecimalfracfi)enddef;pickuppencirclescaled.9;outputtemplate:="MPT-15-005.svg";beginfig(1);fillunitsquarexscaled320yscaled220withcolorwhite;% BEGIN DRAWINGpathtower,cliff;picturebands;fillunitsquarexscaled280yscaled164shifted(20,27)withcolorWash;fill(219,162)--(31,184)--(31,128)--cyclewithcolor.83[Orange,white];fillunitsquarexscaled280yscaled67shifted(20,27)withcolor.7[Teal,white];fill(20,94)--(58,114)--(102,101)--(146,94)--cyclewithcolor.7[Blue,white];fory=39step14until83:draw(32,y)--(116,y)withpenpencirclescaled1.2withcolorwhite;endfor;cliff:=(145,27)--(157,63)--(190,75)--(230,69)--(253,46)--(300,27)--cycle;fillcliffwithcolorGrey;tower:=(193,68)--(203,148)--(232,148)--(242,68)--cycle;filltowerwithcolorwhite;bands:=image(fory=87step30until117:fillunitsquarexscaled75yscaled14shifted(180,y)withcolorBlue;endfor;);clipbandstotower;drawbands;drawtowerwithcolorBlue;fillunitsquarexscaled39yscaled23shifted(198,148)withcolor.35[Orange,white];drawunitsquarexscaled39yscaled23shifted(198,148)withcolorBlue;draw(217.5,148)--(217.5,171)withcolorBlue;fill(193,171)--(217.5,190)--(242,171)--cyclewithcolorBlue;draw(191,147)--(244,147)withpenpencirclescaled2withcolorBlue;fillunitsquarexscaled10yscaled18shifted(213,68)withcolorBlue;% END DRAWINGlabel.lft("MPT-15-005"infont"cmr8",(312,210));setboundscurrentpicturetounitsquarexscaled320yscaled220;endfig;end.
Map three model coordinates to the drawing plane with a reusable projection. The two walls and roof planes share projected vertices. Different opaque tints suggest light; the construction uses no perspective foreshortening or hidden-surface solver.
This is MetaPost, version 3.00 (TeX Live 2026) (kpathsea version 6.4.2)
(/usr/local/texlive/2026/texmf-dist/metapost/base/mpost.mp
(/usr/local/texlive/2026/texmf-dist/metapost/base/plain.mp
Preloading the plain mem file, version 1.005) ) (./MPT-15-006.mp [1{psfonts.map
}<cmr8.pfb>] )
1 output file written: MPT-15-006.svg
Transcript written on MPT-15-006.log.
Command or parameter
Meaning
iso(x,y,z)
Use equal projected x and y scales with a separate vertical coordinate.
Shared projected vertices
Keep adjacent wall and roof faces joined without gaps.
Face tints
Assign a fixed light direction by colouring each plane consistently.
Complete standalone MetaPost program
prologues:=3;outputformat:="svg";defaultfont:="cmr10";defaultscale:=1.1;colorBlue,Teal,Orange,Green,Grey,Light,Wash;Blue:=(0,84/255,159/255);Teal:=(0,177/255,183/255);Orange:=(246/255,168/255,0);Green:=(87/255,171/255,39/255);Grey:=(100/255,101/255,103/255);Light:=(236/255,236/255,237/255);Wash:=(232/255,241/255,250/255);% Format displayed numbers to hundredths using integer strings.vardefnumlabel(exprvalue)=saven,whole,frac;numericn,whole,frac;n:=round(100absvalue);whole:=floor(n/100);frac:=nmod100;(ifvalue<-.005:"-" & fidecimalwholeiffrac>0: & "." & iffrac<10:"0" & fidecimalfracfi)enddef;pickuppencirclescaled.9;outputtemplate:="MPT-15-006.svg";beginfig(1);fillunitsquarexscaled320yscaled220withcolorwhite;% BEGIN DRAWINGvardefiso(exprx,y,z)=(160+34(x-y),52+17(x+y)+37z)enddef;pathfront,side,roofleft,roofright;front:=iso(0,0,0)--iso(2,0,0)--iso(2,0,1.7)--iso(1,0,2.55)--iso(0,0,1.7)--cycle;side:=iso(0,0,0)--iso(0,2,0)--iso(0,2,1.7)--iso(0,0,1.7)--cycle;roofleft:=iso(-.2,-.2,1.7)--iso(-.2,2.2,1.7)--iso(1,2.2,2.55)--iso(1,-.2,2.55)--cycle;roofright:=iso(1,-.2,2.55)--iso(1,2.2,2.55)--iso(2.2,2.2,1.7)--iso(2.2,-.2,1.7)--cycle;filliso(-.5,-.5,0)--iso(3,-.5,0)--iso(3,2.7,0)--iso(-.5,2.7,0)--cyclewithcolorWash;fillsidewithcolor.55[Blue,white];drawsidewithcolorBlue;fillfrontwithcolor.87[Blue,white];drawfrontwithcolorBlue;filliso(.7,0,0)--iso(1.2,0,0)--iso(1.2,0,1.15)--iso(.7,0,1.15)--cyclewithcolorBlue;filliso(0,.55,.65)--iso(0,1.35,.65)--iso(0,1.35,1.25)--iso(0,.55,1.25)--cyclewithcolor.35[Teal,white];drawiso(0,.95,.65)--iso(0,.95,1.25)withcolorBlue;fillroofleftwithcolor.45[Orange,white];drawroofleftwithcolorBlue;fillroofrightwithcolorOrange;drawroofrightwithcolorBlue;drawiso(1,-.2,2.55)--iso(1,2.2,2.55)withpenpencirclescaled1.5withcolorBlue;% END DRAWINGlabel.lft("MPT-15-006"infont"cmr8",(312,210));setboundscurrentpicturetounitsquarexscaled320yscaled220;endfig;end.
This is MetaPost, version 3.00 (TeX Live 2026) (kpathsea version 6.4.2)
(/usr/local/texlive/2026/texmf-dist/metapost/base/mpost.mp
(/usr/local/texlive/2026/texmf-dist/metapost/base/plain.mp
Preloading the plain mem file, version 1.005) ) (./MPT-16-001.mp [1{psfonts.map
}<cmr9.pfb><cmr8.pfb>] )
1 output file written: MPT-16-001.svg
Transcript written on MPT-16-001.log.
Command or parameter
Meaning
linecap / linejoin
Choose 0, 1 or 2 in the labelled left-to-right order.
interim
Limit the setting to the enclosing group.
Complete standalone MetaPost program
prologues:=3;outputformat:="svg";defaultfont:="cmr10";defaultscale:=1.1;colorBlue,Teal,Orange,Green,Grey,Light,Wash;Blue:=(0,84/255,159/255);Teal:=(0,177/255,183/255);Orange:=(246/255,168/255,0);Green:=(87/255,171/255,39/255);Grey:=(100/255,101/255,103/255);Light:=(236/255,236/255,237/255);Wash:=(232/255,241/255,250/255);% Format displayed numbers to hundredths using integer strings.vardefnumlabel(exprvalue)=saven,whole,frac;numericn,whole,frac;n:=round(100absvalue);whole:=floor(n/100);frac:=nmod100;(ifvalue<-.005:"-" & fidecimalwholeiffrac>0: & "." & iffrac<10:"0" & fidecimalfracfi)enddef;pickuppencirclescaled.9;outputtemplate:="MPT-16-001.svg";beginfig(1);fillunitsquarexscaled320yscaled220withcolorwhite;% BEGIN DRAWINGstringcapname[],joinname[];capname[0]:="butt";capname[1]:="rounded";capname[2]:="squared";joinname[0]:="mitered";joinname[1]:="rounded";joinname[2]:="beveled";fork=0upto2:begingroupinterimlinecap:=k;draw(39+99k,155)--(82+99k,155)withpenpencirclescaled13withcolorBlue;endgroup;forx=39+99k,82+99k:draw(x,143)--(x,167)withpenpencirclescaled.6withcolorOrange;endfor;label(capname[k]infont"cmr9",(60+99k,128));begingroupinterimlinejoin:=k;draw(35+99k,50)--(60+99k,94)--(85+99k,50)withpenpencirclescaled13withcolorTeal;endgroup;label(joinname[k]infont"cmr9",(60+99k,28));endfor;% END DRAWINGlabel.lft("MPT-16-001"infont"cmr8",(312,210));setboundscurrentpicturetounitsquarexscaled320yscaled220;endfig;end.
A fixed pen cannot change width along a stroke. Sample a centre line, offset it on each side along its normal and join the resulting polylines into a filled ribbon. This controlled example uses gentle curvature and narrow offsets to avoid self-intersections.
pathspine,leftedge,rightedge,ribbon;pairc,n;numericw;spine:=(34,67)..(99,150)..(183,77)..(281,151);fori=0upto80:c:=point(3i/80)ofspine;n:=(unitvectordirection(3i/80)ofspine)rotated90;w:=1+12*(sind(180i/80)**2);ifi=0:leftedge:=c+w*n;rightedge:=c-w*n;else:leftedge:=leftedge--(c+w*n);rightedge:=rightedge--(c-w*n);fi;endfor;ribbon:=leftedge--reverserightedge--cycle;fillribbonwithcolor.2[Blue,Teal];drawspinedashedevenlywithpenpencirclescaled.65withcolorwhite;label(btex width follows a sine envelope etexscaled.9,(160,32));
Actual output
MPT-16-002 · Rendered by MetaPost
MetaPost · exit 0
Native compiler log
Standard output
This is MetaPost, version 3.00 (TeX Live 2026) (kpathsea version 6.4.2)
(/usr/local/texlive/2026/texmf-dist/metapost/base/mpost.mp
(/usr/local/texlive/2026/texmf-dist/metapost/base/plain.mp
Preloading the plain mem file, version 1.005) ) (./MPT-16-002.mp [1{psfonts.map
}<cmr10.pfb><cmr8.pfb>] )
1 output file written: MPT-16-002.svg
Transcript written on MPT-16-002.log.
Command or parameter
Meaning
point / direction
Sample location and tangent at the same path time.
c + w*n / c - w*n
Offset to opposite sides by a variable half width.
reverse rightedge
Walk back along the second edge to close the ribbon.
Complete standalone MetaPost program
prologues:=3;outputformat:="svg";defaultfont:="cmr10";defaultscale:=1.1;colorBlue,Teal,Orange,Green,Grey,Light,Wash;Blue:=(0,84/255,159/255);Teal:=(0,177/255,183/255);Orange:=(246/255,168/255,0);Green:=(87/255,171/255,39/255);Grey:=(100/255,101/255,103/255);Light:=(236/255,236/255,237/255);Wash:=(232/255,241/255,250/255);% Format displayed numbers to hundredths using integer strings.vardefnumlabel(exprvalue)=saven,whole,frac;numericn,whole,frac;n:=round(100absvalue);whole:=floor(n/100);frac:=nmod100;(ifvalue<-.005:"-" & fidecimalwholeiffrac>0: & "." & iffrac<10:"0" & fidecimalfracfi)enddef;pickuppencirclescaled.9;outputtemplate:="MPT-16-002.svg";beginfig(1);fillunitsquarexscaled320yscaled220withcolorwhite;% BEGIN DRAWINGpathspine,leftedge,rightedge,ribbon;pairc,n;numericw;spine:=(34,67)..(99,150)..(183,77)..(281,151);fori=0upto80:c:=point(3i/80)ofspine;n:=(unitvectordirection(3i/80)ofspine)rotated90;w:=1+12*(sind(180i/80)**2);ifi=0:leftedge:=c+w*n;rightedge:=c-w*n;else:leftedge:=leftedge--(c+w*n);rightedge:=rightedge--(c-w*n);fi;endfor;ribbon:=leftedge--reverserightedge--cycle;fillribbonwithcolor.2[Blue,Teal];drawspinedashedevenlywithpenpencirclescaled.65withcolorwhite;label(btex width follows a sine envelope etexscaled.9,(160,32));% END DRAWINGlabel.lft("MPT-16-002"infont"cmr8",(312,210));setboundscurrentpicturetounitsquarexscaled320yscaled220;endfig;end.
Keep the leaf geometry identical while switching between outline, solid silhouette and clipped hatching. A macro owns the style decision; its local variables let the caller repeat it without leaking temporary paths.
This is MetaPost, version 3.00 (TeX Live 2026) (kpathsea version 6.4.2)
(/usr/local/texlive/2026/texmf-dist/metapost/base/mpost.mp
(/usr/local/texlive/2026/texmf-dist/metapost/base/plain.mp
Preloading the plain mem file, version 1.005) ) (./MPT-16-003.mp [1{psfonts.map
}<cmr9.pfb><cmr8.pfb>] )
1 output file written: MPT-16-003.svg
Transcript written on MPT-16-003.log.
Command or parameter
Meaning
style
Select a treatment while keeping one shared boundary.
save p,h
Make the macro paths and pictures local to each call.
clip
Confine parallel ink strokes to the silhouette.
Complete standalone MetaPost program
prologues:=3;outputformat:="svg";defaultfont:="cmr10";defaultscale:=1.1;colorBlue,Teal,Orange,Green,Grey,Light,Wash;Blue:=(0,84/255,159/255);Teal:=(0,177/255,183/255);Orange:=(246/255,168/255,0);Green:=(87/255,171/255,39/255);Grey:=(100/255,101/255,103/255);Light:=(236/255,236/255,237/255);Wash:=(232/255,241/255,250/255);% Format displayed numbers to hundredths using integer strings.vardefnumlabel(exprvalue)=saven,whole,frac;numericn,whole,frac;n:=round(100absvalue);whole:=floor(n/100);frac:=nmod100;(ifvalue<-.005:"-" & fidecimalwholeiffrac>0: & "." & iffrac<10:"0" & fidecimalfracfi)enddef;pickuppencirclescaled.9;outputtemplate:="MPT-16-003.svg";beginfig(1);fillunitsquarexscaled320yscaled220withcolorwhite;% BEGIN DRAWINGdefleafmark(expranchor,style)=begingroupsavep,h;pathp;pictureh;p:=((0,-36)..controls(-45,-8)and(-30,39)..(0,43)..controls(37,16)and(38,-22)..cycle)shiftedanchor;ifstyle=1:fillpwithcolorBlue;elseifstyle=2:h:=image(forx=-90step6until60:draw((x,-45)--(x+95,50))shiftedanchorwithpenpencirclescaled.7withcolorBlue;endfor;);cliphtop;drawh;fi;drawpwithpenpencirclescaled1.3withcolorBlue;draw(anchor+(0,-45))--(anchor+(0,30))withcolorifstyle=1:whiteelse:Bluefi;endgroup;enddef;leafmark((60,115),0);leafmark((160,115),1);leafmark((260,115),2);label("outline"infont"cmr9",(60,43));label("solid"infont"cmr9",(160,43));label("hatched"infont"cmr9",(260,43));% END DRAWINGlabel.lft("MPT-16-003"infont"cmr8",(312,210));setboundscurrentpicturetounitsquarexscaled320yscaled220;endfig;end.
Use the same round badge in three treatments. An offset shadow is one translated silhouette; a long shadow is a finite stack of small translations. Draw the badge and its white mark above the shadow. All colours are opaque.
This is MetaPost, version 3.00 (TeX Live 2026) (kpathsea version 6.4.2)
(/usr/local/texlive/2026/texmf-dist/metapost/base/mpost.mp
(/usr/local/texlive/2026/texmf-dist/metapost/base/plain.mp
Preloading the plain mem file, version 1.005) ) (./MPT-16-004.mp [1{psfonts.map
}<cmr9.pfb><cmr8.pfb>] )
1 output file written: MPT-16-004.svg
Transcript written on MPT-16-004.log.
Command or parameter
Meaning
shifted (7,-7)
Give a silhouette an explicit offset from its object.
for d=20 step -1 until 1
Build a bounded extrusion from back to front.
Opaque shadow tint
Mix a colour with white before painting the badge on top.
Complete standalone MetaPost program
prologues:=3;outputformat:="svg";defaultfont:="cmr10";defaultscale:=1.1;colorBlue,Teal,Orange,Green,Grey,Light,Wash;Blue:=(0,84/255,159/255);Teal:=(0,177/255,183/255);Orange:=(246/255,168/255,0);Green:=(87/255,171/255,39/255);Grey:=(100/255,101/255,103/255);Light:=(236/255,236/255,237/255);Wash:=(232/255,241/255,250/255);% Format displayed numbers to hundredths using integer strings.vardefnumlabel(exprvalue)=saven,whole,frac;numericn,whole,frac;n:=round(100absvalue);whole:=floor(n/100);frac:=nmod100;(ifvalue<-.005:"-" & fidecimalwholeiffrac>0: & "." & iffrac<10:"0" & fidecimalfracfi)enddef;pickuppencirclescaled.9;outputtemplate:="MPT-16-004.svg";beginfig(1);fillunitsquarexscaled320yscaled220withcolorwhite;% BEGIN DRAWINGpathbadge,mark;pairc;badge:=fullcirclescaled57;mark:=(-15,0)--(-4,-10)--(17,13);fork=0upto2:c:=(61+99k,119);fillunitsquarexscaled87yscaled113shifted(xpartc-43,60)withcolorWash;ifk=1:fillbadgeshifted(c+(7,-7))withcolor.73[Blue,white];elseifk=2:ford=20step-1until1:fillbadgeshifted(c+(d,-d))withcolor.73[Blue,white];endfor;fi;fillbadgeshiftedcwithcolorBlue;drawmarkshiftedcwithpenpencirclescaled4withcolorwhite;endfor;label("flat"infont"cmr9",(61,38));label("offset"infont"cmr9",(160,38));label("long"infont"cmr9",(259,38));% END DRAWINGlabel.lft("MPT-16-004"infont"cmr8",(312,210));setboundscurrentpicturetounitsquarexscaled320yscaled220;endfig;end.
Give background, surface, ink and accent separate roles. The same small landscape uses two explicit palettes. Change the role values at the panel boundary; geometry and line widths remain identical.
This is MetaPost, version 3.00 (TeX Live 2026) (kpathsea version 6.4.2)
(/usr/local/texlive/2026/texmf-dist/metapost/base/mpost.mp
(/usr/local/texlive/2026/texmf-dist/metapost/base/plain.mp
Preloading the plain mem file, version 1.005) ) (./MPT-16-005.mp [1{psfonts.map
}<cmr9.pfb><cmr8.pfb>] )
1 output file written: MPT-16-005.svg
Transcript written on MPT-16-005.log.
Command or parameter
Meaning
background / surface / ink / accent
Name visual roles independently of particular RGB values.
Palette branch
Change all role assignments together for each scene.
Same geometry
Compare palette effects without changing positions or scale.
Complete standalone MetaPost program
prologues:=3;outputformat:="svg";defaultfont:="cmr10";defaultscale:=1.1;colorBlue,Teal,Orange,Green,Grey,Light,Wash;Blue:=(0,84/255,159/255);Teal:=(0,177/255,183/255);Orange:=(246/255,168/255,0);Green:=(87/255,171/255,39/255);Grey:=(100/255,101/255,103/255);Light:=(236/255,236/255,237/255);Wash:=(232/255,241/255,250/255);% Format displayed numbers to hundredths using integer strings.vardefnumlabel(exprvalue)=saven,whole,frac;numericn,whole,frac;n:=round(100absvalue);whole:=floor(n/100);frac:=nmod100;(ifvalue<-.005:"-" & fidecimalwholeiffrac>0: & "." & iffrac<10:"0" & fidecimalfracfi)enddef;pickuppencirclescaled.9;outputtemplate:="MPT-16-005.svg";beginfig(1);fillunitsquarexscaled320yscaled220withcolorwhite;% BEGIN DRAWINGcolorbackground,surface,ink,accent;pairc;fork=0upto1:c:=(23+148k,36);ifk=0:background:=Wash;surface:=white;ink:=Blue;accent:=Orange;else:background:=.7Blue;surface:=.85Blue;ink:=white;accent:=Teal;fi;fillunitsquarexscaled126yscaled151shiftedcwithcolorbackground;fillfullcirclescaled29shifted(c+(91,113))withcoloraccent;fill((8,44)--(40,93)--(66,61)--(86,83)--(118,44)--cycle)shiftedcwithcolorsurface;draw((8,44)--(40,93)--(66,61)--(86,83)--(118,44))shiftedcwithpenpencirclescaled1.3withcolorink;draw((14,25)--(112,25))shiftedcwithcoloraccent;label(ifk=0:"light"else:"dark"fiinfont"cmr9",c+(63,12))withcolorink;endfor;% END DRAWINGlabel.lft("MPT-16-005"infont"cmr8",(312,210));setboundscurrentpicturetounitsquarexscaled320yscaled220;endfig;end.
A road casing is a wide outer stroke covered by a narrower inner stroke. Paint all local-road casings before their interiors to join the junction cleanly. The main road crosses the river last, so its casing also reads as a bridge. This is an invented map.
This is MetaPost, version 3.00 (TeX Live 2026) (kpathsea version 6.4.2)
(/usr/local/texlive/2026/texmf-dist/metapost/base/mpost.mp
(/usr/local/texlive/2026/texmf-dist/metapost/base/plain.mp
Preloading the plain mem file, version 1.005) ) (./MPT-16-006.mp [1{psfonts.map
}<cmr10.pfb><cmr8.pfb>] )
1 output file written: MPT-16-006.svg
Transcript written on MPT-16-006.log.
Command or parameter
Meaning
Casing then interior
Use two widths on one path to make a bordered road.
Two passes over local roads
Cover all casing ends with the joined inner strokes.
Road after river
Keep the crossing above the water by drawing order.
Complete standalone MetaPost program
prologues:=3;outputformat:="svg";defaultfont:="cmr10";defaultscale:=1.1;colorBlue,Teal,Orange,Green,Grey,Light,Wash;Blue:=(0,84/255,159/255);Teal:=(0,177/255,183/255);Orange:=(246/255,168/255,0);Green:=(87/255,171/255,39/255);Grey:=(100/255,101/255,103/255);Light:=(236/255,236/255,237/255);Wash:=(232/255,241/255,250/255);% Format displayed numbers to hundredths using integer strings.vardefnumlabel(exprvalue)=saven,whole,frac;numericn,whole,frac;n:=round(100absvalue);whole:=floor(n/100);frac:=nmod100;(ifvalue<-.005:"-" & fidecimalwholeiffrac>0: & "." & iffrac<10:"0" & fidecimalfracfi)enddef;pickuppencirclescaled.9;outputtemplate:="MPT-16-006.svg";beginfig(1);fillunitsquarexscaled320yscaled220withcolorwhite;% BEGIN DRAWINGpathriver,mainroad,localroad[];river:=(29,172)..(101,146)..(171,164)..(291,47);mainroad:=(24,55)..(113,83)..(202,98)..(296,158);localroad[1]:=(76,182)..(92,124)..(113,83)..(101,29);localroad[2]:=(202,98)..(236,58)..(286,32);fillunitsquarexscaled280yscaled166shifted(20,26)withcolor.93[Green,white];drawriverwithpenpencirclescaled23withcolor.65[Teal,white];begingroupinterimlinecap:=rounded;interimlinejoin:=rounded;fork=1upto2:drawlocalroad[k]withpenpencirclescaled12withcolorGrey;endfor;fork=1upto2:drawlocalroad[k]withpenpencirclescaled9withcolorwhite;endfor;drawmainroadwithpenpencirclescaled17withcolorBlue;drawmainroadwithpenpencirclescaled12withcolor.6[Orange,white];drawmainroaddasheddashpattern(on7off5)withpenpencirclescaled1withcolorwhite;endgroup;fillfullcirclescaled7shifted(113,83)withcolorBlue;label.top("West",(58,85));label.top("East",(269,157));% END DRAWINGlabel.lft("MPT-16-006"infont"cmr8",(312,210));setboundscurrentpicturetounitsquarexscaled320yscaled220;endfig;end.
This is MetaPost, version 3.00 (TeX Live 2026) (kpathsea version 6.4.2)
(/usr/local/texlive/2026/texmf-dist/metapost/base/mpost.mp
(/usr/local/texlive/2026/texmf-dist/metapost/base/plain.mp
Preloading the plain mem file, version 1.005) ) (./MPT-17-001.mp [1{psfonts.map
}<cmr9.pfb><cmr8.pfb>] )
1 output file written: MPT-17-001.svg
Transcript written on MPT-17-001.log.
Command or parameter
Meaning
spacing
Set the distance between hatch origins.
Second line family
Cross two directions to add ink density.
Complete standalone MetaPost program
prologues:=3;outputformat:="svg";defaultfont:="cmr10";defaultscale:=1.1;colorBlue,Teal,Orange,Green,Grey,Light,Wash;Blue:=(0,84/255,159/255);Teal:=(0,177/255,183/255);Orange:=(246/255,168/255,0);Green:=(87/255,171/255,39/255);Grey:=(100/255,101/255,103/255);Light:=(236/255,236/255,237/255);Wash:=(232/255,241/255,250/255);% Format displayed numbers to hundredths using integer strings.vardefnumlabel(exprvalue)=saven,whole,frac;numericn,whole,frac;n:=round(100absvalue);whole:=floor(n/100);frac:=nmod100;(ifvalue<-.005:"-" & fidecimalwholeiffrac>0: & "." & iffrac<10:"0" & fidecimalfracfi)enddef;pickuppencirclescaled.9;outputtemplate:="MPT-17-001.svg";beginfig(1);fillunitsquarexscaled320yscaled220withcolorwhite;% BEGIN DRAWINGpathdisc;picturehatch;numericspacing;pairc;fork=0upto2:c:=(60+100k,116);disc:=fullcirclescaled77shiftedc;spacing:=ifk=0:9else:6fi;hatch:=image(forx=-90stepspacinguntil90:draw((x,-55)--(x+110,55))shiftedcwithpenpencirclescaled.7withcolorBlue;ifk=2:draw((x,55)--(x+110,-55))shiftedcwithpenpencirclescaled.7withcolorBlue;fi;endfor;);cliphatchtodisc;drawhatch;drawdiscwithpenpencirclescaled1.2withcolorBlue;endfor;label("sparse"infont"cmr9",(60,51));label("dense"infont"cmr9",(160,51));label("crossed"infont"cmr9",(260,51));% END DRAWINGlabel.lft("MPT-17-001"infont"cmr8",(312,210));setboundscurrentpicturetounitsquarexscaled320yscaled220;endfig;end.
Keep a regular dot lattice and vary only the radius from left to right. Dot radius stays below half the lattice spacing, so dots do not overlap. Clip the field to an oval; no raster image or random sampling is involved.
This is MetaPost, version 3.00 (TeX Live 2026) (kpathsea version 6.4.2)
(/usr/local/texlive/2026/texmf-dist/metapost/base/mpost.mp
(/usr/local/texlive/2026/texmf-dist/metapost/base/plain.mp
Preloading the plain mem file, version 1.005) ) (./MPT-17-002.mp [1{psfonts.map
}<cmr10.pfb><cmr8.pfb>] )
1 output file written: MPT-17-002.svg
Transcript written on MPT-17-002.log.
Command or parameter
Meaning
8-unit lattice
Keep dot centres equally spaced in both directions.
scaled (2radius)
MetaPost scales the unit circle by its diameter.
radius < 4
Keep neighbouring dots separate at every shade.
Complete standalone MetaPost program
prologues:=3;outputformat:="svg";defaultfont:="cmr10";defaultscale:=1.1;colorBlue,Teal,Orange,Green,Grey,Light,Wash;Blue:=(0,84/255,159/255);Teal:=(0,177/255,183/255);Orange:=(246/255,168/255,0);Green:=(87/255,171/255,39/255);Grey:=(100/255,101/255,103/255);Light:=(236/255,236/255,237/255);Wash:=(232/255,241/255,250/255);% Format displayed numbers to hundredths using integer strings.vardefnumlabel(exprvalue)=saven,whole,frac;numericn,whole,frac;n:=round(100absvalue);whole:=floor(n/100);frac:=nmod100;(ifvalue<-.005:"-" & fidecimalwholeiffrac>0: & "." & iffrac<10:"0" & fidecimalfracfi)enddef;pickuppencirclescaled.9;outputtemplate:="MPT-17-002.svg";beginfig(1);fillunitsquarexscaled320yscaled220withcolorwhite;% BEGIN DRAWINGpathoval;picturedots;numericradius;oval:=fullcirclexscaled270yscaled133shifted(160,112);dots:=image(forrow=0upto18:forcol=0upto35:radius:=.35+2.9(col/35);fillfullcirclescaled(2radius)shifted(20+8col,40+8row)withcolorBlue;endfor;endfor;);clipdotstooval;drawdots;drawovalwithpenpencirclescaled1withcolorBlue;label(btex fixed spacing, increasing dot radius etexscaled.9,(160,29));% END DRAWINGlabel.lft("MPT-17-002"infont"cmr8",(312,210));setboundscurrentpicturetounitsquarexscaled320yscaled220;endfig;end.
Modulate the radius of a circle with a periodic sine. Twelve phase shifts weave a fine ornamental band around a clear centre. Sampled polylines make the period and amplitude explicit; the first and last samples meet through cycle.
This is MetaPost, version 3.00 (TeX Live 2026) (kpathsea version 6.4.2)
(/usr/local/texlive/2026/texmf-dist/metapost/base/mpost.mp
(/usr/local/texlive/2026/texmf-dist/metapost/base/plain.mp
Preloading the plain mem file, version 1.005) ) (./MPT-17-003.mp [1{psfonts.map
}<cmbx10.pfb><cmr10.pfb><cmr8.pfb>] )
1 output file written: MPT-17-003.svg
Transcript written on MPT-17-003.log.
Command or parameter
Meaning
76 + 9sind(12a+phase)
Set mean radius, radial amplitude and twelve oscillations per turn.
phase
Shift the oscillation while leaving the base circle fixed.
.35-unit pen
Keep overlapping lines fine enough for a legible ornamental band.
Complete standalone MetaPost program
prologues:=3;outputformat:="svg";defaultfont:="cmr10";defaultscale:=1.1;colorBlue,Teal,Orange,Green,Grey,Light,Wash;Blue:=(0,84/255,159/255);Teal:=(0,177/255,183/255);Orange:=(246/255,168/255,0);Green:=(87/255,171/255,39/255);Grey:=(100/255,101/255,103/255);Light:=(236/255,236/255,237/255);Wash:=(232/255,241/255,250/255);% Format displayed numbers to hundredths using integer strings.vardefnumlabel(exprvalue)=saven,whole,frac;numericn,whole,frac;n:=round(100absvalue);whole:=floor(n/100);frac:=nmod100;(ifvalue<-.005:"-" & fidecimalwholeiffrac>0: & "." & iffrac<10:"0" & fidecimalfracfi)enddef;pickuppencirclescaled.9;outputtemplate:="MPT-17-003.svg";beginfig(1);fillunitsquarexscaled320yscaled220withcolorwhite;% BEGIN DRAWINGpathp;numerica,r;pairc;c:=(160,109);forphase=0step30until330:forj=0upto359:a:=j;r:=76+9sind(12a+phase);ifj=0:p:=c+r*dir(a);else:p:=p--(c+r*dir(a));fi;endfor;drawp--cyclewithpenpencirclescaled.35withcolor(phase/440)[Blue,Teal];endfor;drawfullcirclescaled130shiftedcwithcolorBlue;drawfullcirclescaled176shiftedcwithcolorBlue;label("MP"infont"cmbx10"scaled2.6,c+(0,4))withcolorBlue;label(btex VECTOR ENGRAVING etexscaled.7,c+(0,-18))withcolorBlue;% END DRAWINGlabel.lft("MPT-17-003"infont"cmr8",(312,210));setboundscurrentpicturetounitsquarexscaled320yscaled220;endfig;end.
Two sinusoidal strands meet at four known crossings. Draw both strands, then redraw a short section of the selected upper strand at each crossing with a white casing. Alternating that selection creates the woven order without a general intersection solver.
This is MetaPost, version 3.00 (TeX Live 2026) (kpathsea version 6.4.2)
(/usr/local/texlive/2026/texmf-dist/metapost/base/mpost.mp
(/usr/local/texlive/2026/texmf-dist/metapost/base/plain.mp
Preloading the plain mem file, version 1.005) ) (./MPT-17-004.mp [1{psfonts.map
}<cmr10.pfb><cmr8.pfb>] )
1 output file written: MPT-17-004.svg
Transcript written on MPT-17-004.log.
Command or parameter
Meaning
Opposite sine offsets
Construct crossings at sample times 0, 40, 80 and 120.
k mod 2
Alternate which strand passes above the other.
White casing
Clear the lower strand; butt caps keep the bridge joined.
Complete standalone MetaPost program
prologues:=3;outputformat:="svg";defaultfont:="cmr10";defaultscale:=1.1;colorBlue,Teal,Orange,Green,Grey,Light,Wash;Blue:=(0,84/255,159/255);Teal:=(0,177/255,183/255);Orange:=(246/255,168/255,0);Green:=(87/255,171/255,39/255);Grey:=(100/255,101/255,103/255);Light:=(236/255,236/255,237/255);Wash:=(232/255,241/255,250/255);% Format displayed numbers to hundredths using integer strings.vardefnumlabel(exprvalue)=saven,whole,frac;numericn,whole,frac;n:=round(100absvalue);whole:=floor(n/100);frac:=nmod100;(ifvalue<-.005:"-" & fidecimalwholeiffrac>0: & "." & iffrac<10:"0" & fidecimalfracfi)enddef;pickuppencirclescaled.9;outputtemplate:="MPT-17-004.svg";beginfig(1);fillunitsquarexscaled320yscaled220withcolorwhite;% BEGIN DRAWINGpathupper,lower,bridge;upper:=(30,110);lower:=(30,110);forj=1upto120:upper:=upper--(30+260j/120,110+35sind(540j/120));lower:=lower--(30+260j/120,110-35sind(540j/120));endfor;drawupperwithpenpencirclescaled13withcolorBlue;drawlowerwithpenpencirclescaled13withcolorTeal;fork=0upto3:bridge:=subpath(max(0,40k-3),min(120,40k+3))ofif(kmod2)=0:upperelse:lowerfi;begingroupinterimlinecap:=butt;drawbridgewithpenpencirclescaled19withcolorwhite;drawbridgewithpenpencirclescaled13withcolorif(kmod2)=0:Blueelse:Tealfi;endgroup;endfor;label(btex alternating crossings etexscaled.9,(160,42));% END DRAWINGlabel.lft("MPT-17-004"infont"cmr8",(312,210));setboundscurrentpicturetounitsquarexscaled320yscaled220;endfig;end.
Repeat concentric upper semicircles on staggered rows. Paint a background semicircle before each group so the next row hides the lower parts of the row behind it. Clip the complete pattern to a rectangular swatch and keep the border separate.
This is MetaPost, version 3.00 (TeX Live 2026) (kpathsea version 6.4.2)
(/usr/local/texlive/2026/texmf-dist/metapost/base/mpost.mp
(/usr/local/texlive/2026/texmf-dist/metapost/base/plain.mp
Preloading the plain mem file, version 1.005) ) (./MPT-17-005.mp [1{psfonts.map
}<cmr8.pfb>] )
1 output file written: MPT-17-005.svg
Transcript written on MPT-17-005.log.
Command or parameter
Meaning
halfcircle
Reuse the standard upper semicircle at four diameters.
40(row mod 2)
Shift alternate rows by half the 80-unit horizontal repeat.
row=7 downto -1
Paint the higher rows first so lower waves overlap them.
Complete standalone MetaPost program
prologues:=3;outputformat:="svg";defaultfont:="cmr10";defaultscale:=1.1;colorBlue,Teal,Orange,Green,Grey,Light,Wash;Blue:=(0,84/255,159/255);Teal:=(0,177/255,183/255);Orange:=(246/255,168/255,0);Green:=(87/255,171/255,39/255);Grey:=(100/255,101/255,103/255);Light:=(236/255,236/255,237/255);Wash:=(232/255,241/255,250/255);% Format displayed numbers to hundredths using integer strings.vardefnumlabel(exprvalue)=saven,whole,frac;numericn,whole,frac;n:=round(100absvalue);whole:=floor(n/100);frac:=nmod100;(ifvalue<-.005:"-" & fidecimalwholeiffrac>0: & "." & iffrac<10:"0" & fidecimalfracfi)enddef;pickuppencirclescaled.9;outputtemplate:="MPT-17-005.svg";beginfig(1);fillunitsquarexscaled320yscaled220withcolorwhite;% BEGIN DRAWINGpicturewaves;pathswatch;pairc;swatch:=unitsquarexscaled272yscaled150shifted(24,34);waves:=image(forrow=7downto-1:forcol=-1upto4:c:=(24+80col+40(rowmod2),34+24row);fill(halfcirclescaled80--cycle)shiftedcwithcolorWash;fordiameter=20step20until80:drawhalfcirclescaleddiametershiftedcwithpenpencirclescaled1.2withcolorBlue;endfor;endfor;endfor;);clipwavestoswatch;drawwaves;drawswatchwithpenpencirclescaled1.3withcolorBlue;% END DRAWINGlabel.lft("MPT-17-005"infont"cmr8",(312,210));setboundscurrentpicturetounitsquarexscaled320yscaled220;endfig;end.
Split a heading into individual glyph pictures and place them at equal angular steps. Rotate each glyph to the local tangent of the circular baseline. Leave a blank step for spaces and use TeX for the lower caption. This uses fixed angular spacing rather than automatic optical kerning; short uppercase text suits the method.
This is MetaPost, version 3.00 (TeX Live 2026) (kpathsea version 6.4.2)
(/usr/local/texlive/2026/texmf-dist/metapost/base/mpost.mp
(/usr/local/texlive/2026/texmf-dist/metapost/base/plain.mp
Preloading the plain mem file, version 1.005) ) (./MPT-17-006.mp [1{psfonts.map
}<cmbx10.pfb><cmr10.pfb><cmr8.pfb>] )
1 output file written: MPT-17-006.svg
Transcript written on MPT-17-006.log.
Command or parameter
Meaning
substring (k,k+1) of heading
Extract one character as a separate label picture.
c + 67dir(a)
Place glyph centres on a circular baseline.
rotated (a-90)
Orient each glyph along the clockwise tangent.
Blank step / btex ... etex
Reserve a position without drawing a space glyph; let TeX set word spacing in the caption.
Complete standalone MetaPost program
prologues:=3;outputformat:="svg";defaultfont:="cmr10";defaultscale:=1.1;colorBlue,Teal,Orange,Green,Grey,Light,Wash;Blue:=(0,84/255,159/255);Teal:=(0,177/255,183/255);Orange:=(246/255,168/255,0);Green:=(87/255,171/255,39/255);Grey:=(100/255,101/255,103/255);Light:=(236/255,236/255,237/255);Wash:=(232/255,241/255,250/255);% Format displayed numbers to hundredths using integer strings.vardefnumlabel(exprvalue)=saven,whole,frac;numericn,whole,frac;n:=round(100absvalue);whole:=floor(n/100);frac:=nmod100;(ifvalue<-.005:"-" & fidecimalwholeiffrac>0: & "." & iffrac<10:"0" & fidecimalfracfi)enddef;pickuppencirclescaled.9;outputtemplate:="MPT-17-006.svg";beginfig(1);fillunitsquarexscaled320yscaled220withcolorwhite;% BEGIN DRAWINGstringheading;pairc;numerica;pathleaf;c:=(160,106);heading:="METAPOST STUDIO";drawfullcirclescaled173shiftedcwithpenpencirclescaled1.5withcolorBlue;drawfullcirclescaled162shiftedcwithpenpencirclescaled.6withcolorBlue;fork=0uptolengthheading-1:a:=160-10k;ifsubstring(k,k+1)ofheading<>" ":label((substring(k,k+1)ofheadinginfont"cmbx10")rotated(a-90),c+67dir(a))withcolorBlue;fi;endfor;draw(c+(-20,-27))..c..(c+(17,31))withpenpencirclescaled1.5withcolorBlue;leaf:=(0,0)..controls(-5,16)and(13,24)..(22,22)..controls(24,8)and(9,0)..cycle;fork=0upto2:fillleafrotated(20+12k)shifted(c+(-10+8k,-14+17k))withcolorTeal;fillleafreflectedabout((0,0),(0,1))rotated(-15+12k)shifted(c+(-10+8k,-14+17k))withcolorBlue;endfor;label(btex DRAW / REFINE / REPEAT etexscaled.7,c+(0,-47))withcolorBlue;fillfullcirclescaled3shifted(c+(-63,-31))withcolorOrange;fillfullcirclescaled3shifted(c+(63,-31))withcolorOrange;% END DRAWINGlabel.lft("MPT-17-006"infont"cmr8",(312,210));setboundscurrentpicturetounitsquarexscaled320yscaled220;endfig;end.